Sample Category Title
Euro Trading A Tad Higher, Ahead Of The Euro-Zone’s Unemployment Rate Data
For the 24 hours to 23:00 GMT, the EUR rose 0.15% against the USD and closed at 1.0909.
On Friday, data indicated that the Euro-zone's flash consumer price index (CPI) climbed more-than-anticipated by 1.9% on an annual basis in April, jumping back to the European Central Bank's (ECB) target of just below 2.0%. Markets expected the CPI to advance 1.8%, following a rise of 1.5% in the prior month.
Separately, Germany's retail sales unexpectedly climbed 0.1% MoM in March, compared to a revised advance of 1.1% in the previous month, while market participants envisaged for a flat reading.
Macroeconomic data released in the US indicated that the ISM manufacturing activity index dropped more-than-expected to a level of 54.8 in April, expanding at its weakest pace in four months, thus adding to the narrative of a slowdown in the nation's economic momentum. Markets were expecting the index to ease to a level of 56.5, compared to a level of 57.2 recorded in the previous month. Moreover, the nation's construction spending unexpectedly eased 0.2% on a monthly basis in March, defying investor consensus for a gain of 0.4% and after recording a revised advance of 1.8% in the previous month. Also, the nation's final Markit manufacturing PMI declined to a level of 52.8 in April, confirming the preliminary print and compared to a level of 53.3 in the previous month.
In other economic news, the nation's personal spending remained flat for a second straight month in March, confounding market expectations for a rise of 0.2%. In the prior month, personal spending had registered a revised flat reading. On the contrary, the nation's personal income gained 0.2% in March, falling short of market expectations for a rise of 0.3%. In the prior month, personal income had recorded a revised rise of 0.3%.
On Friday, the preliminary gross domestic product (GDP) data revealed that the US annualised GDP growth expanded 0.7% on a quarterly basis in the first quarter of 2017, growing at its weakest pace in 3 years, as consumers pulled back sharply on spending. The nation's GDP grew 2.1% in the prior quarter, whereas market expected for an expansion of 1.0%. Moreover, the nation's final Reuters/Michigan consumer sentiment index rose less-than-expected to a level of 97.0 in April, compared to a preliminary print of 98.0 and after registering a reading of 96.9 in the previous month.
In the Asian session, at GMT0300, the pair is trading at 1.0911, with the EUR trading slightly higher against the USD from yesterday's close.
The pair is expected to find support at 1.0888, and a fall through could take it to the next support level of 1.0864. The pair is expected to find its first resistance at 1.0929, and a rise through could take it to the next resistance level of 1.0946.
Going ahead, investors will look forward to the final Markit manufacturing PMI for April across the Euro-zone along with the Euro-zone's unemployment rate data for March, slated to release in a few hours.
The currency pair is showing convergence with its 20 Hr moving average and trading above its 50 Hr moving average

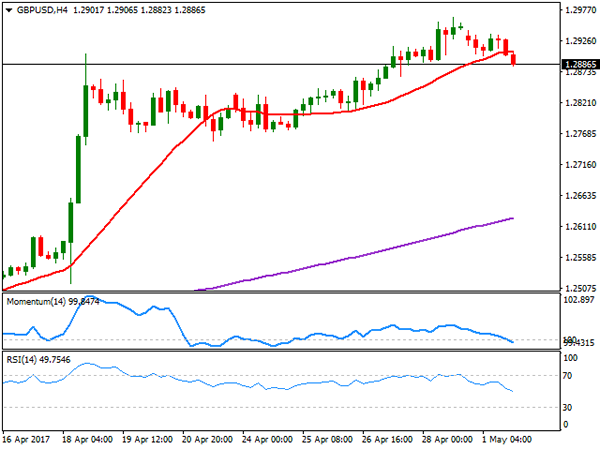
GBP/USD: UK’s Economic Growth Sharply Slowed In The First Quarter Of 2017
For the 24 hours to 23:00 GMT, the GBP declined 0.11% against the USD and closed at 1.2897.
On Friday, data indicated that UK's flash gross domestic product (GDP) climbed 0.3% QoQ in the first three months of 2017, expanding at its slowest pace in twelve months, as a spike in inflation continued to weigh on household incomes. The nation's GDP advanced 0.7% in the previous quarter, whereas markets anticipated for an advance of 0.4%. Meanwhile, the nation's BBA mortgage approvals fell to a level of 41.1K in March, compared to a revised level of 42.3K in the previous month.
In the Asian session, at GMT0300, the pair is trading at 1.2906, with the GBP trading 0.07% higher against the USD from yesterday's close.
The pair is expected to find support at 1.2877, and a fall through could take it to the next support level of 1.2847. The pair is expected to find its first resistance at 1.2936, and a rise through could take it to the next resistance level of 1.2965.
Trading trends in the pair today is expected to be determined by the release of Britain's Markit manufacturing PMI for April, slated to release in a few hours.
The currency pair is showing convergence with its 20 Hr moving average and trading below its 50 Hr moving average.

Members Agreed To Closely Monitor Japan’s Inflation: BoJ Minutes
For the 24 hours to 23:00 GMT, the USD rose 0.15% against the JPY and closed at 111.85.
In the Asian session, at GMT0300, the pair is trading at 111.84, with the USD trading slightly lower against the JPY from yesterday's close.
Earlier today, minutes of the Bank of Japan's (BoJ) March monetary policy meeting showed that policymakers agreed to keep a close watch on consumer prices. Further, they indicated that tighter labour conditions and rebounding energy prices are having a short-term effect on consumer prices.
On the data front, Japan's Nikkei services PMI fell to a level of 52.2 in April, compared to a reading of 52.9 in the prior month.
The pair is expected to find support at 111.50, and a fall through could take it to the next support level of 111.17. The pair is expected to find its first resistance at 112.07, and a rise through could take it to the next resistance level of 112.31.
The currency pair is showing convergence with its 20 Hr moving average and trading above its 50 Hr moving average.

Swiss Franc Reverses Its Gains, Ahead Of Switzerland’s SVME–PMI Data
For the 24 hours to 23:00 GMT, the USD declined 0.07% against the CHF and closed at 0.9955.
On Friday, data showed that Switzerland's KOF leading indicator unexpectedly dropped to a level of 106.0 in April, compared to market expectations of a rise to a level of 107.5. In the prior month, the index had registered a revised level of 107.2.
In the Asian session, at GMT0300, the pair is trading at 0.9956, with the USD trading a tad higher against the CHF from yesterday's close.
The pair is expected to find support at 0.9934, and a fall through could take it to the next support level of 0.9911. The pair is expected to find its first resistance at 0.9972, and a rise through could take it to the next resistance level of 0.9987.
Moving ahead, traders will focus on Switzerland's SVME–PMI for April, scheduled to release in a few hours.
The currency pair is trading above its 20 Hr and 50 Hr moving averages.

Canada’s Manufacturing Sector Activity Advanced In April
For the 24 hours to 23:00 GMT, the USD slightly rose against the CAD and closed at 1.3673.
In economic news, Canada's Markit manufacturing PMI rose to a level of 55.9 in April, compared to a level of 55.5 in the prior month.
On Friday, data revealed that Canada's gross domestic product (GDP) surprisingly remained flat on a monthly basis in February, defying market expectations for it to grow by 0.1% and following an advance of 0.6% in the prior month.
In the Asian session, at GMT0300, the pair is trading at 1.366, with the USD trading 0.1% lower against the CAD from yesterday's close.
The pair is expected to find support at 1.3636, and a fall through could take it to the next support level of 1.3612. The pair is expected to find its first resistance at 1.3685, and a rise through could take it to the next resistance level of 1.3710.
The currency pair is showing convergence with its 20 Hr and 50 Hr moving averages.

AUD/USD Daily Outlook
Daily Pivots: (S1) 0.7479; (P) 0.7509; (R1) 0.7555; More...
AUD/USD's rebound form 0.7439 extends higher today. But it's limited below 0.7609 resistance and intraday bias remains neutral. At this point, we're favoring the case that rise from 0.7158 has completed at 0.7748 already. And deeper decline is expected. Break of 0.7439 will turn bias to the downside and target a test on 0.7144/7158 support zone. At this point, there is no clear sign of larger down trend resumption yet. Hence we'll be cautious on strong support from0.7144/58 to contain downside and bring rebound. On the upside, break of 0.7609 will argue that the fall from 0.7748 has completed. In such case, bias will be turned back to the upside for 0.7748 resistance.
In the bigger picture, we're still treating price actions from 0.6826 low as a correction pattern. And, as long as 38.2% retracement of 0.9504 to 0.6826 at 0.7849 holds, long term down trend from 1.1079 is expected to resume sooner or later. Break of 0.6826 low will target 0.6008 key support level. However, firm break of 0.7849 will indicate that rise from 0.6826 is developing into a medium term rebound, rather than a sideway pattern. In such case, stronger rise should be seen to 55 month EMA (now at 0.8118) and above.
US Long Yield Talked Up By Mnuchin, AUD Higher after RBA
In US, long term treasury yields jumped after Treasury Secretary Steven Mnuchin said yesterday that ultra-long bonds are "something that could absolutely make sense for us at Treasury." 30 year yield rose 0.059 to close at 3.011, back above 3.000 handle and took out 55 day EMA. 10 year yield also rose 0.043 to close at 2.325, but was limited below last week's high and 55 day EMA. Mnuchin also said that it will probably take two years to hit 3% growth, with the help of tax and regulatory reforms, as well as better international trade agreements. He emphasized that USD 2% in revenue can be generally over 10 years if growth is boosted from 2% to 3%. Dollar is trading mixed after weaker than expected ISM manufacturing released overnight. NASDAQ extended the record run and rose 0.73% to close at 6091.6. S&P 500 also rose 0.17% but was limited below 2400 handle. DJIA lost -0.13%.
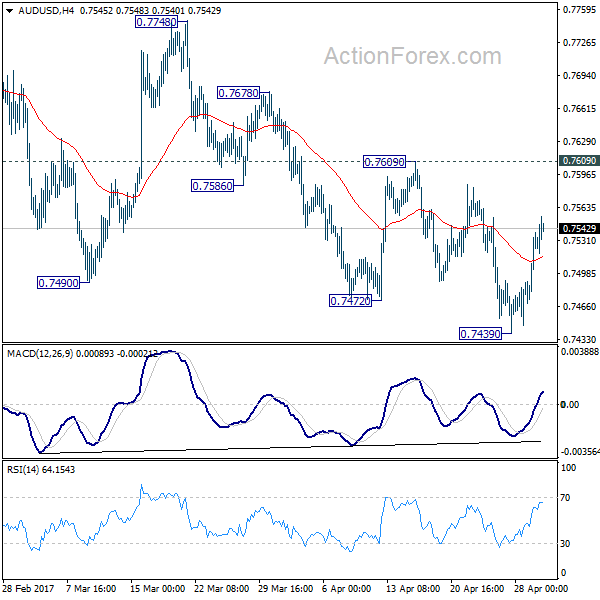
Aussie mildly higher after RBA stands pat
Aussie trades mildly higher after RBA left cash rate unchanged at 1.50% as widely expected. RBA noted in the statement that the "forecasts for the Australian economy are little changed." Growth is expected to accelerate over the new few years to 3%. But "indicators of the labour market remain mixed". Meanwhile, "outlook continues to be supported by the level of interest rates". The central bank also reiterated that appreciation in exchange rate would "complicate" the transition from mining boom. Underlying inflation is expected to pickup as the economy strengthens. RBA also remained concerned with the housing markets. And to conclude, RBA "judged that holding the stance of monetary policy unchanged at this meeting would be consistent with sustainable growth in the economy and achieving the inflation target over time."
BoJ minutes: Members agreed to closely monitor prices
BoJ released the minutes of March 15-16 meeting today. The minutes noted that board members generally agreed to closely monitor consumer prices due to the lack of upward momentum. Meanwhile, one policymaker noted that BoJ had to significantly raise government debt purchases to curb rising yield back in February. And that was seen as a weakness in the Yield Curve Control framework. Last week, BoJ kept monetary policies unchanged. The central bank raised growth forecast for the current fiscal year, but lowered inflation forecast. Also from Japan, monetary base rose 19.8% yoy in April.
China Caixin PMI manufacturing showed downward pressure emerged
China's Caixin/ Markit manufacturing PMI fell -0.9 point to 50.3, the lowest point since September, in April. The market had anticipated a modest rise to 51.4. As the accompanying statement suggested, "the sub-indexes of output and new business both fell to the weakest levels since September, while the employment index dropped to the lowest in three months". It added that "the downward pressure on manufacturing gradually emerged in April, with all indicators weakening. The Chinese economy may be starting to embrace a downward trend in the near term as prices of industrial products decline and active restocking comes to an end". Over the weekend, the government reported its official report, showing that manufacturing index had dropped -0.6 point to 51.2 in April. The non-manufacturing PMI declined -1.1 points to 54 for the month.
Looking ahead...
PMI data is the main focus today. Swiss will release SVME PMI. Eurozone will release PMI manufacturing final. UK will release PMI manufacturing. Eurozone will also release unemployment rate.
AUD/USD Daily Outlook
Daily Pivots: (S1) 0.7479; (P) 0.7509; (R1) 0.7555; More...
AUD/USD's rebound form 0.7439 extends higher today. But it's limited below 0.7609 resistance and intraday bias remains neutral. At this point, we're favoring the case that rise from 0.7158 has completed at 0.7748 already. And deeper decline is expected. Break of 0.7439 will turn bias to the downside and target a test on 0.7144/7158 support zone. At this point, there is no clear sign of larger down trend resumption yet. Hence we'll be cautious on strong support from0.7144/58 to contain downside and bring rebound. On the upside, break of 0.7609 will argue that the fall from 0.7748 has completed. In such case, bias will be turned back to the upside for 0.7748 resistance.
In the bigger picture, we're still treating price actions from 0.6826 low as a correction pattern. And, as long as 38.2% retracement of 0.9504 to 0.6826 at 0.7849 holds, long term down trend from 1.1079 is expected to resume sooner or later. Break of 0.6826 low will target 0.6008 key support level. However, firm break of 0.7849 will indicate that rise from 0.6826 is developing into a medium term rebound, rather than a sideway pattern. In such case, stronger rise should be seen to 55 month EMA (now at 0.8118) and above.
Economic Indicators Update
| GMT | Ccy | Events | Actual | Forecast | Previous | Revised |
|---|---|---|---|---|---|---|
| 23:50 | JPY | BOJ Minutes of March 15-16 Meeting | ||||
| 23:50 | JPY | Monetary Base Y/Y Apr | 19.80% | 21.20% | 20.30% | |
| 1:45 | CNY | Caixin Manufacturing PMI Apr | 50.3 | 51.4 | 51.2 | |
| 4:30 | AUD | RBA Rate Decision | 1.50% | 1.50% | 1.50% | |
| 7:30 | CHF | SVME PMI Apr | 58.2 | 58.6 | ||
| 7:45 | EUR | Italy Manufacturing PMI Apr | 55.9 | 55.7 | ||
| 7:50 | EUR | France Manufacturing PMI Apr F | 55.1 | 55.1 | ||
| 7:55 | EUR | Germany Manufacturing PMI Apr F | 58.2 | 58.2 | ||
| 8:00 | EUR | Eurozone Manufacturing PMI Apr F | 56.8 | 56.8 | ||
| 8:30 | GBP | PMI Manufacturing SA Apr | 54 | 54.2 | ||
| 9:00 | EUR | Eurozone Unemployment Rate Mar | 9.40% | 9.50% |
(RBA) Statement by Philip Lowe, Governor: Monetary Policy Decision
At its meeting today, the Board decided to leave the cash rate unchanged at 1.50 per cent.
There has been a broad-based pick-up in the global economy since last year. Labour markets have tightened further in many countries and forecasts for global growth have been revised up. Above-trend growth is expected in a number of advanced economies, although uncertainties remain. In China, growth is being supported by increased spending on infrastructure and property construction, with the high level of debt continuing to present a medium-term risk. The improvement in the global economy has contributed to higher commodity prices, which are providing a significant boost to Australia's national income. Australia's terms of trade have increased, although some reversal of this is occurring.
Headline inflation rates have moved higher in most countries, partly reflecting the higher commodity prices. Core inflation remains low. Long-term bond yields are higher than last year, although in a historical context they remain low. Interest rates have increased in the United States and there is no longer an expectation of additional monetary easing in other major economies. Financial markets have been functioning effectively.
The Bank's forecasts for the Australian economy are little changed. Growth is expected to increase gradually over the next couple of years to a little above 3 per cent. The economy is continuing its transition following the end of the mining investment boom, with the drag from the decline in mining investment coming to an end and exports of resources picking up. Growth in consumption is expected to remain moderate and broadly in line with incomes. Non-mining investment remains low as a share of GDP and a stronger pick-up would be welcome.
Indicators of the labour market remain mixed. The unemployment rate has moved a little higher over recent months, but employment growth has been a little stronger. The various forward-looking indicators still point to continued growth in employment over the period ahead. The unemployment rate is expected to decline gradually over time. Wage growth remains slow and this is likely to remain the case for a while yet.
The outlook continues to be supported by the low level of interest rates. Lenders have announced increases in mortgage rates, particularly those paid by investors and on interest-only loans. The depreciation of the exchange rate since 2013 has also assisted the economy in its transition following the mining investment boom. An appreciating exchange rate would complicate this adjustment.
Inflation picked up to above 2 per cent in the March quarter in line with the Bank's expectations. In underlying terms, inflation is running at around 1¾ per cent, a little higher than last year. A gradual further increase in underlying inflation is expected as the economy strengthens.
Conditions in the housing market continue to vary considerably around the country. Prices have been rising briskly in some markets and declining in others. In the eastern capital cities, a considerable additional supply of apartments is scheduled to come on stream over the next couple of years. Rent increases are the slowest for two decades. Growth in housing debt has outpaced the slow growth in household incomes. The recently announced supervisory measures should help address the risks associated with high and rising levels of indebtedness.
Taking account of the available information, the Board judged that holding the stance of monetary policy unchanged at this meeting would be consistent with sustainable growth in the economy and achieving the inflation target over time.
Foreign Exchange Market Commentary: EUR/USD, USD/JPY, GBP/USD, GOLD, WTI CRUDE, DJIA, FTSE100, DAX
EUR/USD
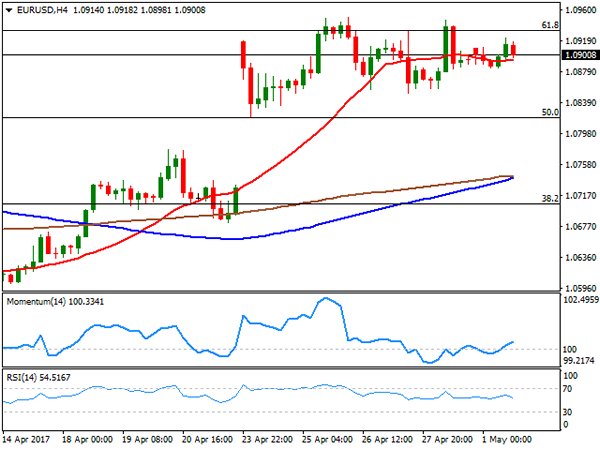
The EUR/USD pair closed the day flat around 1.0900 in a choppy start to the week. Trading was limited as European markets were closed due to Labor Day, with low volumes extending all through the day. Macroeconomic developments didn't look good for the greenback, as according to official releases, personal income rose by 0.2% in March, missing expectations of 0.3%, while personal spending remained flat, against market's forecast of a 0.2% advance. The same report also showed that inflation slowed, as core PCE price index fell by 0.2% when compared to February, while the year-on-year reading surged by 1.8%, below previous 2.1%. Also, the final Markit manufacturing PMI for April was confirmed at 52.8, while the ISM manufacturing PMI came in at 54.8, below March's 57.2. Despite data were still compatible with growth, the US economic activity seems to have peaked late 2016, with growth decelerating. Also, US Treasury Secretary Steve Mnuchin said that it could take up to two years to have economic growth reach 3%, pouring some further cold water over hopes of a hawkish Fed this week.
From a technical point of view, the pair has made little progress, still stuck around 1.0900 and confined within the 1.0820/1.0950 range set last week. The bullish potential, however, remains firm in the background, although cautious trading will likely persists. The pair enters the Asian session with the 4 hours chart showing that the price keeps hovering around a horizontal 20 SMA, whilst technical indicators diverge from each other, but both stand around their mid-lines, maintaining the short term perspective neutral. The pair needs to accelerate beyond 1.0950 to be able to extend its rally pass 1.1000, with further soft US data exacerbating demand for the common currency.
Support levels: 1.0855 1.0820 1.0785
Resistance levels: 1.0950 1.1000 1.1045
USD/JPY
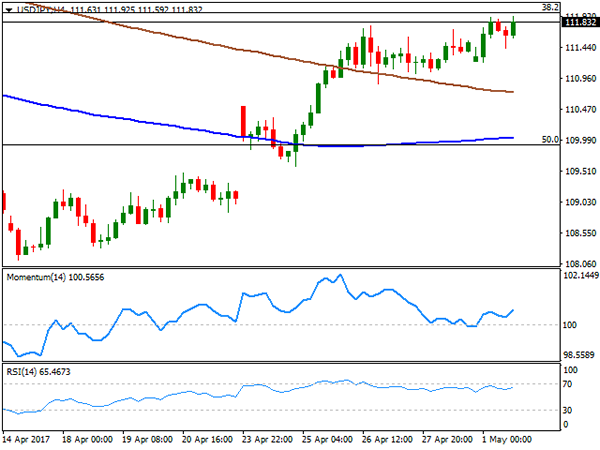
The USD/JPY pair advanced to a fresh 1-month high of 111.92, and closed the day not far below it, as despite US data released this Monday missed expectations, US stocks edged higher alongside with US Treasury yields. The 10-year note yield surged to 2.33% from previous 2.28%, while the 30-year note benchmark peaked at 3.01% after closing last week at 2.95%. The Bank of Japan will release the minutes of its latest meeting during the upcoming Asian session, with Governor Kuroda expected to offer a speech alongside. Despite surpassing April high by a handful of pips, the pair remains contained by a major resistance at 112.00, the 38.2% retracement of the November/December rally. The 4 hours chart shows that the price advanced further above its 100 and 200 SMAs, with the shortest slowly turning higher, but well below the largest one, and technical indicators heading higher within positive territory, supporting additional advances on a break above the mentioned Fibonacci resistance, as the movement will likely trigger some short stops, favoring an advance up to the 112.90 region.
Support levels: 111.60 111.20 110.95
Resistance levels: 112.00 112.45 112.90
GBP/USD
The GBP/USD pair closed the day marginally lower, breaking below 1.2900 with US closing bell and settling around 1.2880. There was no particular reason behind Cable's slide, but it could be attributed to further profit taking after the pair neared the critical 1.3000 threshold. Pound's upcoming direction will likely be linked to the different UK PMIs to be release later this week, starting on Tuesday with the Markit Manufacturing one, as macroeconomic data has been easing from its post-Brexit peaks, putting back on tap the possibility of economic slowdown. From a technical point of view, the pair is gaining downward potential short term, given that in the 4 hours chart, the price retreated towards a bullish 20 SMA, whilst technical indicators head north within positive territory, suggesting a bearish corrective move rather than confirming an interim top. The pair is now poised to correct lower, buy bulls will likely take their chances on dips towards 1.2830. A decline down to 1.2750/70 will be seen as corrective, as only below this last the movement will become more sustainable, with investors then eyeing 1.2500. Still and with the ongoing dollar's weakness, chances of such decline are well limited for this week, unless UK data disappoint big and the US Fed surprises with an extremely hawkish stance.
Support levels: 1.2830 1.2795 1.2745
Resistance levels: 1.2910 1.2965 1.3000
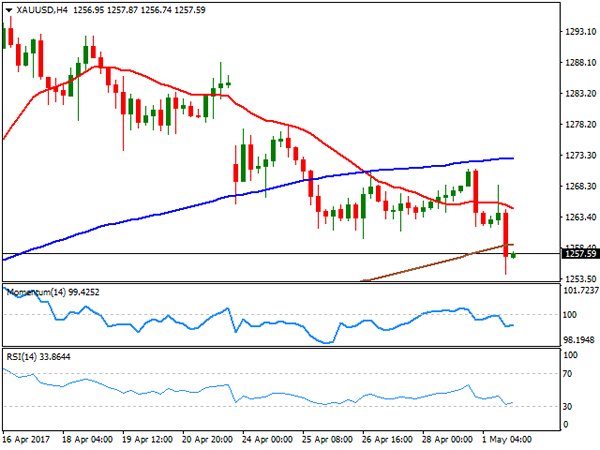
GOLD
The GBP/USD pair closed the day marginally lower, breaking below 1.2900 with US closing bell and settling around 1.2880. There was no particular reason behind Cable's slide, but it could be attributed to further profit taking after the pair neared the critical 1.3000 threshold. Pound's upcoming direction will likely be linked to the different UK PMIs to be release later this week, starting on Tuesday with the Markit Manufacturing one, as macroeconomic data has been easing from its post-Brexit peaks, putting back on tap the possibility of economic slowdown. From a technical point of view, the pair is gaining downward potential short term, given that in the 4 hours chart, the price retreated towards a bullish 20 SMA, whilst technical indicators head north within positive territory, suggesting a bearish corrective move rather than confirming an interim top. The pair is now poised to correct lower, buy bulls will likely take their chances on dips towards 1.2830. A decline down to 1.2750/70 will be seen as corrective, as only below this last the movement will become more sustainable, with investors then eyeing 1.2500. Still and with the ongoing dollar's weakness, chances of such decline are well limited for this week, unless UK data disappoint big and the US Fed surprises with an extremely hawkish stance.
Support levels: 1.2830 1.2795 1.2745
Resistance levels: 1.2910 1.2965 1.3000
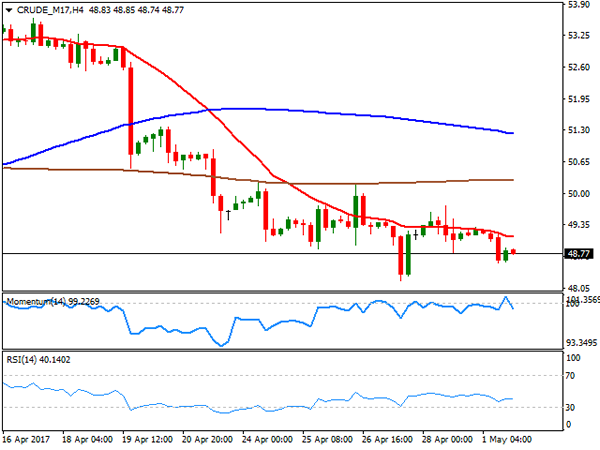
WTI CRUDE OIL
Crude oil prices slipped within range at the beginning of the week, with West Texas Intermediate crude futures settling around $48.80 a barrel. Poor Chinese PMI figures, indicating the possibility of diminishing demand for the commodity, added to concerns triggered by rising US production. WTI closed at its lowest in over a month, and is poised to extend its decline according to technical readings, given that in the daily chart, it held below all of its moving averages, whilst technical indicators have turned lower after a period of consolidation near oversold levels. In the shorter term, and according to the 4 hours chart, the risk is also towards the downside, with a bearish 20 SMA containing advances, the Momentum indicator hovering within neutral territory and the RSI regaining its downward strength around 39. Last week low of 48.20 is a critical support, with a break below it favoring a downward extension towards the 45.00 region.
Support levels: 48.20 47.70 47.10
Resistance levels: 49.00 49.60 50.20
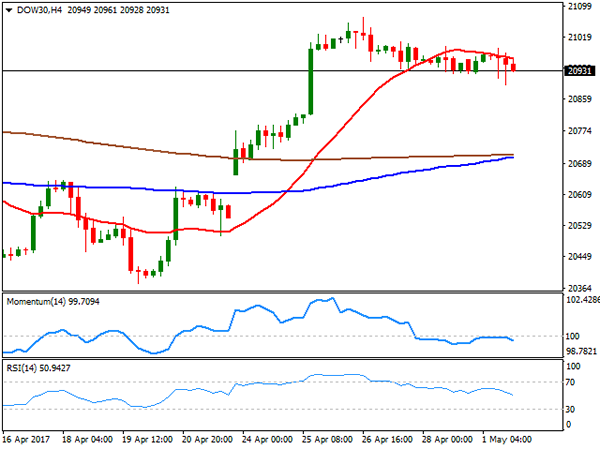
DJIA
Having traded within positive territory for most of the day, US equities closed the day mixed, with the Dow Jones Industrial Average down 26 points to 20,914.42 and the S&P up 0.17% to settle at 2,388.33. The Nasdaq Composite jumped 44 points to 6,091.60, led by an advance in Twitter that soared 6% on live news streaming deal with Bloomberg. Among the Dow, technology-related equities were the best performers, with Apple up 2.26%, followed by Microsoft which added 1.37%. Boeing was the worst performer, shedding 1.21%. The daily chart for the index indicates that the index remains towards the upside, as it held above a modestly bullish 20 DMA, whilst technical indicators turned back north near overbought readings. In the 4 hours chart, however, the upside remains limited by a bearish 20 SMA, whilst the Momentum indicator turned south after failing to overcome its mid-line and the RSI heads lower around 52. The intraday high was settle at 20,989, the level to surpass to see it regaining some bullish traction this Tuesday.
Support levels: 20,913 20,869 20,819
Resistance levels: 20,989 21,035 21,071
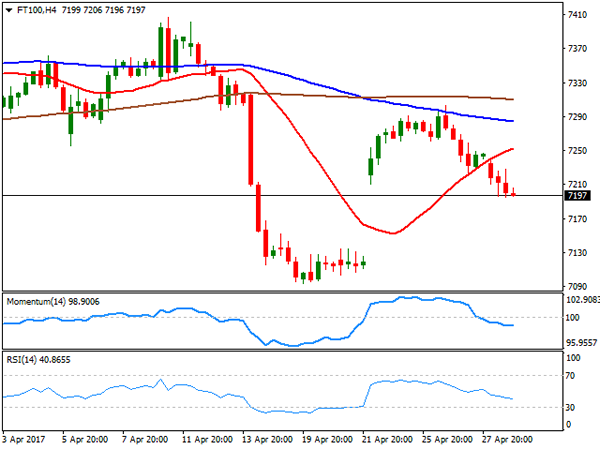
FTSE100
London market was closed this Monday due to Labor day, with the FTSE 100 latest registered close at 7,203.94. The ongoing Pound's weakness could favor a recovery in the benchmark this Tuesday, although it will also depend on how Asian markets develop after the slow start to the week. Technically, the daily chart shows that the index settled below its 100 DMA with the 20 DMA gaining downward strength above the latest and containing advances. Technical indicators in the mentioned chart faltered around their mid-lines mid-week, turning south afterwards and maintaining their bearish momentum. In the 4 hours chart, the index closed the week below all of its moving averages, whilst technical indicators head lower within negative territory, supporting additional declines for the upcoming days.
Support levels: 7,173 7,126 7,081
Resistance levels: 7,228 7,259 7,303
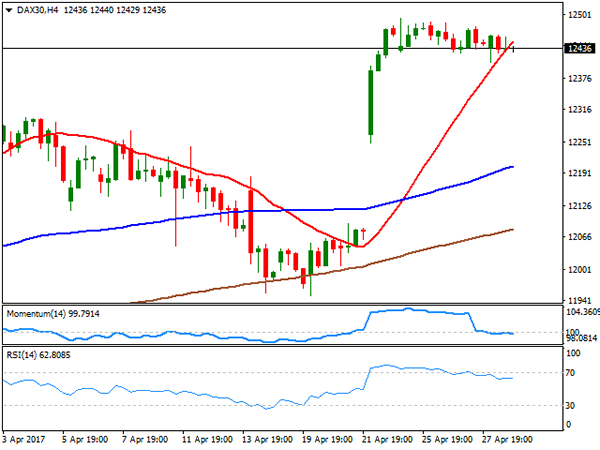
DAX
European markets were also closed on holidays at the beginning of the week amid a holiday, with the German's DAX latest registered close at 12,436. Risk aversion continued easing at the beginning of the week, which suggest that further gains could be expected, despite the downward correction seen at the end of past week. Technically, the daily chart shows that the benchmark has been within a consolidative phase for most of the last few days, but also that the risk remains towards the upside as it holds well above healthy bullish moving averages, whilst indicators hold within positive territory. In the 4 hours chart, the technical outlook is neutral-to-bullish, as the index holds around a sharply bullish 20 SMA, the Momentum turned flat around its 100 level, while the RSI heads nowhere around 62.
Support levels: 12,405 12,366 12,312
Resistance levels: 12,458 12,495 12,530
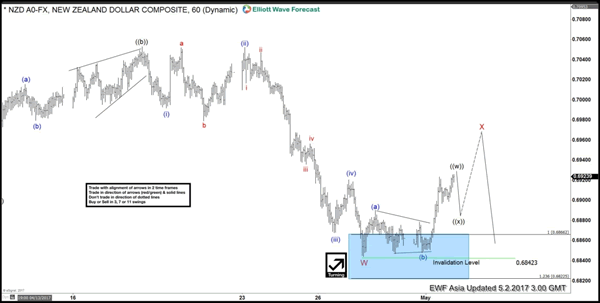
Elliott Wave View: NZDUSD More Downside
Short term Elliott Wave view in NZDUSD suggests the decline to 0.6844 low ended cycle from 3/21 high in Minor wave W. Pair is currently correcting cycle from 3/21 high in 3, 7, or 11 swing in Minor wave X before the decline resumes. The rally from 4/27 low (0.6844) looks to be unfolding as a double three Elliott Wave structure where Minute wave ((w)) is expected to complete soon as a Flat Elliott wave structure , then pair should pullback in Minute wave ((x)) to correct cycle from 4/27 low before turning higher again. We don’t like buying the proposed bounce and expect Minor wave X rally to find sellers in 3, 7 or 11 swing as far as pivot at 0.709 high remains intact.
NZDUSD 1 hour Elliott Wave Chart