
Sample Category Title
RBA Stands Pat, Appears Slightly More Upbeat
The RBA remained on hold today, as was widely anticipated. The statement accompanying the decision was neutral overall, and very similar to the previous one. The most noteworthy change related to the Bank's view of the labor market. Policymakers acknowledged the latest recovery in jobs, indicating that labor indicators 'remain mixed', which is an upgrade from the previous statement that they had 'softened recently'. Perhaps due to this slightly more upbeat language, AUD gained somewhat after the decision.
However, we think that the short-term outlook of the Aussie remains cautiously negative. We would like to see consistent improvement in the nation's economic data before we assume any change in the currency's outlook.
AUD/USD had been drifting higher ahead of the meeting and got another boost on the announcement. Nevertheless, the advance was stopped by the downside resistance line taken from the peak of the 30th of March. This is in line with our view that the short-term outlook remains somewhat negative and that we would treat any rebound on the RBA as a corrective move. We believe that the bears may take advantage of the rate's proximity to the aforementioned downside line and perhaps push the pair down for another test near 0.7520 (S1). A dip below that barrier could confirm that the correction is over and that we are back in the direction of the prevailing downtrend. Such a dip may initially aim for our next support of 0.7490 (S2).
We continue to expect the RBA to remain on hold in the foreseeable future, absent any shock. Having said that, we think that the risks surrounding the Bank's language are likely asymmetrical. We believe that in case of a deterioration in the data then the RBA will probably shift back to a dovish stance, but in case of progress the Bank is unlikely to sound hawkish, on concerns it may trigger a speculative rally in AUD.
Today is a PMI day:
During the European day, the most noteworthy economic indicator we get will probably be the UK manufacturing PMI for April. The forecast is for the index to have declined somewhat. Coming on top of the slowdown in GDP for Q1, a decline in the manufacturing index could generate speculation that this softness in economic activity may have rolled over into Q2, and may thereby reverse some of the pound's recent gains. Having said that, we think that the currency's near-term direction will be primarily decided by opinion polls and developments regarding the upcoming election, instead of economic data, at least until the political landscape clears out somewhat.
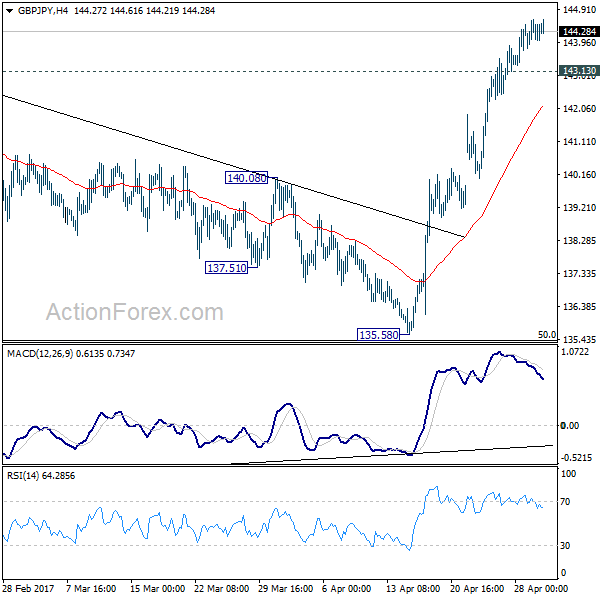
GBP/JPY has been trading in a steep uptrend since the 17th of April. Nevertheless, the rate now consolidates slightly below the key resistance zone of 144.75 (R1), defined by the peak of the 27th of January. Given that the uptrend looks very steep and that there is negative divergence between our short-term momentum indicators and the price action, we see the likelihood for a corrective setback before the bulls decide to take action again. A dip below 144.00 (S1) on a potential decline in the PMI today may confirm that and could open the way for an initial test near 143.30 (S2).
We also get manufacturing PMIs for April from both Sweden and Norway.
What's more, we will get the final manufacturing indices for the month from several European countries and the Eurozone as a whole, but the final figures are usually not major market movers. The bloc's unemployment rate for March is also due out and the forecast is for a decline. Even though this is usually not a major market mover either, it could be another piece of data entering the basket of those supporting a more optimistic stance by the ECB at one of the upcoming meetings.
AUD/USD
Support: 0.7520 (S1), 0.7490 (S2), 0.7475 (S3)
Resistance: 0.7560 (R1), 0.7585 (R2), 0.7600 (R3)
GBP/JPY
Support: 144.00 (S1), 143.30 (S2), 142.40 (S3)
Resistance: 144.75 (R1), 145.40 (R2), 146.25 (R3)
Trade Idea : EUR/USD – Stand aside
EUR/USD - 1.0913
Most recent candlesticks pattern : N/A
Trend : Near term up
Tenkan-Sen level : 1.0915
Kijun-Sen level : 1.0905
Ichimoku cloud top : 1.0901
Ichimoku cloud bottom : 1.0900
New strategy :
Stand aside
Position : -
Target : -
Stop : -
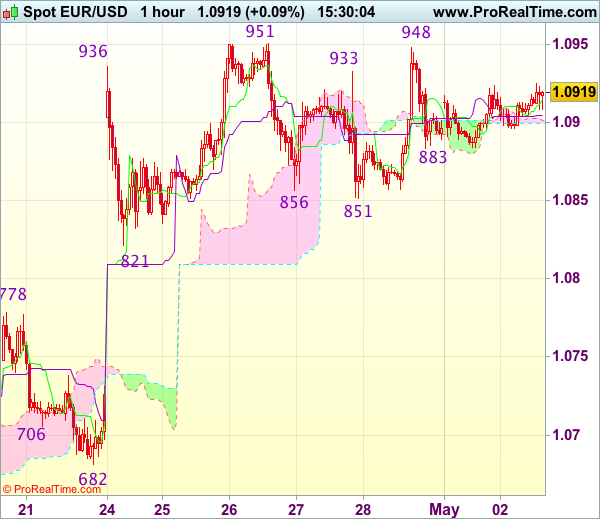
Although the single currency rose to as high as 1.0948 late last week, the subsequent retreat after faltering below last week’s high at 1.0951 has retained our view that further consolidation below this level would be seen and test of support at 1.0883 cannot be ruled out, however, reckon downside would be limited to support at 1.0851 and price should stay above 1.0821 support, bring another rise later.
On the upside, above said resistance at 1.0948-51 would revive bullishness and signal recent upmove from 1.0340 low has resumed for headway to 1.0975-80 and possibly towards 1.1000 which is likely to hold on first testing due to loss of momentum. As near term outlook is still mixed, would be prudent to stand aside in the meantime.
GBP/JPY Daily Outlook
Daily Pivots: (S1) 143.71; (P) 144.17; (R1) 144.54; More....
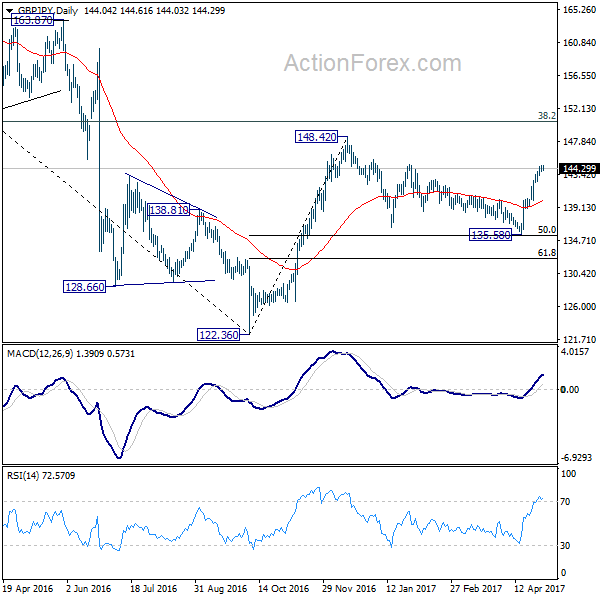
GBP/JPY continues to lose upside momentum but there is still no clear sign of topping yet. Intraday bias remains on the upside for 144.77 resistance. As noted before, consolidation pattern from 148.42 has completed at 135.58, ahead of 135.39 medium term fibonacci level. Break of 144.77 will resume the whole rebound from 122.36 through 148.42 resistance. On the downside, break of 143.13 minor support will turn bias neutral and bring consolidation before staging another rally.
In the bigger picture, based on current momentum, rise from 122.36 bottom should be developing into a medium term move. Break of 38.2% retracement of 195.86 to 122.36 at 150.42 should pave the way to 61.8% retracement at 167.78. This will now be the favored case as long as 135.58 support holds.
Trade Idea : USD/JPY – Buy at 111.55
USD/JPY - 112.11
Most recent candlesticks pattern : N/A
Trend : Near term up
Tenkan-Sen level : 111.99
Kijun-Sen level : 111.81
Ichimoku cloud top : 111.45
Ichimoku cloud bottom : 111.40
Original strategy :
Buy at 110.45, Target: 111.55, Stop: 110.10
Position : -
Target : -
Stop : -
New strategy :
Buy at 111.55, Target: 112.55, Stop: 111.20
Position : -
Target : -
Stop : -
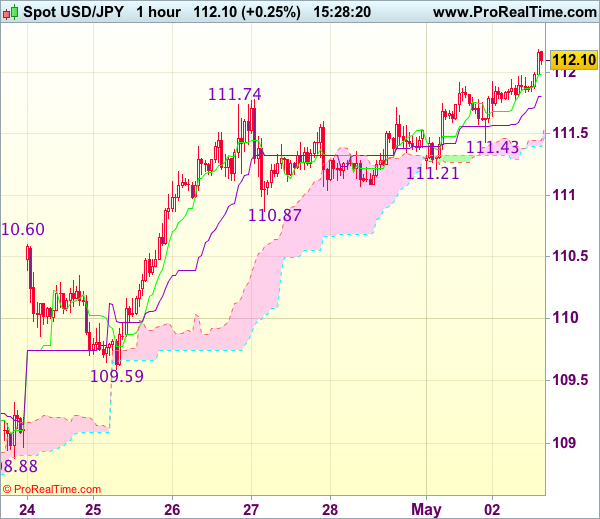
As the greenback has surged again after brief pullback and broke above previous resistance at 111.74, adding credence to our view that recent upmove is still in progress and bullishness remains for test of previous resistance at 112.20, break there would encourage for headway to 112.50-60 but near term overbought condition should limit upside to 112.80 and price should falter below 113.00-10, risk from there has increased for a retreat to take place later.
In view of this, would not chase this rise here and would be prudent to buy dollar on subsequent pullback as 111.50-55 should limit downside. Below support at 111.21 (yesterday’s low) would abort and suggest a temporary top is formed instead, bring correction towards 110.87 support.
EUR/JPY Daily Outlook
Daily Pivots: (S1) 121.44; (P) 121.76; (R1) 122.23; More...
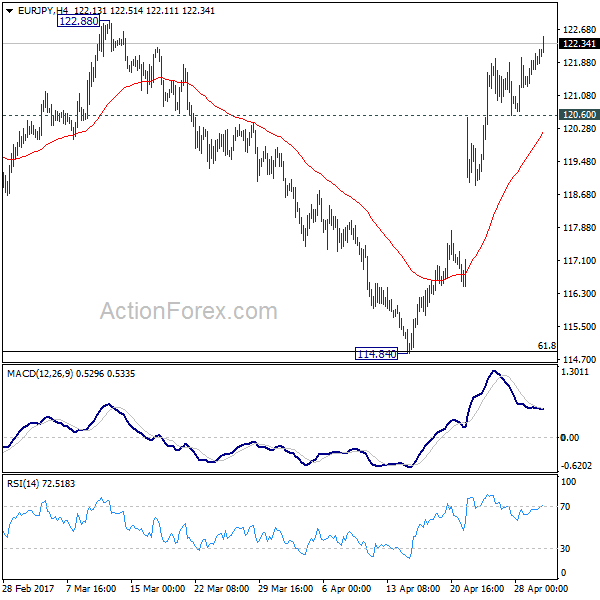
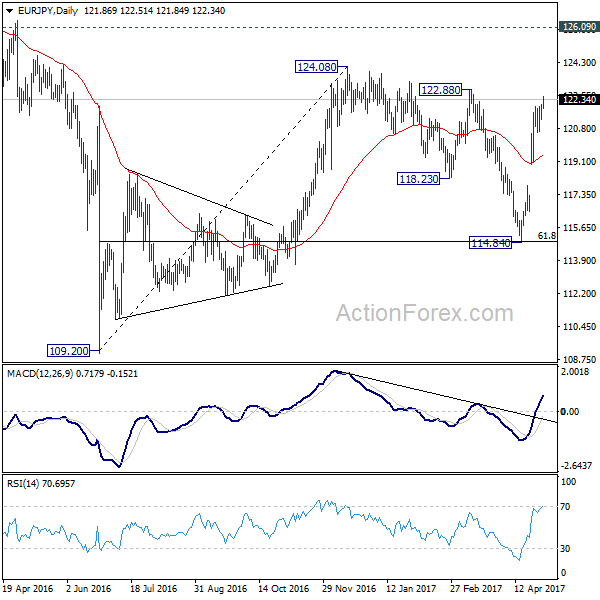
EUR/JPY's rally extends to as high as 122.51 so far and intraday bias stays on the upside for 122.88 resistance. As noted before, the correction from 124.08 should have completed with three waves down to 114.84 already. Break of 122.88 resistance will extend larger rise from 109.20 through 124.08 high. On the downside, below 120.60 minor support will turn bias neutral and bring consolidation before staging another rise.
In the bigger picture, focus is back on 126.09 support turned resistance. Decisive break there will confirm completion of the down trend from 149.76. And in such case, rise from 109.20 is at the same degree and should target 141.04 resistance and above. Meanwhile, rejection from 126.09 and break of 114.84 will extend the fall from 149.76 through 109.20 low.
Commodities Say Silence Is Golden In Pre-Holiday Trade
Asia consolidates in quiet trading as the region prepares for the start of Japan's Golden Week holidays starting tomorrow.
CRUDE OIL
Crude fell by over one percent overnight in holiday-thinned markets. The Baker Hughes Rig Count increased Friday evening again, and Libya announced overnight that oil production has increased to over 750,000 barrels a day. Libya is exempt from OPEC's production cuts.
That leaves OPEC/NOPEC caught in a pincer movement from both Libya and U.S. Shale, with the increase in production from both potentially offsetting almost all of the production cuts. With OPEC/NOPEC's production cut deal due for renewal (or not) at the end of May, the need to roll it over is increasing by the day as officials from both sides nervously look over their shoulders and into their national accounts. The market isn't waiting though and has started voting with their feet, with Friday's rally looking very much like a dead cat bounce.
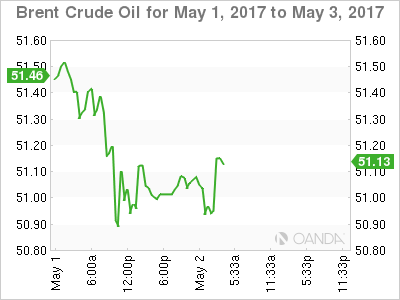
Brent
Brent spot is flirting with its 200-day moving average at 50.90 with further support at 50.50 and 49.50. Resistance lies at 52.00 and 52.50.
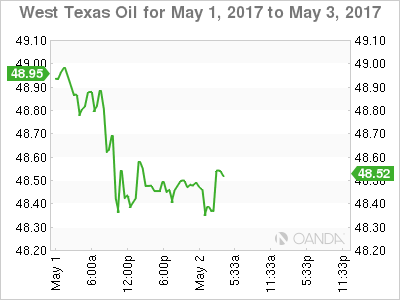
WTI
WTI spot closed below its 200-day moving average at 48.75 in a bearish technical development. It has further resistance at 49.00 and then 49.80. Support appears at 47.90 with 46.50 the last line in the sand.
PRECIOUS METALS
Gold
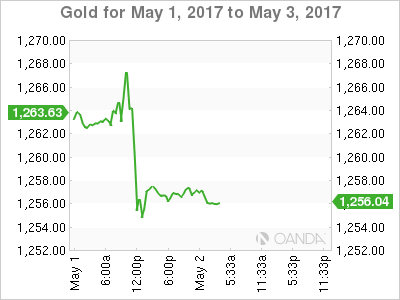
After multiple failures over the past week at the 1271 region, gold finally cracked overnight, breaking through 1260, the lower end of its range to open at 1257 in Asia this morning. The 1% fall implies that the safe haven bid that has underpinned gold in recent times is rapidly eroding as the world becomes a quieter place. The news that the U.S. Government has avoided a budget driven shutdown this week has also weighed on the yellow metal.
Gold is just shy of important daily support today in the shape of its 200-day moving average at 1253. A daily close below here would be a bearish technical development. Behind this the next key level is the 1240 area with a break here indicating a much larger correction could be on the cards.
Resistance sits intraday at 1260 before the previously mentioned 1271 area and then 1280.
Silver
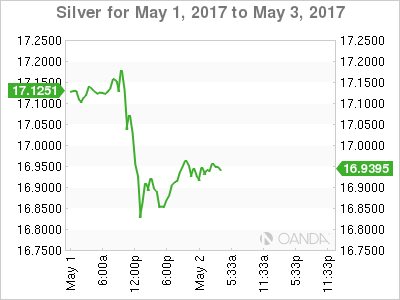
Silver has rallied 15 cents in thin liquidity but remains perched just above support at 16.8000, a break of which could signal a move to 16.6000 below which implies a possible sub 16.0000 correction.
Resistance remains at yesterdays highs of 17.2700 followed by the 100- day moving average at 13.3850. Overall silver continues to lead gold lower with its technical picture implying little relief for bullish traders yet.
Technical Outlook: EURUSD Eyes EU PMI Data And FOMC For Direction Signal
The Euro stays directionless and holding within 1.0850/1.0950 range for more than one week. Several upside attempts were capped at 1.0950 which now acts as strong resistance.
Near-term action was supported by 200SMA, with freshly formed 10/200SMA Golden Cross, underpinning overall bullish structure.
Daily studies are giving mixed signals, as MA's and Momentum studies are in firm bullish setup, while slow stochastic continues to move lower after reversing from overbought territory.
The pair is looking for stronger signal to establish in fresh direction on break of either side of the range. Firm break above 1.0950 pivot is expected to trigger fresh acceleration towards 1.1000+ zone, while loss of lower pivots at 1.0850/00 zone would generate bearish signal. Today's Manufacturing PMI data from the Eurozone and tomorrow's release of FOMC policy meeting are closely watched for stronger signals.
Res: 1.0950, 1.1000, 1.1033, 1.1067
Sup: 1.0893, 1.0850, 1.0833, 1.0804
EUR/CHF Daily Outlook
Daily Pivots: (S1) 1.0837; (P) 1.0849; (R1) 1.0871; More...
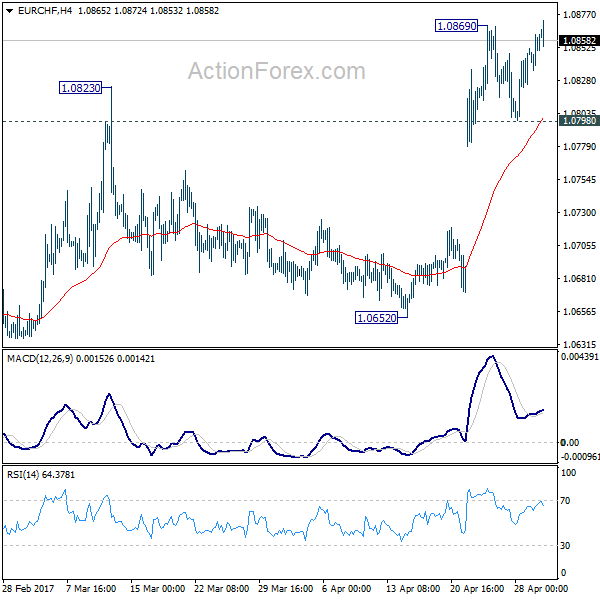
Break of 1.0869 temporary top suggests resumption of recent rebound from 1.0629. Intraday bias is back on the upside for 1.0897 resistance first. t. Decisive break there should confirm our bullish view of reversal and will target 1.0999 resistance next. On the downside, break of 1.0798 support will is needed to indicate short term topping. Otherwise, outlook will remain cautiously bullish in cas of retreat.
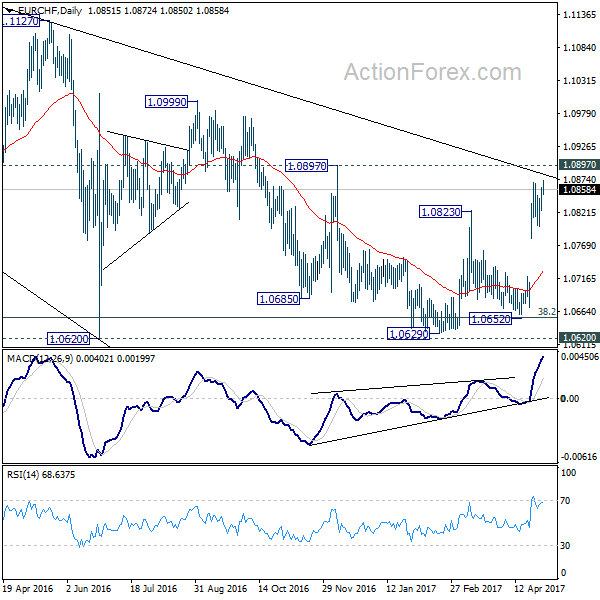
In the bigger picture, the price actions from 1.1198 are seen as a corrective move. Current strong rebound is raising the chance that it's completed after defending 38.2% retracement of 0.9771 to 1.1198 at 1.0653. Decisive break of 1.0999 resistance will target a test on 1.1198 high. For now, this will be the preferred case as long as 1.0652 support holds.
Daily Technical Analysis: EURUSD, GBPUSD, USDJPY, USDCHF
EURUSD
The EURUSD was indecisive yesterday. There are no changes in my technical outlook. The bias remains neutral in nearest term. Price has been moving inside a 100 pip range of 1.0950 – 1.0850 since last week. We need a clear break from that range area to see clearer direction. A clear break and daily close above 1.0950 would continue the recent bullish bias testing 1.1000 – 1.1050 area. On the downside, a clear break and daily close back below 1.0850 would expose the pre-gap level at 1.0730. There is no high impact fundamental release today so it is likely that price will remain inside the range area. Overall I remain neutral.
GBPUSD
The GBPUSD was corrected lower yesterday bottomed at 1.2882. The bias is neutral in nearest term but as long as stay above 1.2780/50 I still prefer a bullish scenario at this phase with nearest target seen around 1.3050 area. Immediate support is seen around 1.2860. A clear break below that area could trigger further bearish pressure testing 1.2800 but only a clear break below 1.2780/50 would interrupt the double bottom bullish scenario
USDJPY
The USDJPY continued its bullish momentum yesterday topped at 111.92 and hit 111.97 earlier today in Asian session. The bias remains bullish in nearest term testing 112.20 area. Immediate support is seen around 111.45. A clear break below that area could lead price to neutral zone in nearest term testing 110.85 but overall price is still in a bullish phase and any downside pullback should be seen as a good opportunity to buy. On the upside, a clear break and daily close above 112.20 would expose 112.85 – 113.50 region.
USDCHF
The USDCHF had a moderate bullish momentum yesterday. The bias remains neutral in nearest term but overall I still prefer a bearish scenario at this phase with key resistance seen around 1.0020 and the trend line resistance as you can see on my H4 chart below targeting 0.9880 and 0.9813. Overall I remain neutral.
Markets Mixed Despite VIX Hitting A Decade Low
After returning from a long weekend, equity investors seem undecided on whether to be bullish or bearish. Stocks across Asian markets were mixed on Tuesday despite the CBOE Volatility Index hitting its lowest levels in a decade.However,the low volatility was reflected in currency markets with the Euro, Pound, and the Yen stuck in tight trading against the U.S. dollar.
The Reserve Bank of Australia kept interest rates steady at 1.5% as widely anticipated, but the positive tone on the labor market outlook pushed the Aussie 0.2% higher against the dollar. Australia'scentral bank now expects unemployment to decline gradually over time, and inflation to increase as the economy continues to strengthen. The biggest concern going forward is likely to remain the overheated housing market despite price growth slowing slightly in April. For traders who like high yielding currencies, it will be critical to monitor the differentials in government bond yields. Spreads between U.S. and Australian 10-year bond yields are currently below 30 basis points, and without sufficient premium, it will be hard for AUDUSD to resume its rally. It will require somewhere around 50-60 basis points premium for AUDUSD to break above 2017 highs.
The Fed is next as it kicks off its two-day monetary policy meeting today with an announcement due on Wednesday. While no one expects any changes to policy, the 500-word statement will probably provide some direction to the US Dollar. Economic data releasedhas not been encouraging lately. Friday's GDP didn't reflect the upbeat PMI reports with the economy growing 0.7% in the first three months of 2017. Consumers pulled back on spending, and U.S. employers added far fewer jobs than expected in March.
Will the Fed acknowledge a slowdown in growth and thus send rate hike expectations lower for 2017? Or are these factors only a temporary drag affected by the Easter bank holiday weekend and a delay in tax refunds, which is likely to be reversed in Q2? The Fed's statement should be answering these questions, and based on that, traders will act.
In Europe, investors will take cues from the final PMI numbers from Spain, Italy, France and Germany.