Sample Category Title
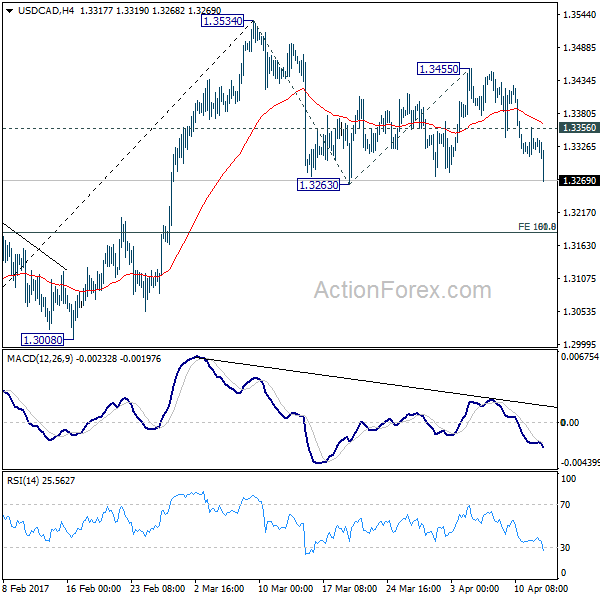
USD/CAD Mid-Day Outlook
Daily Pivots: (S1) 1.3305; (P) 1.3331; (R1) 1.3353; More....
USD/CAD's fall accelerates in early US session and reaches as low as 1.3270 so far. Intraday bias remains on the downside for 1.3263 support. Break there will confirm resumption of whole decline from 1.3534 and target 1.3184 cluster level. (61.8% retracement of 1.2968 to 1.3534 at 1.3184, 100% projection of 1.3534 to 1.3263 from 1.3455 at 1.3814 too). As such decline is seen as a correction, we'd expect strong support from 1.3184 to contain downside and bring rebound. On the upside, above 1.3356 minor resistance will turn intraday bias neutral first. But for now, deeper decline is expected as long as 1.3455 resistance holds.
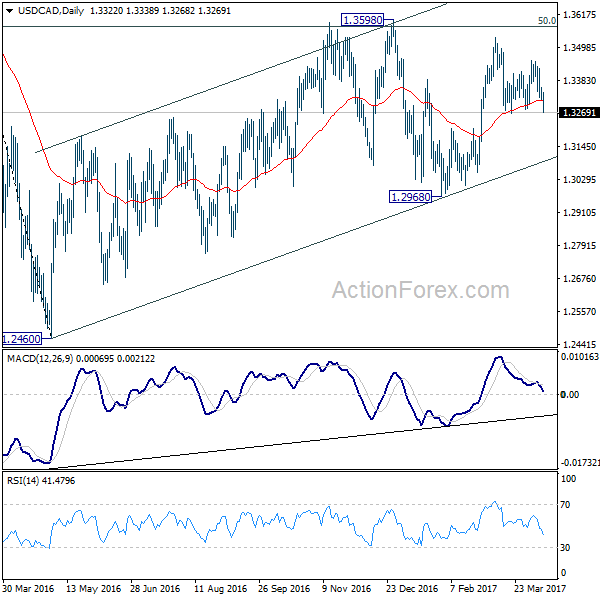
In the bigger picture, price actions from 1.4689 medium term top are seen as a correction pattern. The first leg has completed at 1.2460. The second leg from 1.2460 is likely still in progress and could target 61.8% retracement of 1.4689 to 1.2460 at 1.3838. We'd look for reversal signal there to start the third leg. However, break of 1.2968 will argue that the third leg has already started and should at least bring a retest of 1.2460 low. Meanwhile, sustained trading above 1.3838 would pave the way to retest 1.4689 high.
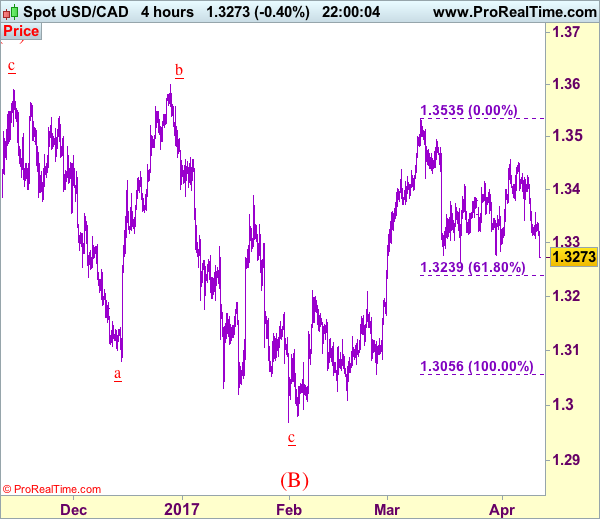
Trade Idea: USD/CAD – Stand aside
USD/CAD - 1.3288
Recent wave: Only wave v of c has ended at 0.9407 and wave C of major A-B-C correction is underway for headway to 1.4700
Trend: Near term up
New strategy :
Stand aside
Position: -
Target: -
Stop:-
Although the greenback has fallen again today and test of previous support at 1.3264 is likely, loss of near term downward momentum should prevent sharp fall how 1.3235-40 (61.8% Fibonacci retracement of 1.3056-1.3535) and reckon 1.3200 would hold on first testing, risk from there has increased for a rebound to take place soon.
In view of this, would not chase this fall here and would be prudent to stand aside for now. Above 1.3355-60 would bring rebound to 1.3380-85, break there would bring test of 1.3430-35 but a breach there is needed to revive bullishness and bring retest of 1.3456 resistance, break there would add credence to our view that the correction from 1.3535 has ended and bring further gain to 1.3495-00 but break there is needed to signal upmove has resumed for retest of 1.3535, once this level is penetrated, this would extend recent recent upmove from 1.2969 to 1.3575-80 but previous chart resistance at 1.3599 should hold on first testing.
To recap, wave B from 1.3066 is unfolding as an a-b-c and is sub-divided as a: 1.2192, b: 1.2716 and wave c is a 5-waver with i: 1.1983, ii: 1.2506, extended wave iii with minor iii at 1.0206, wave iv ended at 1.0781 and wave v as well as wave iii has ended at 0.9931, hence the subsequent choppy trading is the wave iv which is unfolding as (a)-(b)-(c) with (a) leg of iv ended at 1.0854, followed by (b) leg at 1.0108 and (c) leg as well as the wave iv ended at 1.0674. The wave v is sub-divided by minor wave (i): 0.9980, (ii): 1.0374, (iii): 0.9446, (iv): 0.9913 and (v) as well as v has possibly ended at 0.9407, therefore, consolidation with upside bias is seen for major correction, indicated target at 1.3700 and 1.4000 had been met and further gain to 1.4700 would be seen later.
(BOC) Bank of Canada Maintains Overnight Rate Target at 1/2 Per cent
The Bank of Canada today announced that it is maintaining its target for the overnight rate at 1/2 per cent. The Bank Rate is correspondingly 3/4 per cent and the deposit rate is 1/4 per cent.
Global economic growth is strengthening and becoming more broadly-based than the Bank had expected in its January Monetary Policy Report (MPR), although there is still considerable uncertainty about the outlook. In the United States, some temporary factors weighed on economic activity in the first quarter but the drivers of growth remain solid. The US is close to full employment, unlike many other advanced economies, including Canada, where material slack remains. Global financial conditions remain accommodative. The Bank expects global GDP growth to increase from 3 1/4 per cent this year to about 3 1/2 per cent in 2018 and 2019.
In Canada, recent data indicate that economic growth has been faster than was expected in the January MPR. Growth was temporarily boosted by a resumption of spending in the oil and gas sector and the effects of the Canada Child Benefit on consumer spending. Residential investment has also been stronger than expected. Employment data have been robust, although gains in hours worked are still soft. Meanwhile, export growth has been uneven in the face of ongoing competitiveness challenges. Further, despite a recent uptick in sentiment, business investment remains well below what could be expected at this stage in the recovery. Accordingly, while the recent rebound in GDP is encouraging, it is too early to conclude that the economy is on a sustainable growth path.
During the rest of this year and into 2018 and 2019, growth in Canada is expected to moderate but remain above potential. At the same time, its composition is expected to broaden as the pace of household spending, especially residential investment, slows while the contributions from exports and business investment increase. The Bank now projects real GDP growth of 2 1/2 per cent in 2017 and just below 2 per cent in 2018 and 2019. Meanwhile, the Bank has revised down its projection of potential growth, reflecting persistently weak investment. With this combination of a higher profile for economic activity and a lower profile for potential, the output gap is projected to close in the first half of 2018, a bit sooner than the Bank anticipated in January.
CPI inflation is now at the 2 per cent target, largely because of the transitory effects of higher oil prices and carbon pricing measures in two provinces, as well as other temporary factors. The Bank's three measures of core inflation, on the other hand, have been drifting down in recent quarters and wage growth remains subdued, consistent with material excess capacity in the economy. CPI inflation is expected to dip in the months ahead, as the temporary factors unwind, and then return to 2 per cent later in the projection horizon as the output gap closes.
The Bank's Governing Council acknowledges the strength of recent data, some of which is temporary, and is mindful of the significant uncertainties weighing on the outlook. In this context, Governing Council judges that the current stance of monetary policy is still appropriate and maintains the target for the overnight rate at 1/2 per cent.
CAC Unchanged as Geopolitical Tensions Weigh on Stock Markets
The CAC 40 is showing little movement on Wednesday, as the index is trading at 5,115.00. On the release front, there are no Eurozone or US events on the schedule. President Donald Trump will conduct an interview with the Fox Business Network, and will discuss health care, tax reform, and the crisis in Syria and North Korea. On Friday, France will publish Final CPI. The markets are forecasting a strong gain of 0.6 percent.
The CAC has enjoyed a strong run in the first quarter of 2017, gaining 4.7 percent. European stock markets have benefited from the eurozone economy, which has recorded higher growth and inflation levels. With economic conditions improving, investor confidence levels have followed suit and posted strong numbers in Q1. Eurozone Sentix Investor Confidence climbed to 23.9 points in April, pointing to strong optimism among investors and analysts. German ZEW Economic Sentiment, which surveys the mood of German investors, sparkled in April, jumping to 19.5 points, well above the forecast of 13.2 points. This marked the strongest reading since August 2015.
European stock markets are steady on Wednesday, as investors remain cautious about geopolitical tensions, particularly in Syria and North Korea. The US bombed a Syrian military base last week, in response to a chemical attack by Syrian warplanes. Russia has strongly condemned the US move, chilling relations even further between the US and Russia. President Trump has also sent warships to the Korea peninsula, in a show of strength against North Korea, which continues to test ballistic missiles in defiance of the international community. If tensions escalate on either of these fronts, stock markets could lose ground.
On Monday, Federal Reserve Chair Janet Yellen provided insights into the Fed mindset. She said that with the economy close to full employment and 2 percent inflation, Fed policymakers were looking to reduce the support that the central bank was providing the economy. The minutes of the March meeting indicated that the Fed plans to trim the $4.5 trillion balance sheet, which has ballooned as a result of the huge asset-purchase program which started in 2008. The Fed plans to raise rates twice more in 2o17, with the next rate expected in June. Yellen emphasized that the Fed's policy stance is neutral, as interest rate increases will be gradual, given that the economy is growing at a moderate pace.
EUR/USD Mid-Day Outlook
Daily Pivots: (S1) 1.0578; (P) 1.0604 (R1) 1.0630; More....
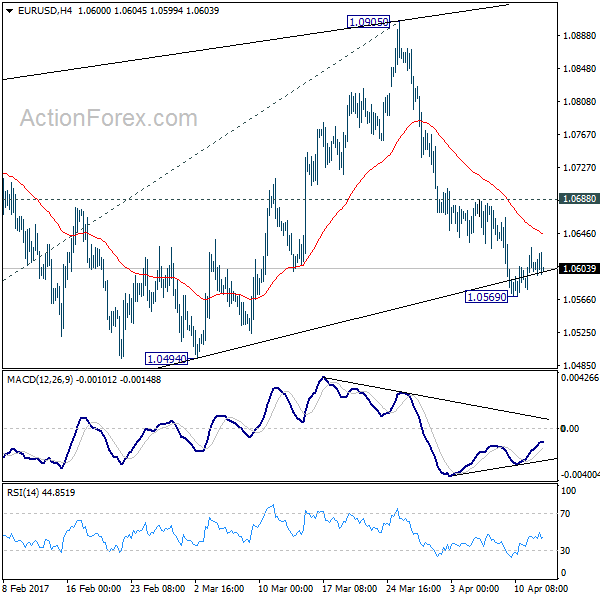
EUR/USD is staying in consolidation above 1.0569 temporary low and intraday bias remains neutral first. Stronger recovery might be seen but upside should be limited by 1.0688 resistance and bring fall resumption. As noted before, corrective rise from 1.0339 is likely finished after being rejected by 55 week EMA. And, the larger down trend is ready to resume. Below 1.0569 will turn bias to the downside for 1.0494 support first. Break will confirm this bearish case and send EUR/USD through 1.0339 to 100% projection of 1.1298 to 1.0339 from 1.0905 at 0.9946. On the upside, however, break of 1.0688 resistance will delay the bearish case and turn focus back to 1.0905 resistance instead.
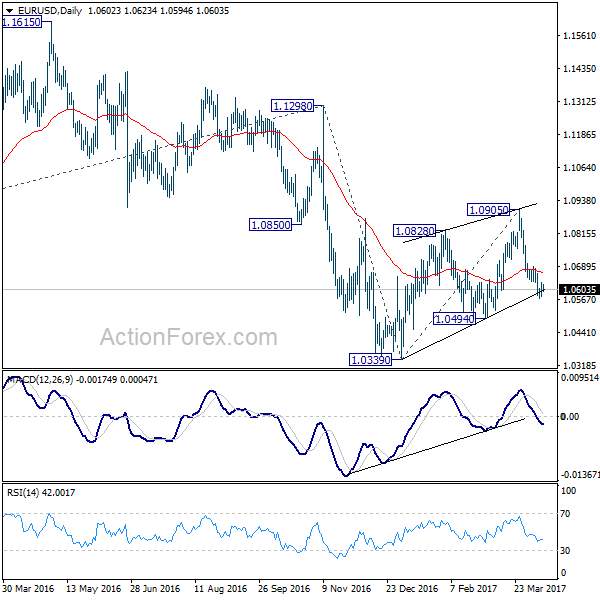
In the bigger picture, as long as 1.1298 key resistance holds, whole down trend from 1.6039 (2008 high) is still expected to continue. Break of 1.0339 low will send EUR/USD through parity to 61.8% projection of 1.3993 to 1.0461 from 1.1298 at 0.9115. However, considering bullish convergence condition in weekly MACD, break of 1.1298 will indicate term reversal. this would also be supported by sustained trading above 55 week EMA.
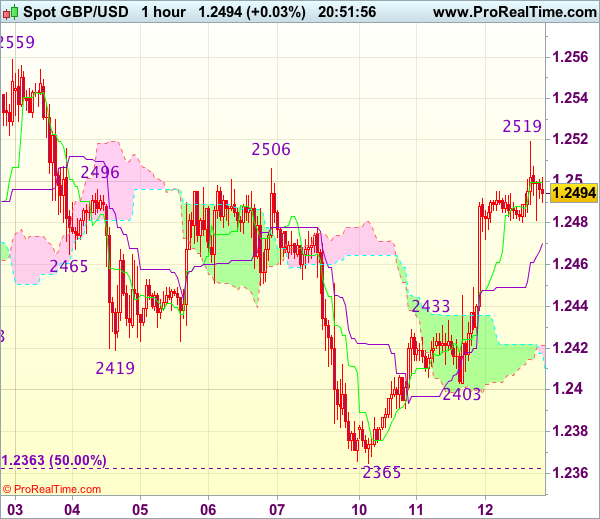
GBP/USD Mid-Day Outlook
Daily Pivots: (S1) 1.2429; (P) 1.2462; (R1) 1.2523; More...
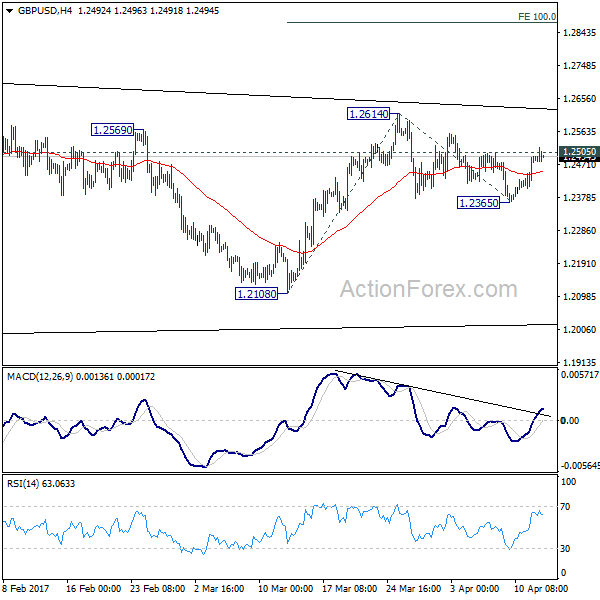
GBP/USD's breach of 1.2505 resistance argues that pull back from 1.2614 has completed at 1.2365 already. Intraday bias is back on the upside for 1.2614 resistance first. Break there will resume whole rise from 1.2108 and target 100% projection of 1.2108 to 1.2614 from 1.2365 at 1.2871. But overall, price actions from 1.1946 low are viewed as a consolidation pattern. We'd expect strong resistance around 55 week EMA (now at 1.3015) to limit upside and bring down trend resumption. But for now, further rise will be favored in near term as long as 1.2365 support holds.
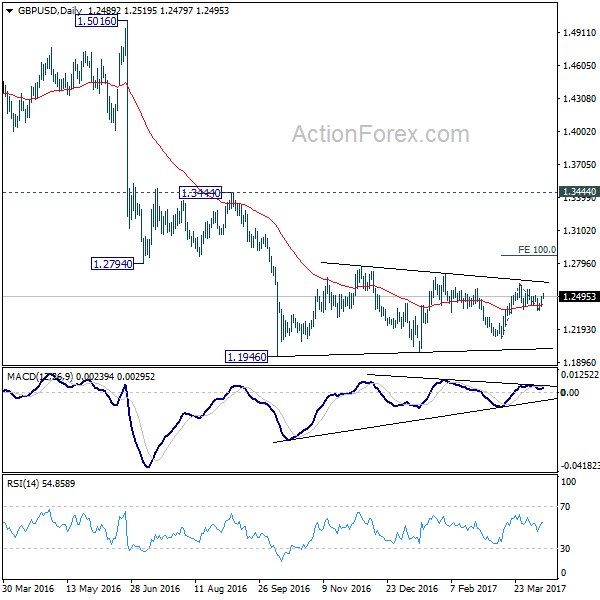
In the bigger picture, fall from 1.7190 is seen as part of the down trend from 2.1161. There is no sign of medium term reversal yet. Sustained trading below 61.8% projection of 2.1161 to 1.3503 from 1.7190 at 1.2457 will target 100% projection at 0.9532. Overall, break of 1.3444 resistance is needed to confirm medium term bottoming. Otherwise, outlook will remain bearish.
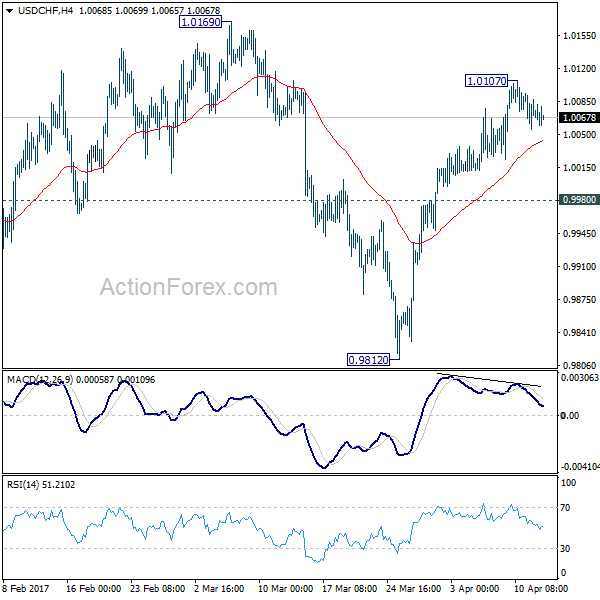
USD/CHF Mid-Day Outlook
Daily Pivots: (S1) 1.0054; (P) 1.0074; (R1) 1.0092; More.....
USD/CHF is staying in consolidation below 1.0107 temporary top. Intraday bias remains neutral for the moment. Outlook is unchanged that corrective fall from 1.0342 should have finished with three waves down to 0.9812. Hence, downside of retreat should be contained by 0.9980 support and bring rally resumption. Above 1.0107 will target 1.0169 resistance. Decisive break there will confirm this bullish case and target 1.0342 key resistance next. However, below 0.9980 will dampen this bullish case and turn bias back to the downside for 0.9812 low.
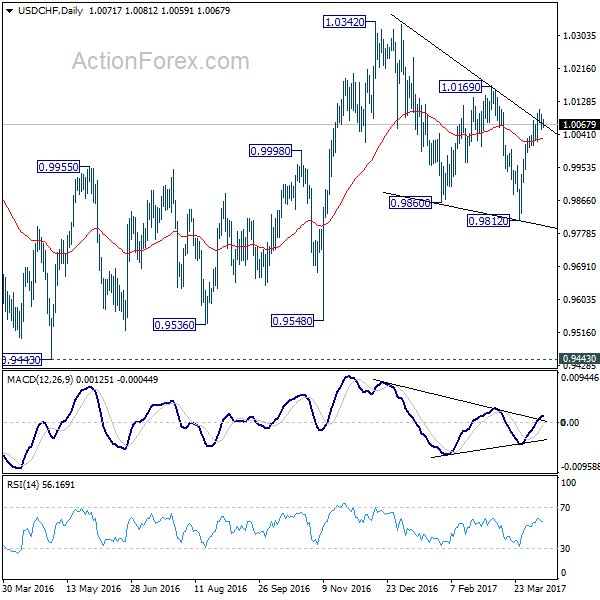
In the bigger picture, we're still maintain that firm break of 1.0342 key resistance is needed to confirm underlying bullish momentum in the cross. However, the corrective nature of the fall from 1.0342 to 0.9812 is starting to give the medium term outlook a bullish favor. Hence, in stead of looking for topping signal around 1.0342, we'd now pay closer attention to upside acceleration as USD/CHF approaches this level again.
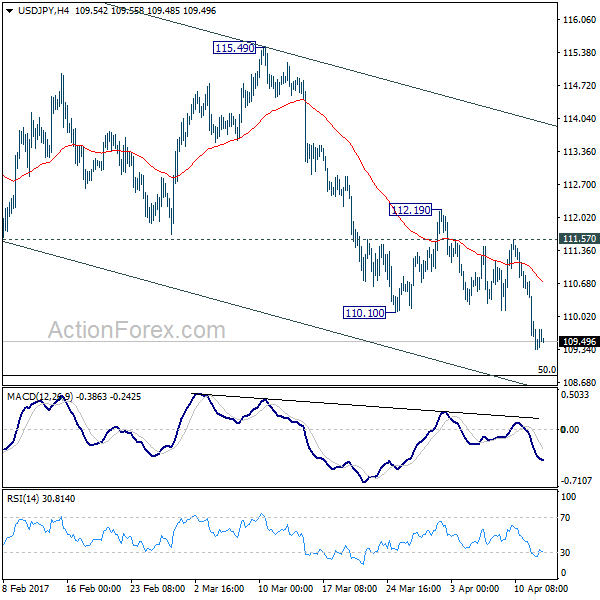
USD/JPY Mid-Day Outlook
Daily Pivots: (S1) 109.15; (P) 110.04; (R1) 110.49; More....
Intraday bias in USD/JPY remains on the downside as the fall from 118.65 is still in progress. Next target will be 50% retracement of 98.97 to 118.65 at 108.81. At this point, there is no clear indication of reversal yet and it's staying comfortably inside a falling channel. Break of 108.81 will target 61.8% retracement at 106.48 and possibly below. Meanwhile, on the upside, break of 111.57 resistance is needed to be the first sign of reversal. Otherwise, outlook will remain bearish in case of recovery.
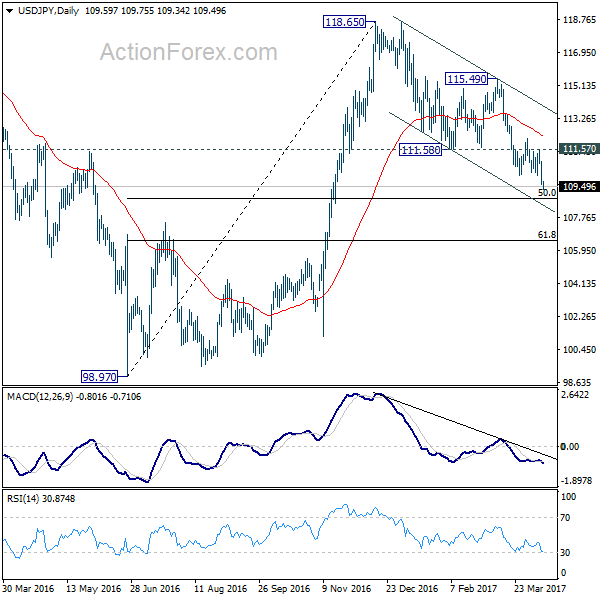
In the bigger picture, price actions from 125.85 high are seen as a corrective pattern. Sustained trading below 55 week EMA (now at 111.15) will indicate that the second leg from 98.97 has completed at 118.65. And in that case, USD/JPY would start the third leg down through 98.97 low to 61.8% retracement of 75.56 to 125.85 at 94.77. On the upside, break of 115.49 resistance should resume the rise from 98.97 for a test on 125.85 high.
Trade Idea Update: USD/CHF – Buy at 1.0000
USD/CHF - 1.0067
Original strategy :
Buy at 1.0000, Target: 1.0100, Stop: 0.9965
Position : -
Target : -
Stop : -
New strategy :
Buy at 1.0000, Target: 1.0100, Stop: 0.9965
Position : -
Target : -
Stop : -
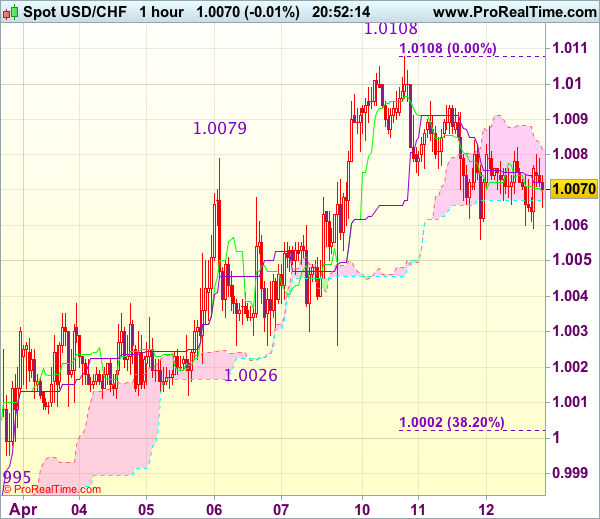
Dollar’s retreat after rising to 1.0108 on Monday has retained our view that consolidation below this level would be seen and initial downside risk is for pullback to 1.0050, then towards support at 1.0026, however, reckon 0.9995 support would contain weakness and bring another rise later, above indicated resistance at 1.0108-09 would extend recent upmove from 0.9813 towards 1.0140-45 but loss of upward momentum should prevent sharp move beyond another previous resistance at 1.0171, risk from there has increased for a retreat to take place later.
In view of this, would not chase this rise here and would be prudent to buy dollar on subsequent pullback as support at 0.9995 should limit downside. Below 0.9970 (50% Fibonacci retracement of 0.9831-1.0108) would abort and signal top is formed instead, bring correction to support at 0.9948.
Trade Idea Update: GBP/USD – Stand aside
GBP/USD - 1.2493
New strategy :
Stand aside
Position : -
Target : -
Stop : -
As cable has maintained a firm undertone after yesterday’s rally, suggesting low has been formed at 1.2365 on Monday and near term upside risk remains for the rebound from there to extend gain to 1.2520-30, however, break there is needed to add credence to this view and bring further rise towards resistance at 1.2559 but near term overbought condition should prevent sharp move beyond there, bring retreat later.
In view of this, would not chase this rise here and would be prudent to stand aside for now. Below 1.2445-50 would suggest an intra-day top is possibly formed, bring weakness to 1.2420, break there would confirm and bring further fall to 1.12400-05 which is likely to hold on first testing.