Sample Category Title
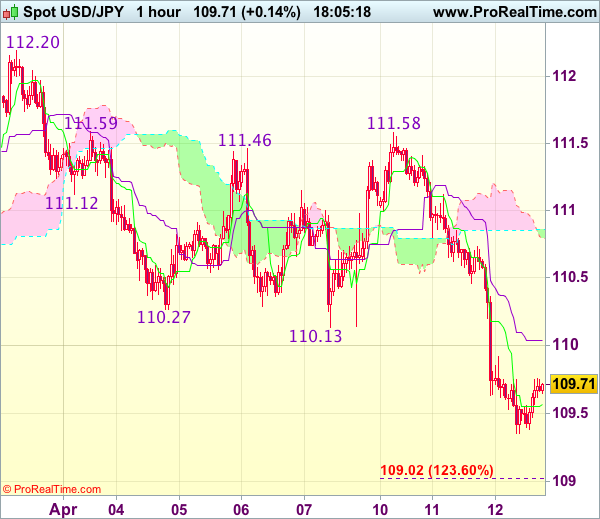
Daily Technical Analysis: USD/JPY Breaks 110 Round Level And Arrives At Critical 50% Fib
Currency pair USD/JPY
The USD/JPY broke below the support trendline (dotted green) and has now reached the 50% Fibonacci support level of wave 4 vs 3 (purple). This is an important decision zone because a bullish bounce would confirm the current wave 4 (purple) structure, whereas a bearish break below the 50% Fibonacci level would make a continuation towards the 61.8% Fibonacci retracement likely (plus a new wave structure).
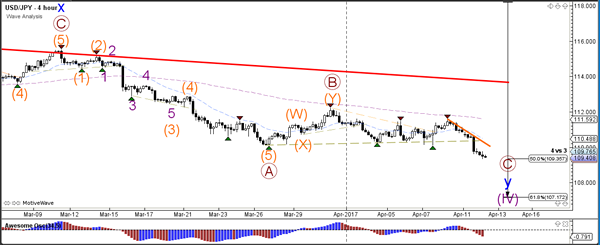
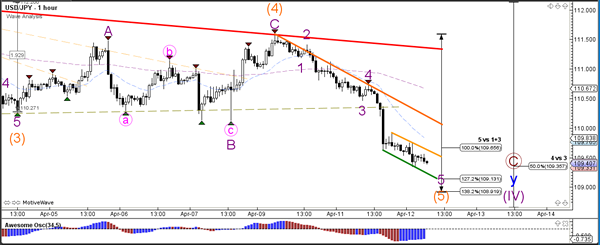
The USD/JPY is building a 5 wave structure (purple) within wave 5 (orange) of wave C (brown). The 5th wave (purple) is slowing down its pace and moving lower in a small channel (orange/green lines).
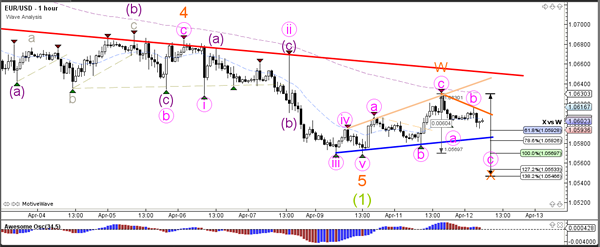
Currency pair EUR/USD
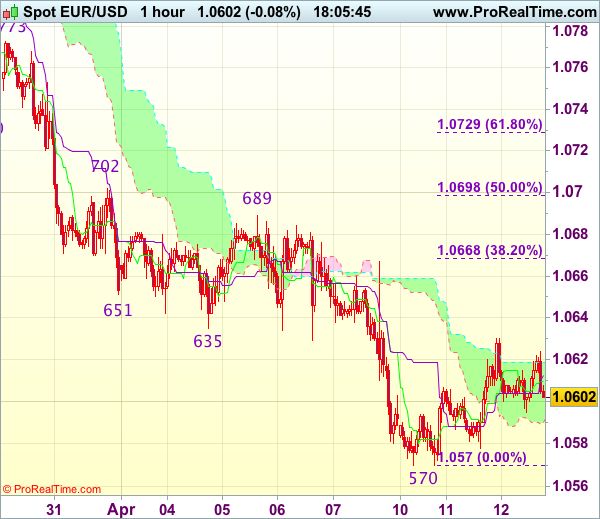
The EUR/USD is pausing and moving sideways which could indicate that the 5th wave (orange) of wave 1 (green) has been completed. A break above the resistance trendline (red) could spark a retracement within wave 2 (green).
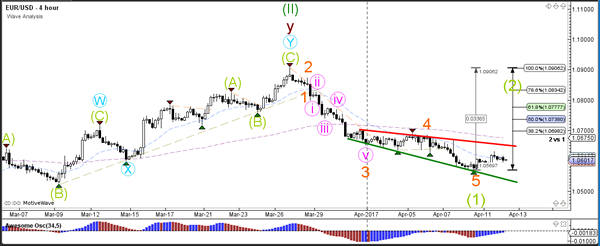
The EUR/USD did not build a 5 wave structure but rather an ABC (pink). This is probably part of a larger WXY (orange) correction, which is why the Fibonacci levels of wave X (orange) and the support trendline (blue) could provide bouncing spots.
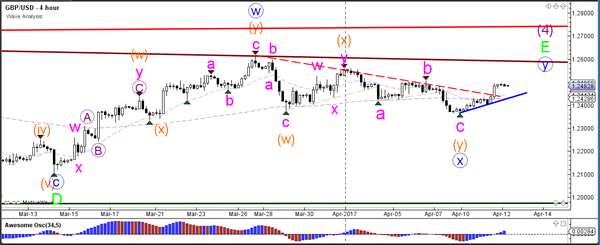
Currency pair GBP/USD
The GBP/USD broke above the resistance trendline (red), which confirms the completion of wave X (blue) and the start of wave Y (blue). Price could now be heading higher to test larger resistance levels (brown/red), but a break above the previous top of the triangle (red line) would invalidate wave E (green).
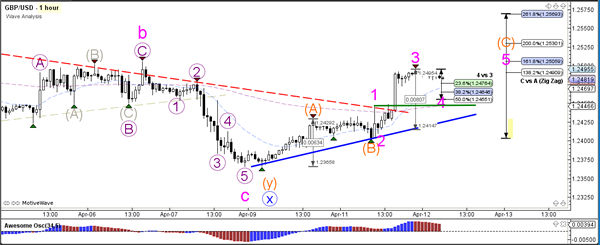
The GBP/USD is probably building an ABC zigzag (orange). Within wave C (orange), there could be a 5-wave pattern (pink). The wave 4 (pink) becomes invalidated if price breaks below the top of wave 1 (green line).
Bank Of Canada: Still Dovish Despite Progress In Economic Data?
Today, all eyes will be on the Bank of Canada rate decision. Expectations are for the Bank to remain on hold once again. The BoC has maintained a concerned tone recently. At the press conference following the January gathering, Governor Poloz unexpectedly said that another rate cut remains on the table, while in the latest policy statement, the Bank hinted that there are still 'significant uncertainties' weighing on the outlook for exports. The Bank has previously stressed that the strength of CAD is posing challenges to that outlook. Even though the economic data have improved somewhat since the latest meeting, particularly with regards to economic growth, we doubt that this is enough to lead to a material change in the officials' dovish rhetoric.
Thus, our view is that the Bank will probably remain on hold once again, but will likely keep the door wide open for a near-term cut, if needed. By providing dovish hints and essentially talking down the currency, the BoC can ensure that Canada's exports remain competitive. It is also worth noting that this meeting includes a press conference as well, so even if the statement has a more or less neutral tone, we could still get some concerned comments from Governor Poloz. Such signals could bring CAD under selling interest.
USD/CAD declined somewhat yesterday, after finding resistance near the 1.3360 (R1) hurdle. Given the price structure on the 4-hour chart, and that on Monday the pair broke below a short-term uptrend line taken from the low of the 16th of February, we think that the short-term bias is flat for now. Any dovish signals from the BoC today could be the trigger for another test near the 1.3360 (R1) barrier, where a clear break could pave the way towards the 1.3400 (R2) territory.
Safe havens rally as geopolitical risks take center stage
Investors sought the shelter of safe haven assets yesterday, amid rising geopolitical tensions in the Korean Peninsula. Both the yen and gold rallied after North Korea warned the US of a nuclear attack if it is provoked, as a response to the US sending military ships to the region. President Trump replied via tweeter that North Korea is 'looking for trouble', and that if China does not help, then the US will solve the problem alone.
Should these geopolitical uncertainties remain in the market's spotlight, or even escalate further in coming days, investors could stay in a risk-averse mood in our view. Safe havens such as the yen and gold could extend their recent gains. In particular, we would expect JPY to strengthen further against EUR, bearing in mind that the first round of the French elections and the 'Le Pen risk', are just around the corner. Meanwhile, stocks and risk-sensitive currencies like the AUD and NZD may continue to underperform, as market participants avoid risky assets.
EUR/JPY has been printing lower highs and lower lows recently below a short-term downtrend line taken from the 17th of March. The pair plunged after finding resistance near the 117.40 (R2) hurdle, to break below the 116.85 (R1) support-turned-into-resistance level. It continued to decline during the Asian day Wednesday and at the time of writing, the pair looks to be headed for a test near the support zone of 115.70 (S1). If the bears prove strong enough to overcome that barrier, we may see further downside extensions towards the 114.10 (S2) territory.
As for the rest of today's highlights:
During the European day, the economic calendar is light. The only noteworthy data we get are UK employment figures for February. The forecast is for the unemployment rate to have held steady, while average weekly earnings are expected to have risen at the same pace as previously. However, earnings excluding bonuses, which the BoE has signaled that it pays a lot of attention to, are expected to have slowed. We think that something like that could confirm the Bank's concerns that real income growth in the UK is headed for a slowdown, especially as inflation is expected to accelerate further in coming months. As a result, these employment data could curb even further speculation regarding a tightening move by the BoE and thereby, reverse some of sterling's latest gains.
USD/CAD
Support: 1.3310 (S1), 1.3280 (S2), 1.3210 (S3)
Resistance: 1.3360 (R1), 1.3400 (R2), 1.3430 (R3)
EUR/JPY
Support: 115.70 (S1), 114.10 (S2), 113.25 (S3)
Resistance: 116.85 (R1), 117.40 (R2), 118.10 (R3)
GOLD A New Phase Of Strength Is Expected, SILVER Bullish Reversal, Crude Oil Bullish Momentum.
GOLD (in USD) A new phase of strength is expected.
Gold has broken the key resistance area 1263. This validates a bullish reversal pattern with an upside potential at 1337. The hourly support at 1263 (previous resistance) has induced some buying interest. Another hourly support lies at 1260 (rising trendline). An hourly resistance can now be found at 1280 (intraday high).
In the long-term, the technical structure suggests that there is a growing upside momentum. A break of 1392 (17/03/2014) is necessary ton confirm it, A major support can be found at 1045 (05/02/2010 low).
SILVER (in USD) Bullish reversal.
Silver is rising sharply, validating the recent technical improvements. Strong resistance is given at a distance at 18.49 (27/02/2017 high). Key support is given at 17.74 (10/04/2017 low) then 16.82 (15/03/2017 low).
In the long-term, the death cross indicates that further downsides are very likely. Resistance is located at 25.11 (28/08/2013 high). Strong support can be found at 11.75 (20/04/2009).
Crude Oil (in USD) Bullish momentum.
Crude oil continues to find strong demand. Hourly resistance can be located at 54(07/04/2017 high then 55.24 03/01/2017 high). Support stands at 52.80 (intraday low and rising trendline).
In the long-term, crude oil has recovered after its sharp decline last year. However, we consider that further weakness are very likely. Strong support lies at 24.82 (13/11/2002) while resistance can now be found at 55.24 (03/01/2017 high).
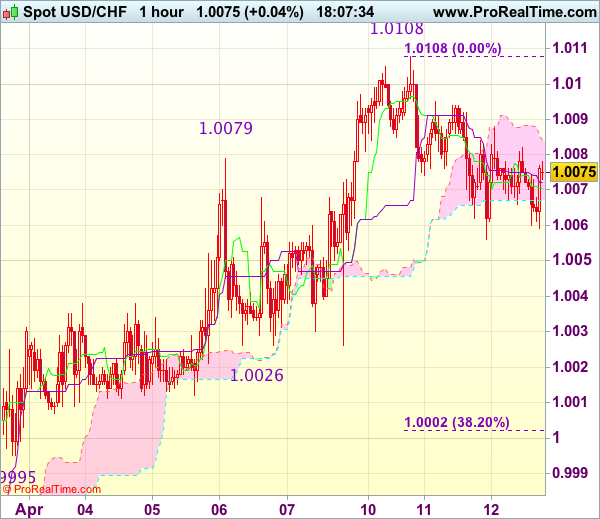
Trade Idea Update: USD/CHF – Buy at 1.0000
USD/CHF - 1.0072
Original strategy :
Buy at 1.0000, Target: 1.0100, Stop: 0.9965
Position : -
Target : -
Stop : -
New strategy :
Buy at 1.0000, Target: 1.0100, Stop: 0.9965
Position : -
Target : -
Stop : -
Dollar’s retreat after rising to 1.0108 on Monday has retained our view that consolidation below this level would be seen and initial downside risk is for pullback to 1.0050, then towards support at 1.0026, however, reckon 0.9995 support would contain weakness and bring another rise later, above indicated resistance at 1.0108-09 would extend recent upmove from 0.9813 towards 1.0140-45 but loss of upward momentum should prevent sharp move beyond another previous resistance at 1.0171, risk from there has increased for a retreat to take place later.
In view of this, would not chase this rise here and would be prudent to buy dollar on subsequent pullback as support at 0.9995 should limit downside. Below 0.9970 (50% Fibonacci retracement of 0.9831-1.0108) would abort and signal top is formed instead, bring correction to support at 0.9948.
China’s March Inflation And FX Reserve Update
The latest inflation report continues to portray a subdued CPI, high PPI environment in China. Headline CPI improved to +0.9% y/y in March from +0.8% a month ago. The market has anticipated stronger pickup to +1%. Core inflation (excluding food and energy) rose +2% y/y, up from +1.8% in February. The decline in food prices deepened to -4.4% y/y from -4.3% in February. Nonfood inflation improved modestly to +2.3% y/y, up from +2.2% in February. PPI eased to +7.6% in March, from +7.8% in the prior month, compared with consensus of +7.5%. Both seasonal factors and moderation in the commodity price rally were key reasons for the slowdown. Lunar New Year in the first week of February pushed prices higher and absence of such factor was reflected in the March reading. Meanwhile, mining input prices gained +3.7% y/y in March, compared with a +36.1% y/y rally in the prior month. Oil and gas price, gaining +68.5% y/y in the month, was the biggest driver of PPI inflation last month. We expect PPI to stay high in coming months but growth would be more gradual due to strong base effect. Meanwhile, the rally in commodity prices over the past months is seen passing through to downstream CPI.
As we mentioned in previous reports, the Chinese government has adopted monetary tightening measured targeting the asset markets in order to prevent macro risks and sustain stable social and economic developments and prevention of macro risks. We believe the government's tightening policy would remain confined to interbank tightening. The probability of raising benchmark interest rates stays low, as headline inflation remains subdued. Rather, this might lead to more chances of liquidity injection into the market.
China's FX reserve stayed about US$ 3 trillion in March, as the government's strict capital control measures adopted since the beginning of this year helped curb the depreciation in renminbi. FX reserve increased +US$ 3.96M to US$3.01 trillion in March, marking a second consecutive monthly but decelerated growth in the series. Yet, FX reserve stays -24.6% below the peak made in June 2014. Renminbi has stabilized so far this year. USDCNY fell -0.86% in 1Q17, after gaining over the past three consecutive quarters (up +7.53% in total). Besides China's capital control effort, pullback in US dollar also helped stabilize renminbi. During the first quarter, USD index DXY was down -1.82%.Again, we suggest to wait for PBOC's FX position and SAFE flow data before judging capital flow situation in China.
China would release its March trade report on Thursday (April 13) with a surplus of US$ 12.5B, following a deficit of 9.1B in the prior month. In February, imports soared +44.7% y/y while exports gained +4.2% y/y, compared with growths of +15.9% and +25.2%, respectively, in January. The sharp rise in imports might indicate improvement in domestic demand
Trade Idea Update: GBP/USD – Stand aside
GBP/USD - 1.2491
New strategy :
Stand aside
Position : -
Target : -
Stop : -
As cable has maintained a firm undertone after yesterday’s rally, suggesting low has been formed at 1.2365 on Monday and near term upside risk remains for the rebound from there to extend gain to 1.2520-30, however, break there is needed to add credence to this view and bring further rise towards resistance at 1.2559 but near term overbought condition should prevent sharp move beyond there, bring retreat later.
In view of this, would not chase this rise here and would be prudent to stand aside for now. Below 1.2445-50 would suggest an intra-day top is possibly formed, bring weakness to 1.2420, break there would confirm and bring further fall to 1.12400-05 which is likely to hold on first testing.

Trade Idea Update: EUR/USD – Sell at 1.0665
EUR/USD - 1.0605
Original strategy :
Sell at 1.0665, Target: 1.0565, Stop: 1.0700
Position : -
Target : -
Stop : -
New strategy :
Sell at 1.0665, Target: 1.0565, Stop: 1.0700
Position : -
Target : -
Stop : -
As the single currency has recovered again after finding support at 1.0595 earlier today, retaining our view that further consolidation would be seen and initial upside risk remains for the rebound from 1.0570 low to extend gain to 1.0630, then 1.0650, however, reckon upside would be limited to 1.0667 resistance (Friday’s high) and bring another decline later, below said support at 1.0595 would bring retest of Monday’s low at 1.0570, break there would extend the decline from 1.0906 to 1.0550-55 (50% projection of 1.0906-1.0635 measuring from 1.0689), then 1.0525-30.
In view of this, would not chase this fall here and would be prudent to sell dollar on further recovery as 1.0667 resistance should limit upside. Only a firm break above said resistance at 1.0667 would abort and suggest low is formed instead, risk a stronger rebound to 1.0689, then 1.0702.
Trade Idea Update: USD/JPY – Sell at 110.30
USD/JPY - 109.70
Original strategy :
Sell at 110.30, Target: 109.30, Stop: 110.65
Position : -
Target : -
Stop : -
New strategy :
Sell at 110.30, Target: 109.30, Stop: 110.65
Position : -
Target : -
Stop : -
Yesterday’s selloff below support at 110.11 on active cross-buying in yen in part due to risk aversion suggests recent entire decline 118.66 top is still in progress, hence downside bias remains for recent decline to extend weakness to 109.30-35, then towards 109.00-05 (123.6 times projection of 112.20-110.13 measuring from 111.58), however, near term oversold condition should prevent sharp fall below 108.85 (61.8% projection of 115.51-110.11 measuring from 112.20) and reckon 108.40-50 (100% projection of 118.66-111.55 measuring from 115.51) would hold, bring rebound later.
In view of this, would not chase this fall here and would be prudent to sell dollar on recovery as 110.30-40 should cap upside and bring another decline. Above 110.70-75 would defer and risk a stronger rebound to 111.00-05 but price should falter well below resistance at 111.58.
EUR/CHF Choppy Trading, EUR/JPY Challenging The Support At 115.95, EUR/GBP Break Below Rising Trendline.
EUR/CHF Choppy trading.
EUR/CHF has paused near the key support at 1.0684 (see also the falling channel). However, the persistent succession of lower highs favours a bearish bias. Hourly resistances can be found at 1.0691 (07/04/2017 high). The medium-term pattern suggests us to see continued bearish pressures towards key support that can be found at 1.0623 (24/06/2016 low). Expected to see further decline.
In the longer term, the technical structure is mixed. Resistance can be found at 1.1200 (04/02/2015 high). Yet,the ECB's QE programme is likely to cause persistent selling pressures on the euro, which should weigh on EUR/CHF. Supports can be found at 1.0184 (28/01/2015 low) and 1.0082 (27/01/2015 low).
EUR/JPY Challenging the support at 115.95.
EUR/JPY recovery bounce off support was short lived and is not challenging the trendline support at 115.95. Next support is given at 113.73 (09/11/2016 low). Resistance stands at 117.43 then 122.88 (13/03/0217 high).
In the longer term, the technical structure validates a medium-term succession of lower highs and lower lows. As a result, the resistance at 149.78 (08/12/2014 high) has likely marked the end of the rise that started in July 2012. Strong support at 94.12 (24/07/2012 low) looks nonetheless far away.
EUR/GBP Break below rising trendline.
EUR/GBP remains weak as can be seen by the clear break of falling trendline support at 0.8536. Support stands at 0.8450 (03/01/2017 low). Hourly resistance is given at 0.8591 (05/04/2017 high). Strong resistance is given at 0.8787 (13/03/2017 high). Hourly support can be found at 0.8484 (31/03/2017 low). Expected to show continued weakness.
In the long-term, the pair has largely recovered from recent lows in 2015. The technical structure suggests a growing upside momentum. The pair is trading above from its 200 DMA. Strong resistance can be found at 0.9500 psychological level.
EUR/CHF Elliott Wave Analysis
EUR/CHF : 1.0686
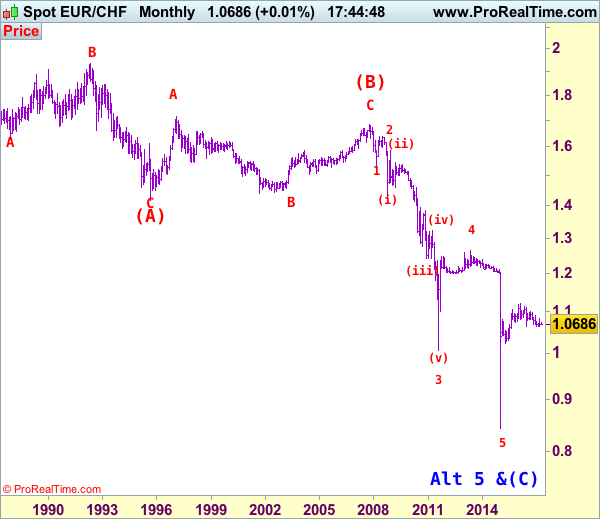
EUR/CHF: Major wave 5 trough ended at 0.8426 and correction has commenced from there for subsequent gain towards 1.1400-1.1500.
The single currency met resistance at 1.0727 last week and has retreated again, retaining our bearishness and consolidation with downside bias remains for the retreat from 1.0825 (last month’s high) to extend weakness to 1.0650-60, however, break of support at 1.0622 is needed to confirm early erratic decline from 1.1201 (2016 high) has resumed, bring subsequent selloff to 1.0550 and possibly towards 1.0500 but oversold condition should prevent sharp fall below latter level and reckon 1.0390-00 would hold from here, risk from there has increased for a rebound later.
To recap our preferred count, the decline from 1.6828 (end wave (B)) is labeled as the beginning of wave (C) which should unfold as an impulsive move with 1: 1.5326, 2: 1.6377 and wave 3 is sub-divided into (i): 1.4300, (ii): 1.5880 and wave (iii) is still unfolding with (1): 1.4577, (2): 1.5448 and wave (3) is an extended 3rd with i: 1.5006, ii: 1.5383, wave iii: 1.3073, then wave iv ended at 1.3925 and wave v at 1.3073, wave (4) ended at 1.3925 and wave (5) has ended at 1.2765 which also marked the low of wave (iii) and wave (iv) has ended at 1.3835 and wave (v) as well as larger degree wave 3 has ended at 1.0075. The selloff from 1.2650 signals wave 4 has ended there and we are taking a view that the wave 5 could also have ended 0.8426, hence consolidation is seen with mild upside bias for rebound to 1.1000 first, then towards 1.1400.
On the upside, expect recovery to be limited to 1.0727 and bring another decline. Only above said resistance at 1.0825 would abort and signal low has been formed, bring a stronger rebound to 1.0850 and later towards resistance at 1.0898 which is likely to cap euro’s upside, the pair shall head back south again from there.
Recommendation: Hold short entered at 1.0750 for 1.0550 with stop lowered to break-even.
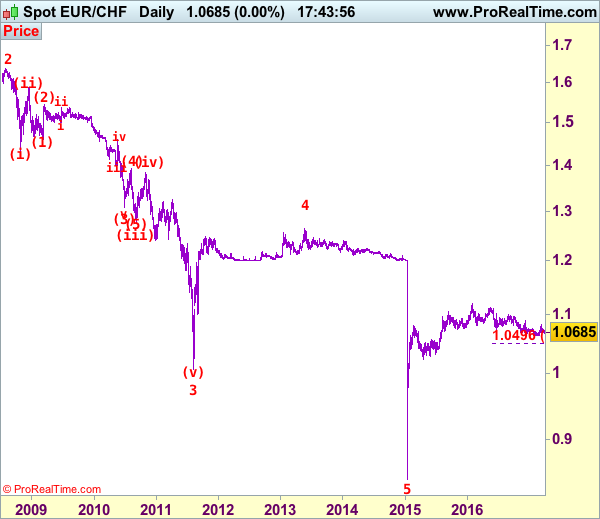
The long-term downtrend started from 1.9626 (Apr 1985) to 1.4166 (Sep 1995) is treated as wave (A) with A:1.6285 (Dec 1987), B: 1.9342 (May 1992) and C: 1.4166, then wave (B) ended at 1.6828 with A: 1.7147 (Feb 1997), B: 1.4398 (Sep 2001), C: 1.6828 (Nov 2007), therefore, wave (C) is now in progress with the breakdown indicated as above. This wave (C) already met indicated downside target at 1.1455/60 and 1.1300, it could have ended at 0.8426, consolidation with mild upside bias is seen for gain to 1.1000 and later towards 1.2000.