Sample Category Title
EUR/USD Candlesticks and Ichimoku Analysis
Weekly
• Last Candlesticks pattern: Shooting star
• Time of formation: 03 May 2016
• Trend bias: Down
Daily
• Last Candlesticks pattern: Shooting star
• Time of formation: 3 May 2016
• Trend bias: Sideways
EUR/USD – 1.0908
After last week’s gap-up opening and breaking of previous resistance at 1.0906, the single currency has maintained a firm undertone, adding credence to our view that the erratic rise from 1.0340 low is still in progress and may extend further gain, above 1.0951 resistance would bring subsequent rise to 1.1000 and then towards 1.1050-60 but upside should be limited to 1.1100 and price should falter well below previous chart resistance at 1.1300, bring selloff later.
On the downside, whilst initial pullback to 1.0820-25 cannot be ruled out, reckon downside would be limited to previous resistance at 1.0778 and bring another rise later. A daily close below the Kijun-Sen (now at 1.0761) would defer and suggest top is possibly formed, risk test of support at 1.0682 but break there is needed to add credence to this view, bring further fall to the lower Kumo (now at 1.0642). Looking ahead, only break of 1.0600-05 would provide confirmation and suggest the aforesaid rise from 1.0340 has possibly ended, risk test of key support at 1.0570 first.
Recommendation: Buy at 1.0800 for 1.1000 with stop below 1.0700.
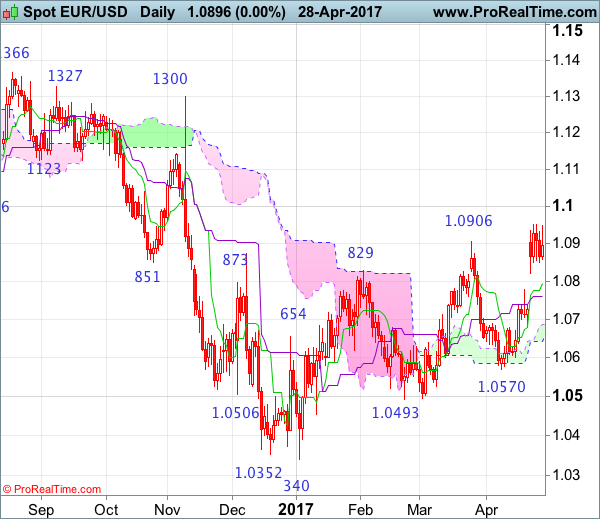
On the weekly chart, although the single currency opened higher last week, lack of follow through buying formed a doji candlestick pattern, suggesting the direction is still unclear at the moment, if this week ends with a long white candlestick, this would add credence to our bullish view that low has been formed at 1.0340 earlier and extend this rebound for at least a retracement of recent decline to 1.1000, then test of the lower Kumo (now at 1.1070) but reckon the upper Kumo (now at 1.1161) would limit upside and resistance at 1.1300 should hold, price should falter below strong resistance at 1.1366.
On the downside, although initial pullback to the Kijun-Sen (now at 1.0820) is likely, reckon previous resistance at 1.0778 would limit downside and bring another rise later. A drop below the Tenkan-Sen (now at 1.0723 would risk weakness to 1.0682 support but break of 1.0570 support is needed to abort and signal the aforesaid corrective rise from 1.0340 low has ended instead, then further decline towards key level at 1.0493 would follow.
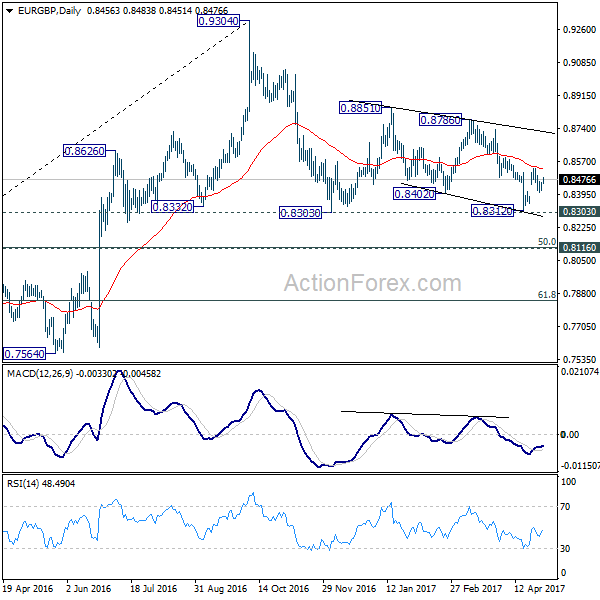
EUR/GBP Daily Outlook
Daily Pivots: (S1) 0.8430; (P) 0.8444; (R1) 0.8473; More...
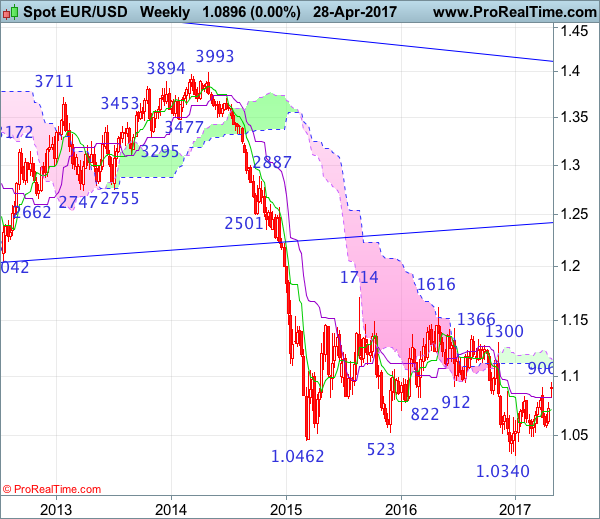
The break of 0.8461 minor resistance suggests that pull back from 0.8529 is completed at 0.8404. Intraday bias is turned back to the upside for 0.8529. Break there will resume the rebound from 0.8312 towards 0.8786 resistance. On the downside, below 0.8404 will turn focus back to 0.8303 low instead. Overall, price actions form 0.9304 are seen as a corrective pattern and is extending.
In the bigger picture, price actions from 0.9304 are viewed as a medium term corrective pattern. In case of deeper fall, we'd expect strong support from 0.8116 cluster support (50% retracement of 0.6935 to 0.9304 at 0.8120) to contain downside. Rise from 0.6935 (2015 low) will resume at a later stage to 0.9799 (2008 high). However, sustained break of 0.8116 could bring deeper decline to next key support level at 0.7564 before the correction completes.
USD/JPY Candlesticks and Ichimoku Analysis
Weekly
• Last Candlesticks pattern: Marubozu
• Time of formation: 14 Nov 2016
• Trend bias: Down
Daily
• Last Candlesticks pattern: Shooting star
• Time of formation: 15 Feb 2017
• Trend bias: Down
USD/JPY – 112.05
The greenback found renewed buying interest at 109.62 (just above last week’s low at 109.59) and has rallied again, dampening our bearishness and suggesting the rebound from 108.13 low is still in progress for retracement of recent decline, hence gain to previous resistance at 112.20 would be seen, however, a daily close above this level is needed to retain bullishness and bring a stronger rebound to the lower Kumo (now at 112.99), then test of 113.35-40 (50% Fibonacci retracement of 118.66-108.13), however, reckon upside would be limited to 114.00 and 114.60-65 (61.8% Fibonacci retracement) and price should falter below key resistance at 115.51, bring retreat later.
On the downside, whilst initial pullback to 111.00 and possibly 110.50-60 cannot be ruled out, reckon the Kijun-Sen (now at 110.17) would limit downside and bring another rise later. Only a daily close below said support at 109.59 would suggest top is possibly formed instead, bring weakness to 108.85-90 but break there is needed to signal the rebound from 108.13 has ended, then retest of this recent low would follow. Looking ahead, dollar needs to penetrate this level to revive bearishness and extend the erratic decline from 118.66 top to 107.85-90 (61.8% Fibonacci retracement of 101.19-118.66) and possibly 107.40-50.
Recommendation : Stand aside for this week.
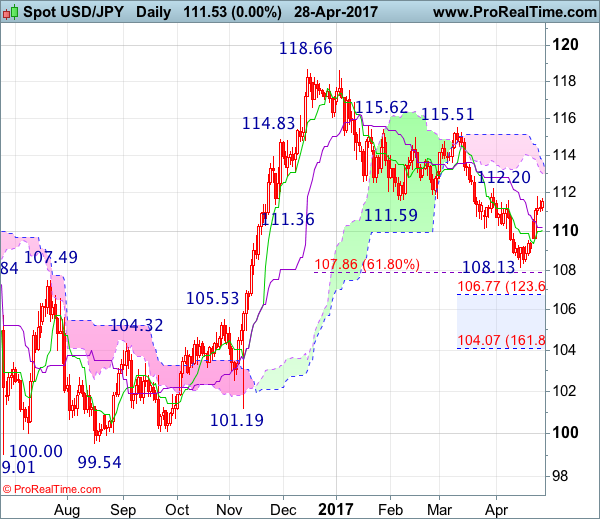
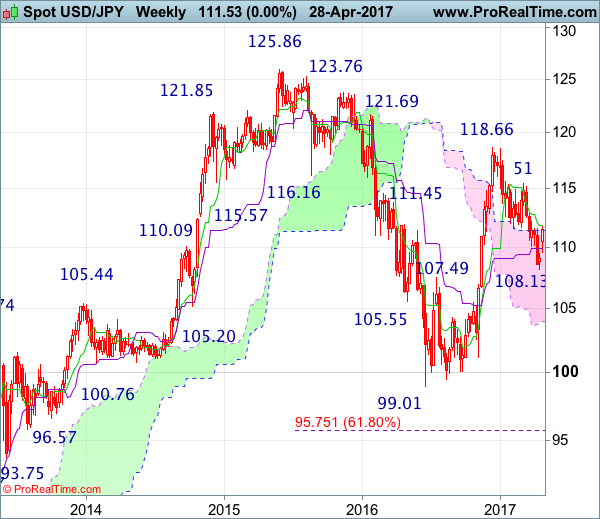
On the weekly chart, as the greenback rallied after opening higher last week, suggesting low has possibly been formed at 108.13 last month and consolidation with upside bias is seen, break of 112.20 resistance would encourage for a stronger rebound to 113.35-40 (50% Fibonacci retracement of 118.66-108.13), then towards 114.60-65 (61.8% Fibonacci retracement), however, reckon upside would be limited and price should falter well below resistance at 115.51. Looking ahead, only a break of 115.51 would retain bullishness and signal the entire correction from 118.66 has ended at 108.13), bring further rise to 119.50, then 120.00-10 but resistance at 121.69 should remain intact.
On the downside, expect pullback to be limited to 110.60-70 and bring another rise later. Below the Kijun-Sen (now at 109.93) would risk test of last week’s low at 109.59 but a weekly close below previous resistance at 109.49 is needed to signal top is formed instead, bring weakness to 108.80-85, break there would bring retest of 108.13 support, once this level is penetrated, this would revive bearishness an extend recent selloff from 118.66 to 107.85-90 (61.8% Fibonacci retracement of 101.19-118.66), then towards 107.00, however, reckon downside would be limited to 106.50-55 (61.8% Fibonacci retracement of 99.01-119.52) and previous resistance at 105.53 (now support) should remain intact.
Trade Idea : USD/CHF – Stand aside
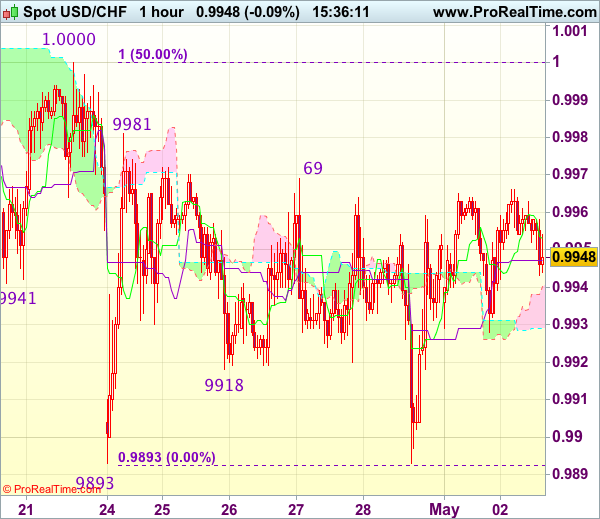
USD/CHF - 0.9948
Most recent candlesticks pattern : N/A
Trend : Near term down
Tenkan-Sen level : 0.9953
Kijun-Sen level : 0.9947
Ichimoku cloud top : 0.9940
Ichimoku cloud bottom : 0.9929
New strategy :
Stand aside
Position : -
Target : -
Stop : -
Despite last week’s late fall to 0.9893, failure to penetrate this last week’s low and the subsequent strong rebound to 0.9961 has retained our view that further choppy trading above said support would take place, above 0.9969 would bring test of resistance at 0.9981 but only break of 1.0000-08 resistance would confirm a temporary low has been formed at 0.9893, bring retracement of recent decline to 1.0025-30 (61.8% Fibonacci retracement of 1.0108-0.9893) but price should falter well below resistance at 1.0067.
On the downside, below 0.9915-20 would bring another test of said strong support at 0.9893 but break there is needed to revive bearishness and signal the decline from 1.0108 top has resumed and extend weakness to 0.9865-70 (2 times extension of 1.0108-1.0008 measuring from 1.0067), however, support at 0.9831 would hold from here, bring rebound later. As near term outlook is mixed, would be prudent to stand aside for now.
EUR/AUD Daily Outlook
Daily Pivots: (S1) 1.4434; (P) 1.4515; (R1) 1.4562; More...
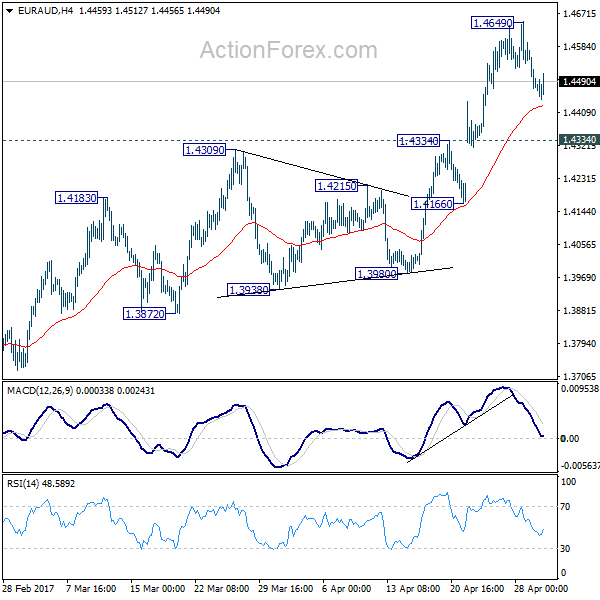
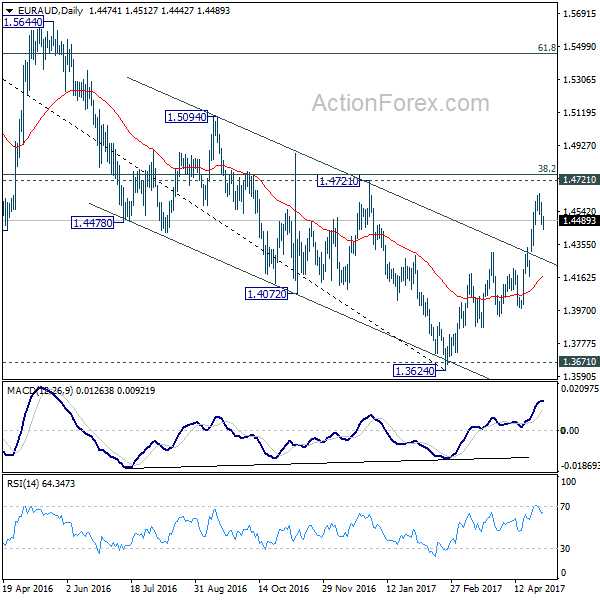
Intraday bias in EUR/AUD remains neutral for consolidation below 1.4649 temporary top. We're holding on to the view of trend reversal after defending 1.3671 key support. Hence, downside of retreat should be contained by 1.4334 resistance turned support and bring another rally. Above 1.4649 will target 1.4721 key resistance. Decisive break of 1.4721 will confirm our bullish view. However, break of 1.4334 will suggest rejection from 1.4721 and turn bias back to the downside for 1.3980 support instead.
In the bigger picture, price actions from 1.6587 medium term top are viewed as a corrective pattern. Such correction could be completed after defending 1.3671 key support. Break of 1.4721 cluster resistance (38.2% retracement of 1.6587 to 1.3624 at 1.4756) should confirm this case and target 61.8% retracement at 1.5455 and above. Overall, we'd expect the up trend from 1.1602 to resume later. However, sustained break of 1.3671 will invalidate our bullish view and would turn extend the fall from 1.6587 towards 1.1602 long term bottom.
Technical Outlook: USDJPY – Strong Bullish Signals On Break Above Key Barriers
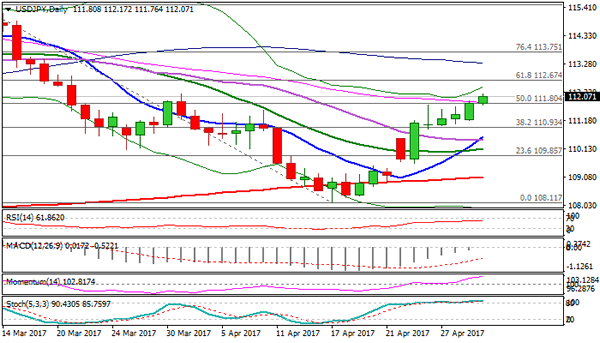
The pair continues to trend higher on Tuesday and met its next targets at 112.14/18 (Fibo 38.2% of 118.65/108.11 / 31 Mar high) on fresh acceleration that followed strong bullish close on Monday.
Repeated close above weekly cloud is bullish signal, with fresh gains now looking for close above weekly Tenkan-sen (111.80) and Fibo barrier at 112.14, to signal extension towards widening daily cloud (spanned between 112.30/112.85).
Daily studies are entering into full bullish setup which supports further advance and ignoring so far strongly overbought conditions of slow stochastic.
Broken weekly Tenkan-sen marks initial support with weekly cloud top (111.36) expected to ideally contain dips.
Res: 112.18, 112.30, 112.67, 112.85
Sup: 111.80, 111.36, 111.19, 110.85
Technical Outlook: Cable Risks Deeper Pullback On Break Below Tenkan-Sen Support
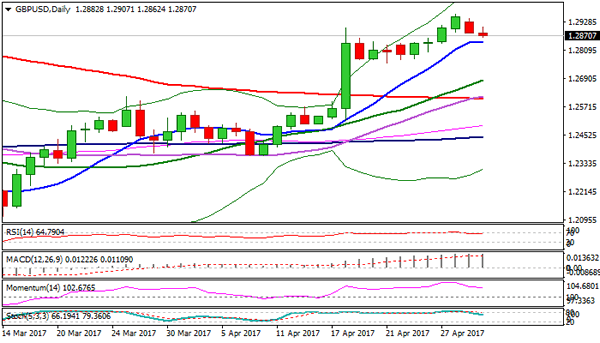
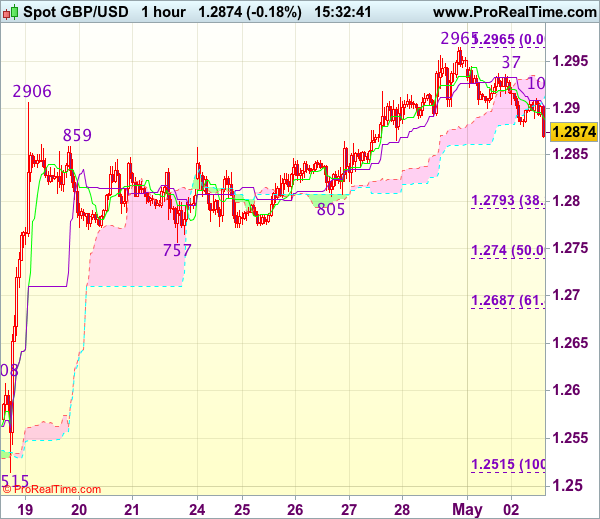
Cable extends pullback from 1.2963 peak after Monday's close in red and pressures first strong support at 1.2859 (daily Tenkan-sen).
Reversal of daily RSI and slow stochastic from overbought territory suggests deeper correction.
Break below Tenkan-sen support would trigger extension towards 1.2800 (4-hr cloud top / near Fibo 38.2% of 1.2513/1.2963), with former consolidation lows at 1.2770/55, expected to ideally contain pullback and larger bulls in play for renewed attempt towards 1.3000 target.
Extension below 1.2700 (4-hr cloud base) would generate stronger bearish signal.
Res: 1.2907, 1.2943, 1.2963, 1.3000
Sup: 1.2859, 1.2821, 1.2800, 1.2755
Trade Idea : GBP/USD – Buy at 1.2855
GBP/USD - 1.2877
Most recent candlesticks pattern : N/A
Trend : Near term up
Tenkan-Sen level : 1.2887
Kijun-Sen level : 1.2901
Ichimoku cloud top : 1.2925
Ichimoku cloud bottom : 1.2914
Original strategy :
Buy at 1.2855, Target: 1.2975, Stop: 1.2820
Position : -
Target : -
Stop : -
New strategy :
Buy at 1.2790, Target: 1.2910, Stop: 1.2755
Position : -
Target : -
Stop : -
As cable has finally retreated after rising to 1.2965 late last week, suggesting consolidation below this level would take place and initial downside risk is seen for correction to 1.2840-45, then towards support at 1.2805, however, reckon downside would be limited to 1.2790-95 (38.2% Fibonacci retracement of 1.2515-1.2965) and bring rebound later. Above 1.2910 resistance would bring test of 1.2937 but break there is needed to signal the pullback from 1.2965 has ended, bring retest of this level first, then towards 1.2990-00 (1.236 times projection of 1.2109-1.2616 measuring from 1.2365 and psychological resistance).
In view of this, would not chase this rise here and would be prudent to buy cable on further subsequent pullback as downside should be limited to 1.2790-95. A drop below previous support at 1.2757 would abort and signal top is formed instead, bring correction to 1.2740 (50% Fibonacci retracement of 1.2515-1.2965) first.
RBA Stands Pat, Appears Slightly More Upbeat
The RBA remained on hold today, as was widely anticipated. The statement accompanying the decision was neutral overall, and very similar to the previous one. The most noteworthy change related to the Bank's view of the labor market. Policymakers acknowledged the latest recovery in jobs, indicating that labor indicators 'remain mixed', which is an upgrade from the previous statement that they had 'softened recently'. Perhaps due to this slightly more upbeat language, AUD gained somewhat after the decision.
However, we think that the short-term outlook of the Aussie remains cautiously negative. We would like to see consistent improvement in the nation's economic data before we assume any change in the currency's outlook.
AUD/USD had been drifting higher ahead of the meeting and got another boost on the announcement. Nevertheless, the advance was stopped by the downside resistance line taken from the peak of the 30th of March. This is in line with our view that the short-term outlook remains somewhat negative and that we would treat any rebound on the RBA as a corrective move. We believe that the bears may take advantage of the rate's proximity to the aforementioned downside line and perhaps push the pair down for another test near 0.7520 (S1). A dip below that barrier could confirm that the correction is over and that we are back in the direction of the prevailing downtrend. Such a dip may initially aim for our next support of 0.7490 (S2).
We continue to expect the RBA to remain on hold in the foreseeable future, absent any shock. Having said that, we think that the risks surrounding the Bank's language are likely asymmetrical. We believe that in case of a deterioration in the data then the RBA will probably shift back to a dovish stance, but in case of progress the Bank is unlikely to sound hawkish, on concerns it may trigger a speculative rally in AUD.
Today is a PMI day:
During the European day, the most noteworthy economic indicator we get will probably be the UK manufacturing PMI for April. The forecast is for the index to have declined somewhat. Coming on top of the slowdown in GDP for Q1, a decline in the manufacturing index could generate speculation that this softness in economic activity may have rolled over into Q2, and may thereby reverse some of the pound's recent gains. Having said that, we think that the currency's near-term direction will be primarily decided by opinion polls and developments regarding the upcoming election, instead of economic data, at least until the political landscape clears out somewhat.
GBP/JPY has been trading in a steep uptrend since the 17th of April. Nevertheless, the rate now consolidates slightly below the key resistance zone of 144.75 (R1), defined by the peak of the 27th of January. Given that the uptrend looks very steep and that there is negative divergence between our short-term momentum indicators and the price action, we see the likelihood for a corrective setback before the bulls decide to take action again. A dip below 144.00 (S1) on a potential decline in the PMI today may confirm that and could open the way for an initial test near 143.30 (S2).
We also get manufacturing PMIs for April from both Sweden and Norway.
What's more, we will get the final manufacturing indices for the month from several European countries and the Eurozone as a whole, but the final figures are usually not major market movers. The bloc's unemployment rate for March is also due out and the forecast is for a decline. Even though this is usually not a major market mover either, it could be another piece of data entering the basket of those supporting a more optimistic stance by the ECB at one of the upcoming meetings.
AUD/USD
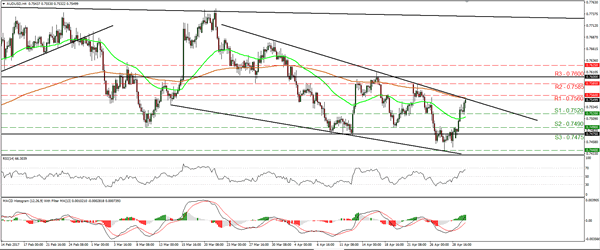
Support: 0.7520 (S1), 0.7490 (S2), 0.7475 (S3)
Resistance: 0.7560 (R1), 0.7585 (R2), 0.7600 (R3)
GBP/JPY
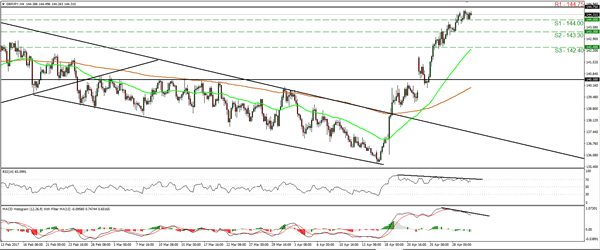
Support: 144.00 (S1), 143.30 (S2), 142.40 (S3)
Resistance: 144.75 (R1), 145.40 (R2), 146.25 (R3)
Trade Idea : EUR/USD – Stand aside
EUR/USD - 1.0913
Most recent candlesticks pattern : N/A
Trend : Near term up
Tenkan-Sen level : 1.0915
Kijun-Sen level : 1.0905
Ichimoku cloud top : 1.0901
Ichimoku cloud bottom : 1.0900
New strategy :
Stand aside
Position : -
Target : -
Stop : -
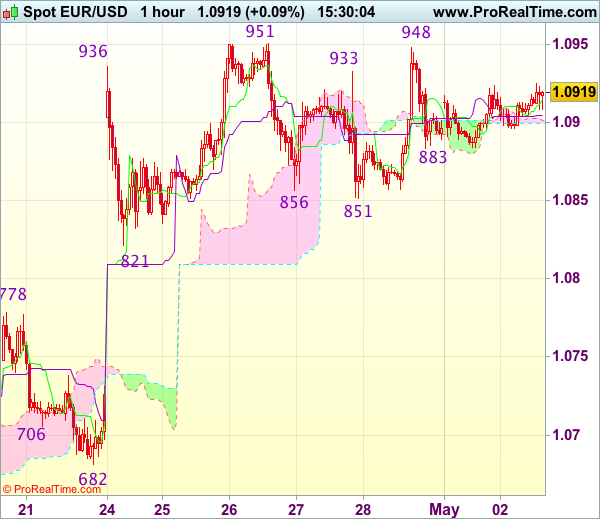
Although the single currency rose to as high as 1.0948 late last week, the subsequent retreat after faltering below last week’s high at 1.0951 has retained our view that further consolidation below this level would be seen and test of support at 1.0883 cannot be ruled out, however, reckon downside would be limited to support at 1.0851 and price should stay above 1.0821 support, bring another rise later.
On the upside, above said resistance at 1.0948-51 would revive bullishness and signal recent upmove from 1.0340 low has resumed for headway to 1.0975-80 and possibly towards 1.1000 which is likely to hold on first testing due to loss of momentum. As near term outlook is still mixed, would be prudent to stand aside in the meantime.