Sample Category Title
USD/JPY Analysis: To Climb Over 112.00
'Dollar/yen is holding up, despite the weaker U.S. GDP.' – Mizuho Securities (based on Reuters)
Pair's Outlook
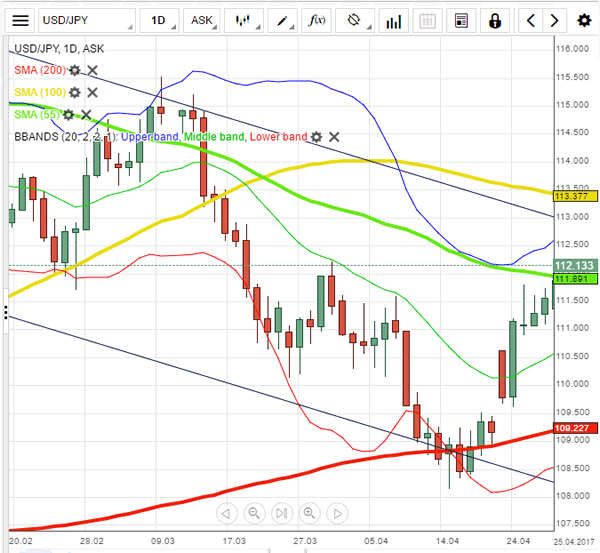
Although the immediate resistance was not pierced yesterday, the USD/JPY currency pair still took a large step towards reaching the descending channel's upper boundary. Yesterday's rally was limited by the 55-day SMA, but the Buck is expected to disregard this resistance today and, thus, easily reclaim the 112.00 major level. Such a bullish development would leave the US Dollar with just one other supply area on its path, formed by the weekly R1 and the upper Bollinger band circa 112.40. Once this zone is overcome, the given pair could reconfirm the channel's down-trend; however, a breakout from the pattern is unlikely, due to a number of other levels bolstering the trend-line.
Traders' Sentiment
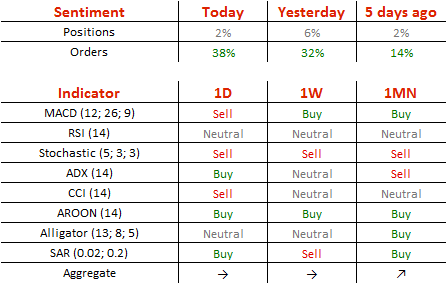
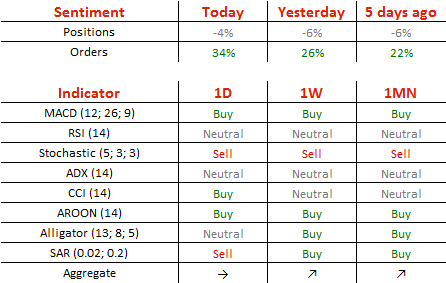
Today 51% of all open positions are long (previously 53%), whereas 69% of all pending orders are to purchase the Greenback.
EUR/USD Elliott Wave Analysis
EUR/USD – 1.0915
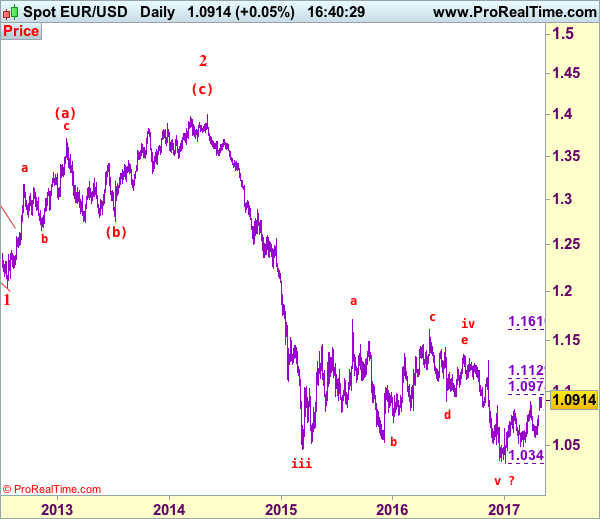
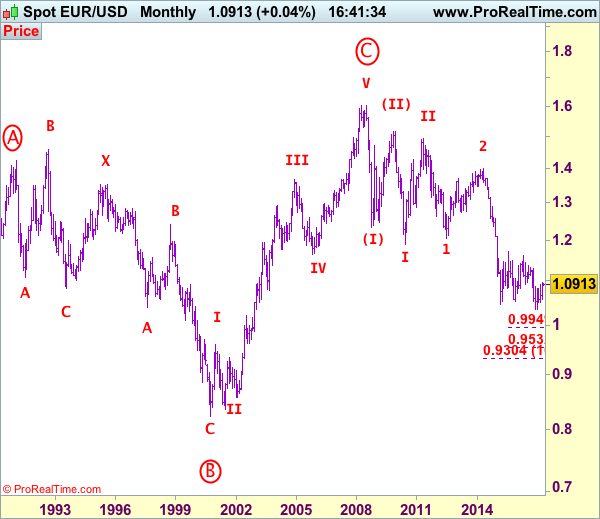
EUR/USD: Wave (c) of 2 ended at 1.3993 and wave 3 of III has commenced for weakness to 1.0411 (1.236 of wave 1), then 1.0000.
As the single currency has maintained a firm undertone after last week’s gap-up opening and previous resistance at 1.0906 was penetrated, adding credence to our view that the erratic rise from 1.0340 (tentatively wave v of larger defer wave 3) low is still in progress, hence bullishness remains for this move to extend further gain to 1.1000, above there would encourage for subsequent rise to 1.1050, however, reckon upside would be limited to 1.1125-30 (61.8% Fibonacci retracement of 1.1616-1.0340) and price should falter well below strong resistance at 1.1300, bring retreat later.
Our preferred count on the daily chart remains that a wave (II) from 1.2329 ended at 1.5145 with A-leg ended at 1.4720, followed by wave B at 1.2457, the wave C from there was also a 3 legged move and is labeled as (a): 1.3739, (b): 1.2885, the wave iii of the 5-waver (c) from 1.2885 has ended at 1.4339 and wave iv is a triangle ended at 1.3878 and wave v formed a top at 1.5145. The decline from there is a 5-waver (C) with minor wave (i) of I of (C) ended at 1.4218 with wave (ii) ended at 1.4580, wave (iii) ended at 1.3267 and wave (iv) ended at 1.3692 and wave (v) ended at 1.1876, this is also the low of wave I of (C) and wave II ended at 1.4940, hence wave III is now in progress with a diagonal wave 1 ended at 1.2042, the breach of previous support at 1.1876 (wave I trough) adds credence to our view that the wave 2 has ended at 1.3993, wave 3 has commenced for further weakness to 1.0411, then towards 1.0000.
On the downside, althopugh pullback to 1.0830-35 cannot be ruled out, reckon previous resistance at 1.0778 would turn into support and contain euro’s downside, bring another rise later. Below 1.0735-40 would defer and risk test of support at 1.0678-82 but only a drop below there would suggest top is formed instead, bring weakness to 1.0635-40, then 1.0602 support. Looking ahead, only a daily close below 1.002 would provide confirmation and revive bearishness for test of 1.0570 support first.
Recommendation: Buy at 1.0780 for 1.0980 with stop below 1.0680.
Euro's long-term uptrend started from 0.8228 (26 Oct 2000) with an impulsive structure. The rise from 0.8228 to 0.9593 (5 Jan 2001) is labeled as wave I, the retreat to 0.8352 (6 Jul 2001) is wave II and the rally to 1.3670 (31 Dec 2004) is wave III. Wave IV from there ended at 1.1640 (15 Nov 2005), the subsequent upmove to 1.6040 (July 15, 2008) is treated as wave V, the major selloff from the record high of 1.6040 to 1.2329 (October 27, 2008) signals a reversal has taken place with (I) leg ended at 1.2329 and once (II) ended at 1.5145, wave (III) itself is an extended move with I: 1.1876 and complex wave II ended at 1.4902, wave III has commenced with wave 1 and 2 ended at 1.2042 and 1.3993 respectively, wave 3 of III is now unfolding for weakness towards parity.
Gold Analysis: Approaches 1,250 Mark
'The geopolitical concerns are receding but there are still chances of them coming back again.' – Richard Xu, HuaAn Gold (based on Reuters)
Pair's Outlook
The yellow metal continued on its path lower on Tuesday morning, as the metal's price was about to reach a strong support cluster near the 1,250 mark. The support cluster is most likely going to pause the decline of the bullion's price. The cluster is made up of the 55 and 200-day SMAs together with the weekly S2 and the 50.00% Fibonacci retracement level. If the metal rebounds it would most likely surge up to the weekly S1, which is located at the 1,260.48 level. On the other hand the upcoming last round of French election can still cause fundamental shifts.
Traders' Sentiment
Traders remain bearish on the metal, as 52% of open positions are short on Tuesday. However, 67% of set up orders are to buy.
Technical Outlook: Spot Gold Pressures 200SMA Support And May Extend Pullback Towards $1240
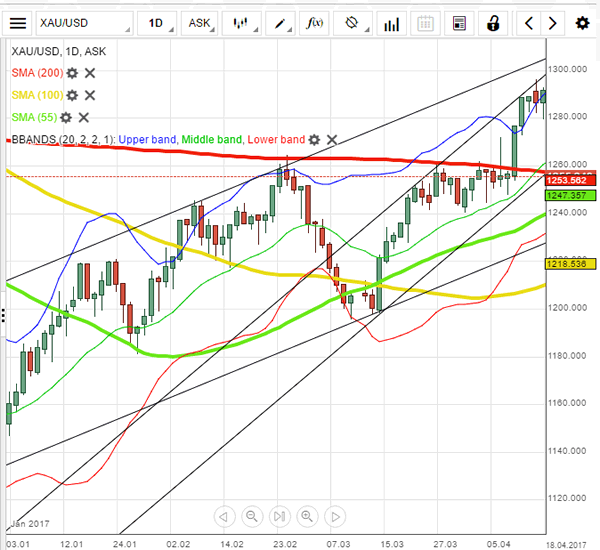
Spot Gold is holding near fresh three-week low at $1253, posted after Monday’s strong fall, driven by stronger dollar that eventually broke below near-term $1260/$1270 congestion, signaling extension of pullback from $1295 (17 Apr high).
Fresh bears broke below pivot at $1258 (Fibo 38.2% of $1197/$1295) and now pressuring another strong support at $1252 (200SMA).
Close below $1253/52 pivots is needed to signal further downside which may extend through rising 55SMA towards targets at $1240/36 (bull-trendline connecting $1122/97 lows / daily cloud top).
The price may hold in near-term consolidation above 200SMA on oversold daily slow stochastic, with former congestion floor at $1260 offering solid resistance and extended upticks to stay capped under 10/20SMA bear-cross that is forming at $1269.
Res: 1260, 1264, 1269, 1271
Sup: 1252, 1247, 1240, 1236
USD/JPY Elliott Wave Analysis
USD/JPY - 112.10
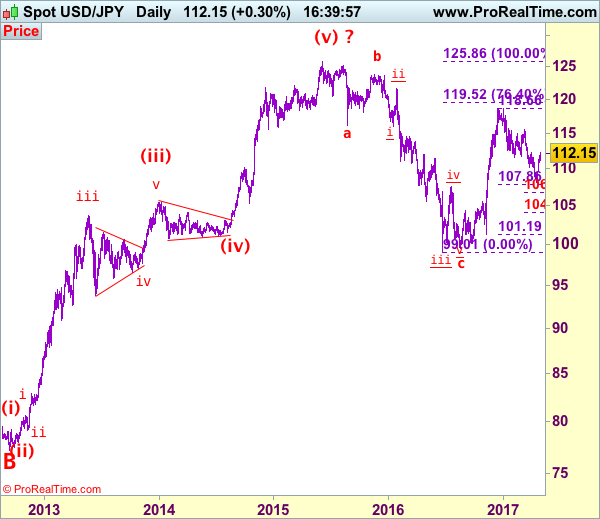
USD/JPY – Wave V of larger degree circle V has possibly ended at 75.31 and major correction has commenced and already met indicated target at 125.00.
As the greenback has continued moving higher after last week’s gap-up opening, suggesting a low has been formed at 108.13 earlier and consolidation with mild upside bias is seen for the rebound from there to extend further gain to 113.00, however, a daily close above dynamic resistance at 113.35-40 (50% Fibonacci retracement of 118.66-108.13) is needed to retain bullishness and suggest the entire fall from 118.66 has ended at 108.13, then further gain to 114.00 and possibly 114.60-65 (61.8% Fibonacci retracement) cannot be ruled out but price should falter below key resistance at 115.15, bring retreat later.
Our preferred count is that, triangle wave IV (with circle) ended at 101.45 and the circle wave V brought dollar down to the record low of 75.31 in 2011 and the subsequent rebound signal major correction has commenced with A leg ended at 84.19, followed by wave B at 77.14 and impulsive wave C is now unfolding (indicated upside target at 125.00 had been met) for gain towards 127.00 level. In the event dollar drops below support at 99.01, this would confirm medium term decline from 125.86 top (2015 high) has resumed for subsequent weakness to 98.00 and possibly 97.00.
Under this count, this wave C is unfolding as impulsive waves with (1) (2), 1 2 ended at 80.67, 79.07, 82.84 and 81.69 respectively, hence the extended wave 3 has ended at 103.74 and wave 4 correction of recent upmove should bring weakness to 92.57, then towards 90.88 but psychological support at 90.00 should limit downside and bring another rally later in wave 5, indicated target at 125.00 had been met and gain to 127.00 cannot be ruled out but reckon price would falter below 130.00.
On the downside, whilst initial pullback to 111.50-60 cannot be ruled out, reckon downside would be limited to 111.00-10 and bring another rise later. Below previous resistance at 110.60 (now support) would defer and suggest the rebound from 108.13 has possibly ended, bring weakness to 110.00, however, still reckon downside would be limited to 109.55-60 and price should stay well above said recent low at 108.13, bring another rebound later.
Recommendation: Buy at 111.10 for 113.10 with stop below 110.10.
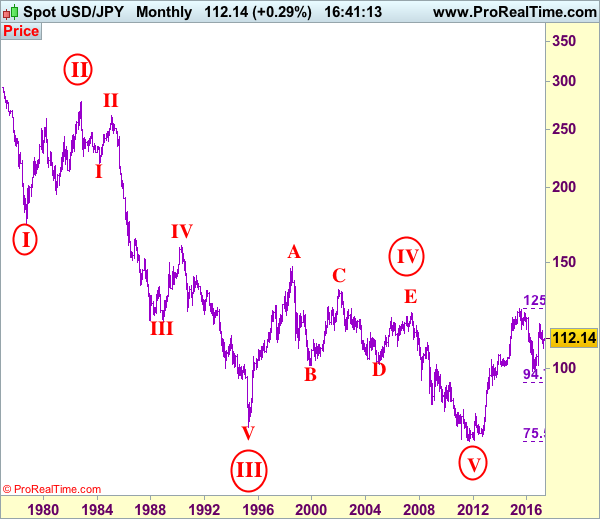
On the monthly chart, we have changed our preferred count that an impulsive wave is unfolding with major wave III with circle ended at 79.75, then followed by wave IV with circle and is labeled as a triangle with A: 147.64 (11 August, 1998), B: 101.25, C: 135.20, D: 101.67 and E leg ended at 124.14 to end the wave IV with circle. Hence, wave V with circle commenced from there and hit a record low of 75.31, however, the subsequent strong rebound signals this circle wave V has possibly ended there, hence gain to (indicated upside target at 122.00 and 125.00 had been met), the retreat from 125.86 suggests wave A of major correction has ended there and wave B correction back to 99.00, then 95.00 would be seen, however, reckon downside would be limited to 90.00, bring another rebound in wave C next year.
Will Eurozone Q1 GDP Show A Healthy Recovery ?
The UK and the Eurozone Markit Manufacturing PMI for April will be released today at 09:30 BST. German Unemployment rate and Unemployment change for April will be released at 08:55 BST Wednesday May 3. It will be followed by the Eurozone Q1 GDP initial readings (YoY and QoQ) at 10:00 BST.
The German unemployment rate saw a notable downtrend since early 2014. The reading in March was 5.8% hitting a record low. Eurozone GDP readings (YoY and QoQ) have been oscillating steadily in a range between 1.5%-1.7% and 0.3%-0.6% respectively since September and February 2015. The market is expecting the upcoming Q1 GDP to show 1.7% yearly and 0.5% quarterly expansion.
ECB Governor Draghi stated last Thursday that “the Eurozone economic recovery is becoming increasingly solid, and the downside risks have further diminished”. However, inflation has not yet seen a convincing upward trend.
Recent underperforming US economic data has provided support to EUR/USD; holding above the psychological level at 1.0900. If the upcoming German labour market data and the Eurozone Q1 GDP outperforms, then we can expect continuing strengthening of EUR, and a rise in European equity markets.
The FOMC meeting will be held on Wednesday May 3. Markets expect the Fed to raise rates in June instead of May. Nevertheless, we might get further clues about the probability of a rate hike in June from Fed Chair Yellen's tone of her speech. The recent weak US economic data might make Yellen's speech less hawkish. Per the CME's FedWach tool, the probability for a rate hike in June is 67.4%.
The dollar index saw a rebound and attempted to recover the psychological level at 99.00, after hitting a 1-month low of 98.55 on April 25. It was helped by the US Congress' agreement on a $1 trillion budget deal to maintain the operation of the US federal government until 30 September.
Trump has proposed cuts on several science budgets aiming to reduce the US government's financial stress. The cuts in budgets include the Environmental Protection Agency (EPA), the National Institutes of Health (NIH) and the National Science Foundation (NSF). However, Congress has already rejected the NIH budget cut.
Trump has been trying to finance his tax reform bill in several ways; such as replacing Obamacare and cutting the science budget. Unfortunately, both attempts have failed. There seems to be plenty of hurdles in Trump's administration. The prospect of the US government's financial condition still remains less than optimistic.
Technical Outlook: AUDUSD – Extended Recovery Needs Firm Break Above 200SMA To Signal Reversal
The Aussie cracked 200SMA barrier on Tuesday's recovery extension to 0.7554, following strong rally on Monday (the biggest one-day gains since 15 Mar).
However, the pair was so far unable to hold gains, as the price returned to 100SMA (0.7524), after yesterday's rally closed just below it.
Failure to clearly break 100 and 200SMA barriers would signal recovery stall and risk fresh downside, as daily studies are overall bearish.
Conversely, reversal signal will be generated on sustained break above 200SMA, where the upper boundary of falling wedge also lies.
Res: 0.7510, 0.7549, 0.7558, 0.7582
Sup: 0.7524, 0.7513, 0.7482, 0.7464
Trade Idea: EUR/JPY – Buy at 120.65
EUR/JPY - 122.36
Recent wave: wave v of (C) ended at 94.12 and major correction in wave A has ended at 149.79
Trend: Near term up
Original strategy:
Buy at 120.20, Target: 122.20, Stop: 119.60
Position: -
Target: -
Stop: -
New strategy :
Buy at 120.65, Target: 122.85, Stop: 120.05
Position: -
Target: -
Stop:-
Although the single currency has surged again after brief pullback and broke above previous resistance at 122.01 and near term upside bias remains for further gain to 122.55-60, loss of upward momentum should prevent sharp move beyond previous resistance at 122.89 (b leg top) and price should falter below 123.50-60, risk from there has increased for a retreat to take place later this week.
In view of this, would not chase this rise here and would be prudent to buy euro on subsequent pullback as 120.60-65 should limit downside. Below 120.25-30 would defer and suggest top is possibly formed, risk weakness to 120.00, then 119.45-50 but reckon support at 118.92 would contain downside and euro may stage another rally from there.
Our latest preferred count is that wave (ii) is ABC-X-ABC which ended at 123.33 and wave (iii) is unfolding with wave iii ended at 100.77, followed by wave iv at 111.57 and wave v as well as the wave (iii) has ended at 97.04, followed by wave (iv) at 111.43 and wave (v) has ended at 94.12 which is also the end of the larger degree v, this also implied the major wave (C) has also ended there, hence major correction has commenced from there with (A) leg unfolding in its lower degree wave c which has possibly ended at 145.69. Under this count, A-B-C wave (B) has commenced with A leg ended at 136.23, wave B at 143.79 and wave C has possibly ended at 149.79.
Our larger degree count is that the decline from 139.26 is wave (C) and is sub-divided into a diagonal triangle i-ii-iii-iv-v with wave i - 105.44, wave ii- 123.33, wave iii - 97.03, wave iv - 111.43, followed by the final wave v as well as the end of wave (C) at 94.12, this also mark the bottom of larger degree wave B. Under this count, major rise in wave C has commenced as an impulsive wave with minor wave III ended at 145.69, wave V is still in progress for further gain to 150.00. Having said that, this so-called wave V could well be the first leg of larger degree 5-waver wave C and this wave C should bring at least a retest of wave A top at 169.97 (July 2008).

Trade Idea: AUD/USD – Stand aside
AUD/USD – 0.7530
Recent wave: Wave 5 ended at 1.1081 and major correction has commenced for fall to 0.7000 and then towards 0.6500-10
Trend: Near term down
New strategy :
Stand aside
Position: -
Target: -
Stop:-
Although aussie extended recent decline to as low as 0.7440 last week, lack of follow through selling and the subsequent rebound to 0.7556 suggest low has possibly been formed there and consolidation with mild upside bias is seen, break of said resistance would extend gain to resistance at 0.7592 but a sustained breach above this level is needed to add credence to this view, bring further subsequent rise to 0.7611.
In view of this, would not chase this rise here and would be prudent to stand aside in the meantime. Only below 0.7490-95 would suggest top is possibly formed, bring weakness to 0.7465-70 but break of said support at 0.7440 is needed to signal recent decline has once again resumed and extend fall to 0.7390-00 first.
On the 4-hour chart, the move from 0.8066 is the wave 5 with i: 0.8860, ii: 0.8315, wave iii is an extended move ended at 1.0183, iv: 0.9706 and wave v has ended at 1.1081 (also the top of entire wave 5). The subsequent selloff is the major correction which is unfolding as ABC-X-ABC and 2nd A leg has ended at 0.8848, followed by a-b-c wave B which ended at 0.9758, hence, 2nd C wave is now in progress and indicated downside target at 0.7000 and 0.6950 had been met, so further fall to 0.6710-20 cannot be ruled out.

USDJPY Trading In Final Stages Of An Impulse, A Reversal May Be Expected
USDJPY is trading higher, but pair is seen in 5th wave of a five wave rally so upside can be limited. Technically we expect a three wave set-back this week, which can be confirmed once market falls below the channel support at 111.40 area. Divergence on the RSI also suggests that upside can be limited.
USDJPY, 1H