Sample Category Title
Elliott Wave View: EURJPY Further Downside
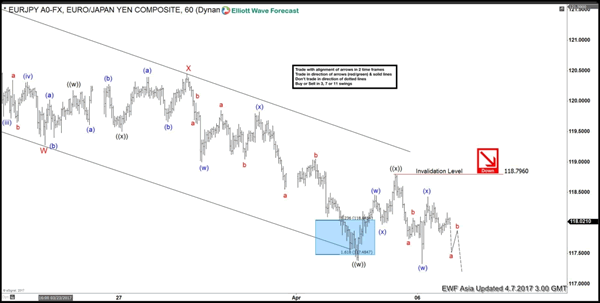
Short term Elliott Wave view in EURJPY suggests that cycle from 3/12 peak (122.89) is unfolding as a double three Elliott wave structure where Minor wave W ended at 119.28 and Minor wave X ended at 120.45. Minor wave Y is in progress and the internal is unfolding also as a double three Elliott wave structure where Minute wave ((w)) ended at 117.38 and Minute wave ((x)) bounce is proposed complete at 118.79. Pair has resumed the decline lower and the decline is unfolding as a zigzag Elliott wave structure where Subminutte wave a ended at 117.33 and Subminutte wave b ended at 118.43. Near term, while bounces stay below 118.79, but more importantly below 120.45, expect pair to extend lower. We don’t like buying the proposed bounce.
EURJPY 1 Hour Elliott Wave Chart
GBP/JPY Daily Outlook
Daily Pivots: (S1) 137.67; (P) 138.19; (R1) 138.67; More...
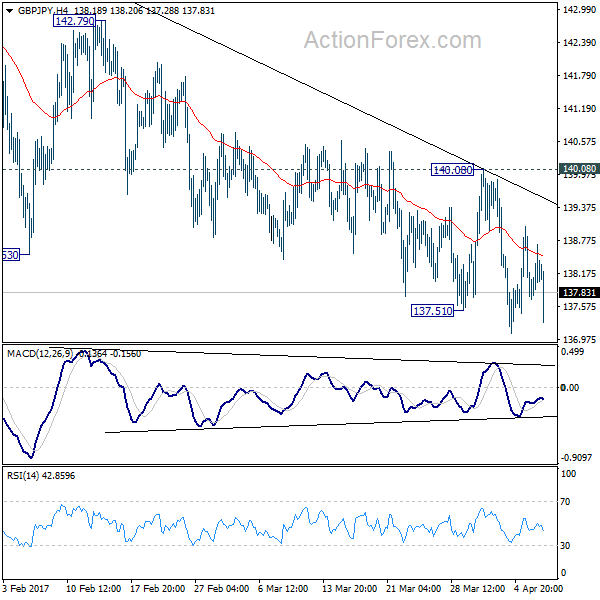
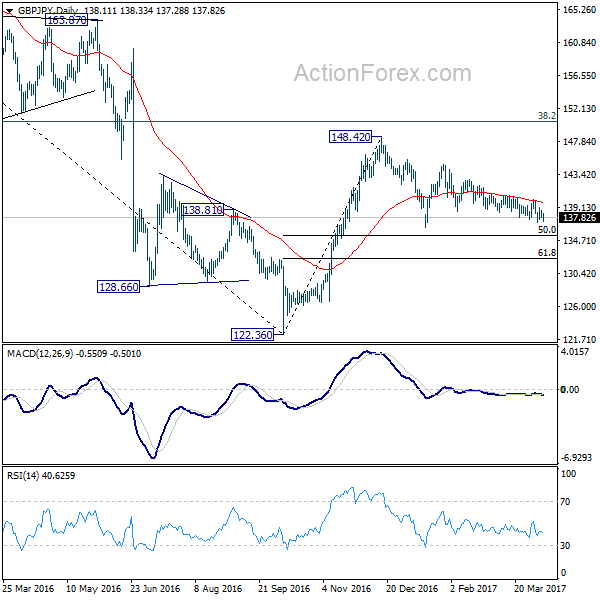
With 140.08 resistance intact, deeper decline is expected in GBP/JPY. Choppy fall from 144.77 would target medium term fibonacci level at 135.39. Overall, price action from 148.42 are seen as a consolidation pattern. We'll look for bottoming around 135.39. Meanwhile, break of 140.08 resistance is needed to indicate short term reversal. Otherwise, outlook will remain bearish in case of recovery.
In the bigger picture, price actions from 122.36 medium term bottom are still seen as a corrective pattern. Main focus is on 38.2% retracement of 195.86 to 122.36 at 150.42. Rejection from there will turn the cross into medium term sideway pattern. Or, sustained break of 50% retracement of 122.36 to 148.42 at 135.39 will turn outlook bearish for a test on 122.36 low. Though, sustained break of 150.42 will extend the rebound towards 61.8% retracement of 195.86 to 122.36 at 167.78.
EUR/JPY Daily Outlook
Daily Pivots: (S1) 117.38; (P) 117.90; (R1) 118.44; More...
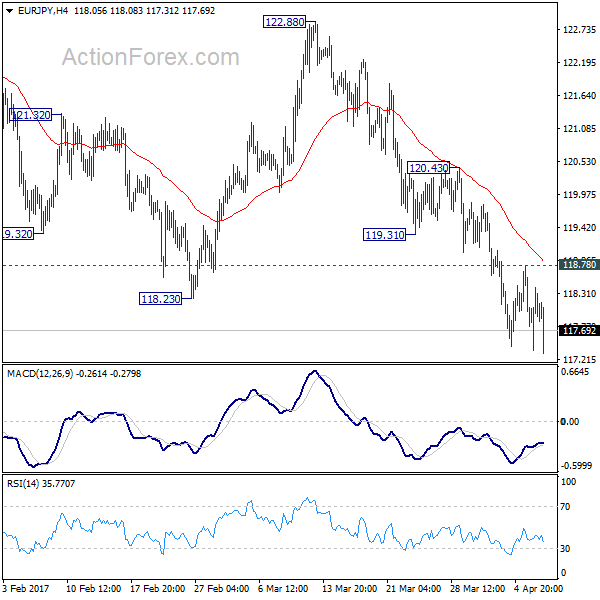
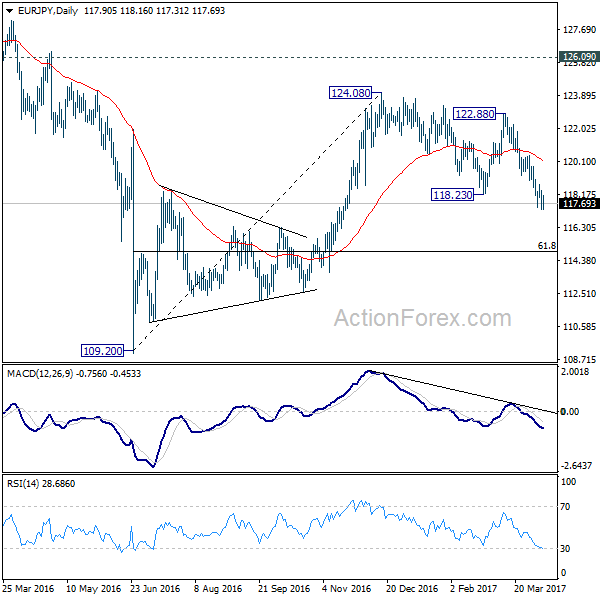
Downside momentum in EUR/JPY is a bit unconvincing with 4 hour MACD staying above signal line. But with 118.78 minor resistance intact, deeper decline is expected. Current development suggests that medium term rise from 109.20 has completed at 124.08 already. Further fall should be seen to 61.8% retracement of 109.20 to 124.08 at 114.88 next. On the upside, above 118.78 will indicate short term bottoming and bring rebound back to 119.31/120.43 resistance zone.
In the bigger picture, the firm break of 38.2% retracement of 109.20 to 124.08 at 118.39 indicates that medium term rise from 109.20 is completed at 124.08. That's well below 126.09 key support turned resistance. Also, EUR/JPY failed to sustain above 55 week EMA. Deeper decline would now be seen back to 109.20 low. Overall, the down trend from 149.76 (2014 high) is not completed yet. Break of 109.20 will resume such down trend towards 94.11 low. In any case, break of 126.09 is needed needed to confirm medium term reversal.
EUR/AUD Daily Outlook
Daily Pivots: (S1) 1.4066; (P) 1.4118; (R1) 1.4156; More...
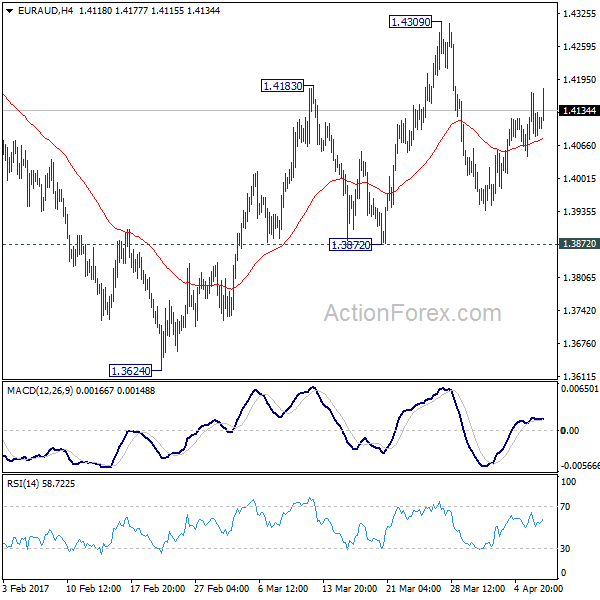
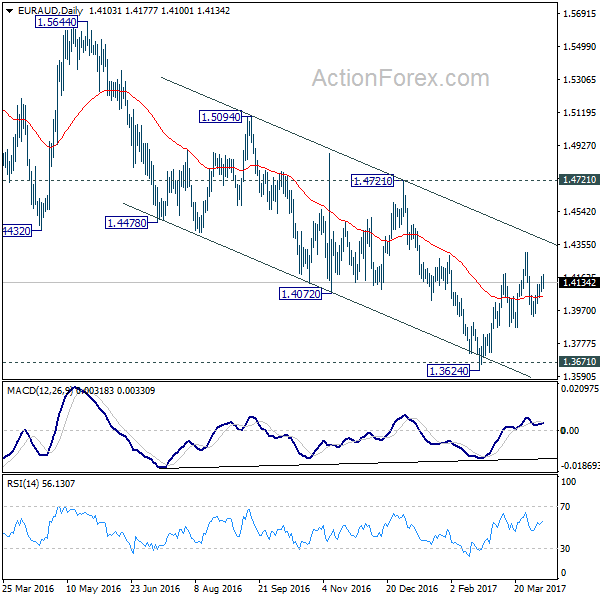
EUR/AUD is staying in range of 1.3872/4309 and intraday bias remains neutral. We're holding on to the view of trend reversal after defending key support level at 1.3671. Another rise is expected as long as 1.3872 minor support holds. Break of 1.4309 will extend the rebound from 1.3624 to 1.4721 key resistance level next. Break should confirm larger trend reversal. However, firm break of 1.3872 support will dampen our bullish view. In such case, intraday bias will be turned back to the downside for 1.3624 low instead.
In the bigger picture, price actions from 1.6587 medium term top are viewed as a corrective pattern. Such correction could be completed after testing 1.3671 support. Break of 1.4721 cluster resistance (38.2% retracement of 1.6587 to 1.3624 at 1.4756) should confirm this case and target 61.8% retracement at 1.5455 and above. Overall, we'd expect the up trend from 1.1602 to resume later. However, sustained break of 1.3671 will invalidate our bullish view and would turn extend the fall from 1.6587 towards 1.1602 long term bottom.
EUR/GBP Daily Outlook
Daily Pivots: (S1) 0.8508; (P) 0.8537; (R1) 0.8564; More...
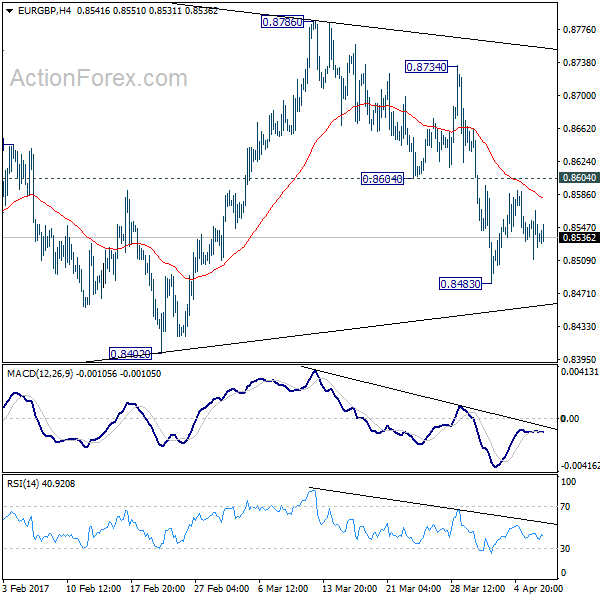
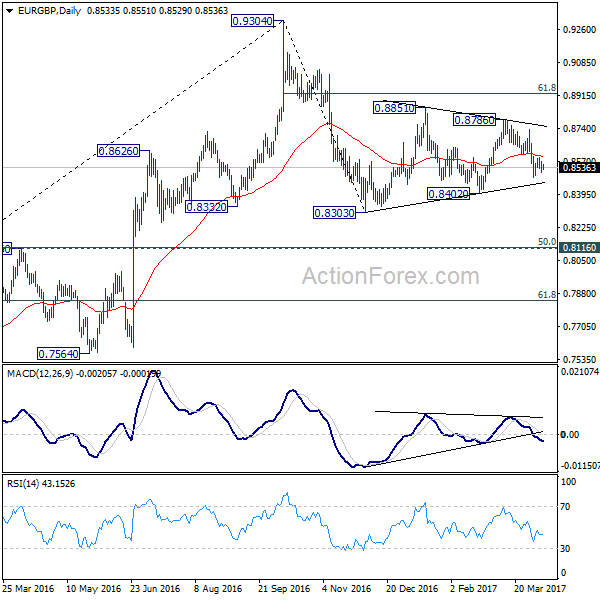
Intraday bias in EUR/GBP remains neutral as it's bounded in tight range between 0.8483/8604. There is no change in the view that price actions from 0.8303 are a consolidation pattern. And, it's the second leg of the correction from 0.9304. Below 0.8430 will target 0.8402. Break of 0.8402 will resume the fall from 0.9304 to 0.8116/20 cluster support, where the correction should end. On the upside, above 0.8604 minor resistance will bring another recovery before fall from 0.9304 resumes.
In the bigger picture, price actions from 0.9304 are viewed as a medium term corrective pattern. Such decline is likely ready to resume and should make a new low below 0.8303. At this point, we'd expect strong support from 0.8116 cluster support (50% retracement of 0.6935 to 0.9304 at 0.8120) to contain downside. Break of 0.9304 will pave the way to 0.9799 (2008 high). However, sustained break of 0.8116 could bring deeper decline to next key support level at 0.7564 before the correction completes.
EUR/CHF Daily Outlook
Daily Pivots: (S1) 1.0693; (P) 1.0709; (R1) 1.0731; More...
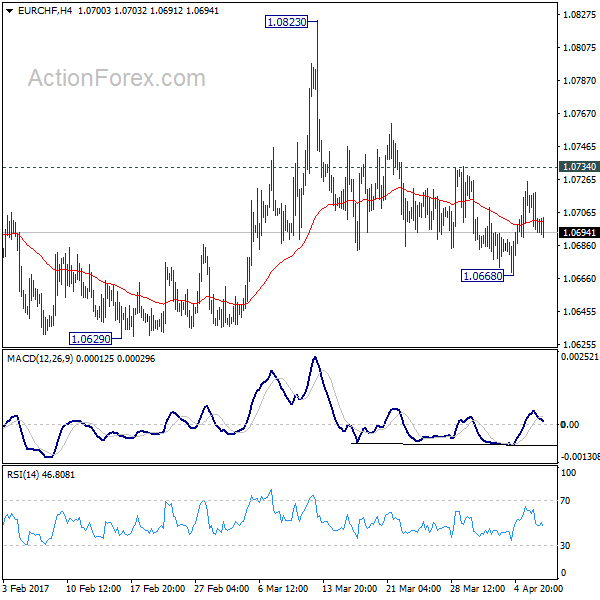
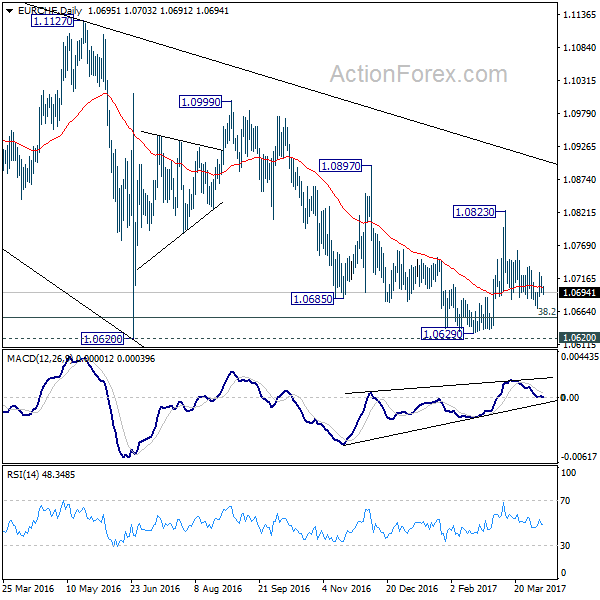
EUR/CHF is staying in range above 1.0668 and intraday bias remains neutral. With 1.0734 minor resistance intact, deeper decline is in favor. Below 1.0668 will target 1.0620/29 key support zone. Decisive break there will resume the larger fall from 1.1198. Nonetheless, break of 1.0734 will turn bias back to the upside for 1.0823 resistance instead.
In the bigger picture, the decline from 1.1198 is seen as a corrective move. Current development suggests that it's not completed yet. sustained trading below 38.2% retracement of 0.9771 to 1.1198 at 1.0653 will target 50% retracement at 1.0485. In any case, break of 1.0823 resistance is needed to be the first indication of reversal. Otherwise, deeper fall is still expected even in case of recovery.
AUD/USD Daily Outlook
Daily Pivots: (S1) 0.7525; (P) 0.7551; (R1) 0.7569; More...
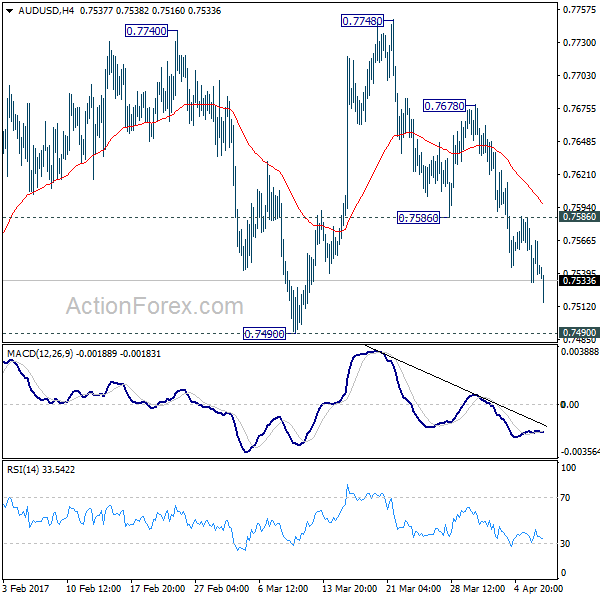
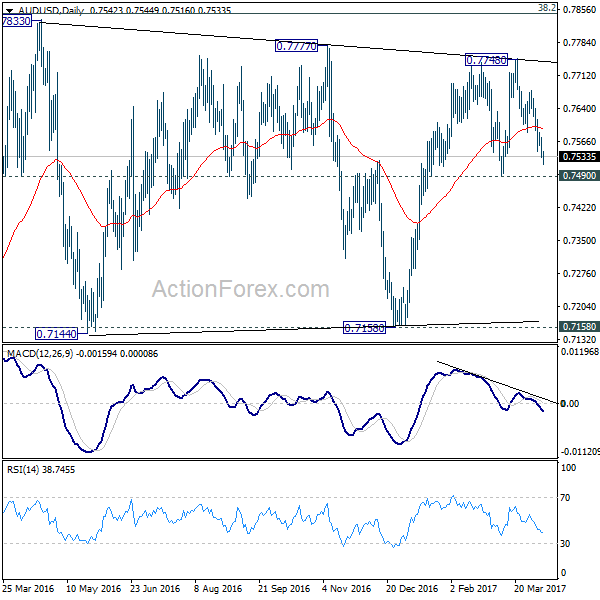
AUD/USD drops to as low as 0.7516 so far today and intraday bias remains on the downside for 0.7490 support. Decisive break of 0.7490 will confirm completion of rise from 0.7158. In such case, near term outlook will be turned bearish for 0.7158 support. On the upside, above 0.7586 minor resistance will turn bias neutral first. And, break of 0.7678 minor resistance will turn bias back to the upside and could extend the rise fro 0.7158 through 0.7748 resistance.
In the bigger picture, we're still treating price actions from 0.6826 low as a correction. And, as long as 38.2% retracement of 0.9504 to 0.6826 at 0.7849 holds, long term down trend from 1.1079 is expected to resume sooner or later. Break of 0.6826 low will target 0.6008 key support level. However, firm break of 0.7849 will indicate that rise from 0.6826 is developing into a medium term rebound, rather than a sideway pattern. In such case, stronger rise should be seen to 55 month EMA (now at 0.8165) and above.
USD/CAD Daily Outlook
Daily Pivots: (S1) 1.3390; (P) 1.3420; (R1) 1.3442; More....
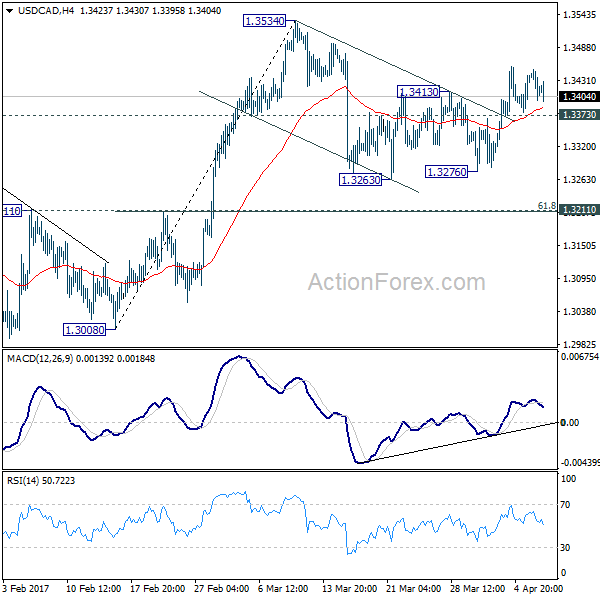
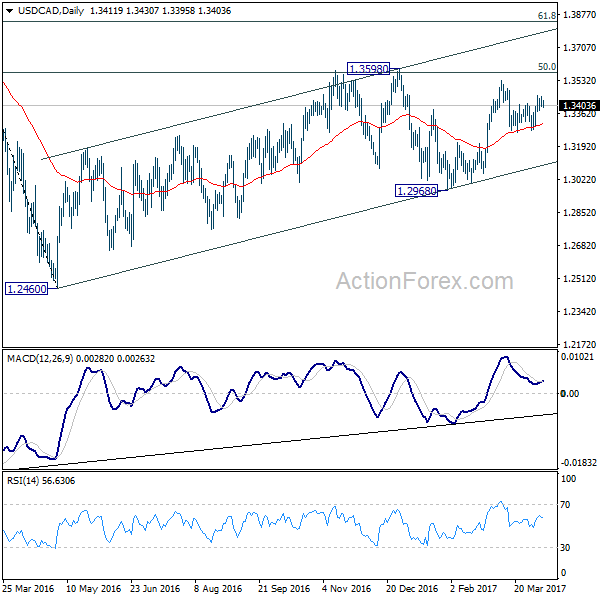
With 1.3373 minor support intact, further rise is mildly in favor in USD/CAD. Break of 1.3534 resistance will extend whole rise from 1.2698 to 1.3598 resistance. On the downside, below 1.3373 minor support will turn bias back to the downside and could extend the correction from 1.3534 with another fall. But we'd expect strong support from 1.3211 cluster level (61.8% retracement of 1.3008 to 1.3534 at 1.3209) to contain downside and bring rebound. Overall, medium term rebound form 1.2460 is still expected to extend through 1.3598.
In the bigger picture, price actions from 1.4689 medium term top are seen as a correction pattern. The first leg has completed at 1.2460. The second leg from 1.2460 is likely still in progress and could target 61.8% retracement of 1.4689 to 1.2460 at 1.3838. We'd look for reversal signal there to start the third leg. Break of 1.2968 will argue that the third leg has already started and should at least bring at retest of 1.2460 low. However, sustained trading above 1.3838 would pave the way to retest 1.4689 high.
EUR/USD Daily Outlook
Daily Pivots: (S1) 1.0619; (P) 1.0652 (R1) 1.0675; More....
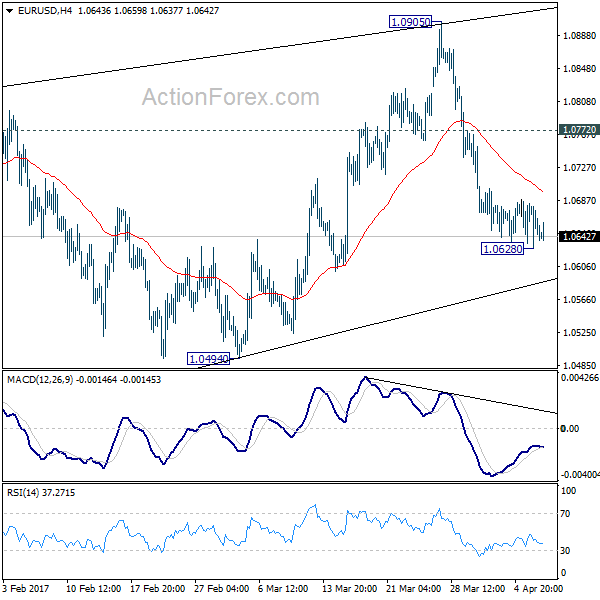
EUR/USD is staying above 1.0628 temporary low and intraday bias remains neutral for the moment. Another recovery cannot be ruled out. But upside should be limited by 1.0772 resistance and bring fall resumption. As noted before, corrective rise from 1.0339 is completed at 1.0905. And more importantly, larger down trend is probably resuming. Below 1.0635 will turn bias back to the downside for 1.0494. Break will confirm this bearish case and target 1.0339 low. However, above 1.0772 will delay this bearish case and bring another rise back to 1.0905 first.
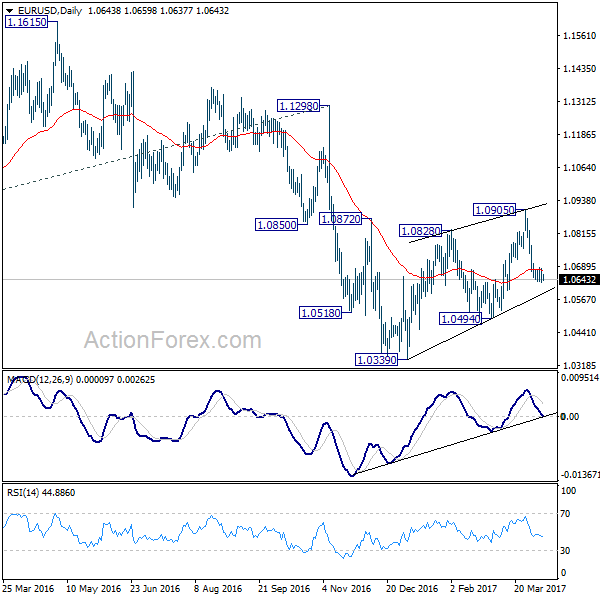
In the bigger picture, as long as 1.1298 key resistance holds, whole down trend from 1.6039 (2008 high) is still expected to continue. Break of 1.0339 low will send EUR/USD through parity to 61.8% projection of 1.3993 to 1.0461 from 1.1298 at 0.9115. However, considering bullish convergence condition in weekly MACD, break of 1.1298 will indicate term reversal. this would also be supported by sustained trading above 55 week EMA.
GBP/USD Daily Outlook
Daily Pivots: (S1) 1.2444; (P) 1.2474; (R1) 1.2499; More...
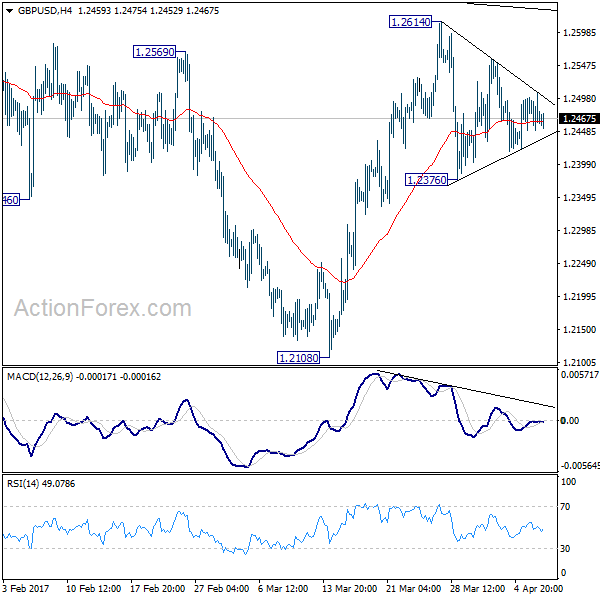
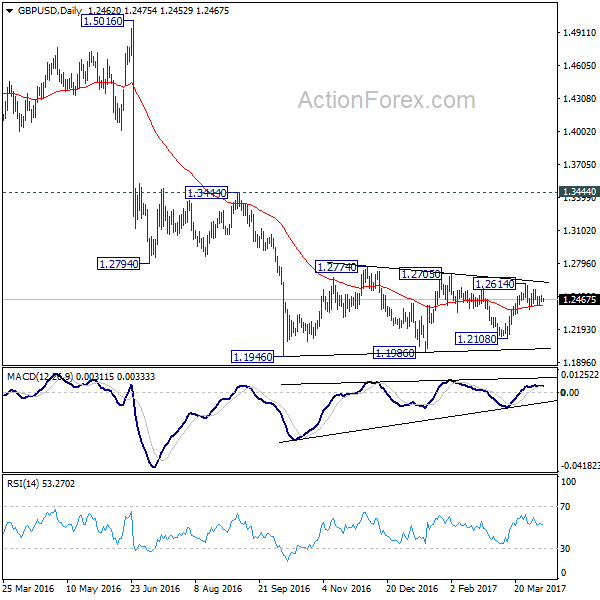
GBP/USD is still stuck in tight range inside 1.2376/2614 and intraday bias remains neutral at this point. Overall outlook is unchanged that price actions from 1.1946 are viewed as a consolidation pattern pattern. On the downside, break of 1.2376 will turn bias to the downside for 1.2108 support. Decisive break there will be an early sign of larger down trend resumption. On the upside, break of 1.2614 will extend the rise from 1.2108. But upside should be limited by 1.2705/2774 resistance zone to bring larger down trend resumption eventually.
In the bigger picture, fall from 1.7190 is seen as part of the down trend from 2.1161. There is no sign of medium term reversal yet. Sustained trading below 61.8% projection of 2.1161 to 1.3503 from 1.7190 at 1.2457 will target 100% projection at 0.9532. Overall, break of 1.3444 resistance is needed to confirm medium term bottoming. Otherwise, outlook will remain bearish.