
Sample Category Title
USD/JPY – Remains Bearish, Weakens Further
USDJPY: The pair declined further as it extended its weakness on Tuesday. On the downside, support comes in at the 110.00 level where a break if seen will aim at the 109.50 level. A cut through here will turn focus to the 109.00 level and possibly lower towards the 108.50 level. On the upside, resistance resides at the 111.00 level. Further out, we envisage a possible move towards the 111.50 level. Further out, resistance resides at the 112.00 level with a turn above here aiming at the 112.50 level. On the whole, USDJPY looks to weaken further.
Dollar Bulls Need A Sign
Tuesday April 4: Five things the markets are talking about
With a number of the Asian market on a bank holiday, the rest of the market seems to be taking stock ahead of Friday's non-farm payroll (NFP) report, tomorrow's FOMC minutes and the small matter of China's President Xi meeting in Florida with the U.S President.
Last week, global stocks completed their best quarter in four-years as Trump's "reflation" trade continues to show resilience for now, supported by stronger global growth. Nonetheless, risks remain from prospects over implementation of the Trump's pro-growth agenda and the path of higher U.S interest rates.
The lack of market-moving news is contributing to the markets unsettling risk-off mood. With U.S auto sales already disappointing yesterday, will the U.S economy face further contempt from this morning's factory orders data? (10:00 am EST)
1. Global stocks on the back foot
Japan's Nikkei share average fell overnight to a ten-week low as the safe-haven yen (¥110.53) rallied and as automakers tumbled on weaker-than-expected U.S sales. The leading benchmark dropped -0.9%, its lowest closing level since Jan. 24. The broader Topix dropped -0.8%.
Elsewhere, China, Hong Kong, Taiwan and India were closed for a holiday. The Philippines benchmark index jumped +1.4% to the highest level in five months, while Indonesian shares rallied +0.7% to extend their record.
In Europe, both the Eurostoxx and the FTSE are in the black in early trading as gains in energy shares offset declines in auto stocks.
U.S stocks are set to open in the red (-0.2%).
Indices: Stoxx50 -0.1% at 3,470, FTSE +0.4% at 7,314, DAX -0.1% at 12,241, CAC-40 flat at 5,086, IBEX-35 +0.1% at 10,337, FTSE MIB -0.2% at 20,193, SMI +0.1% at 8,643, S&P 500 Futures -0.2%
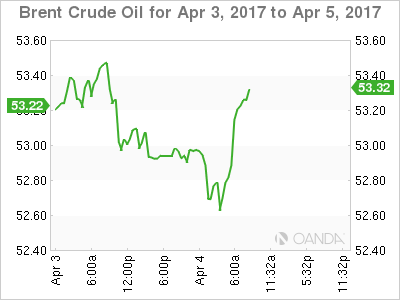
2. Oil prices fall as Libya's output rebound boosts supply, gold higher
Oil prices are on the back foot overnight, pressured by a rebound in Libyan crude production combined with an increase in U.S drilling signalling the potential for increased supply.
Brent crude oil futures are down -20c at +$52.92 a barrel, while light crude oil (WTI) is also -20c lower at +$50.04 a barrel ahead of the U.S open.
Both benchmarks have recovered from last week's four-month lows on expectations that OPEC would manage to tighten supply by cutting production.
Nevertheless, global inventories remain stubbornly high and the market bears continue to bet that it will take months for oil prices to respond convincingly to lower OPEC output.
Note: Libya's crude output has increased after state-owned National Oil Corp (NOC) lifted a force majeure on loadings of Sharara oil. Also, U.S drillers last week added rigs for an eleventh consecutive week.
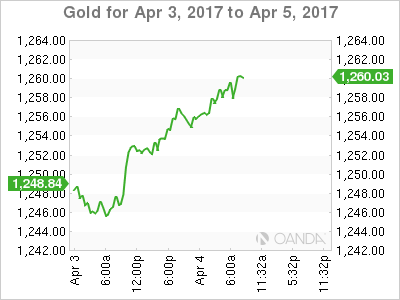
Gold has rallied +0.3% to +$1,256.59, advancing for a third day amid speculation the Fed may go slower on rate hikes after the worse-than-expected U.S auto sales last month.
3. Fed's minutes will influence sentiment on yields
For fixed-income investors, tomorrow's Federal Open Market Committee (FOMC) minutes and Friday's non-farm payrolls report will go a long way to shape the U.S yield curve.
Note: The minutes matter most for what they "do or don't say" about Fed's plan to shrink its balance sheet. The job's report is expected to be softer than recent months on seasonal adjustments - consensus is looking at +177k.
Yesterday's weaker U.S vehicle sales data (16.6m vs. 17.4m) has helped push U.S 10's to trade atop of their lowest level since November (-7 bps to +2.33%), and in doing so, dragged eurozone government bond yields down. German 10-year bund is trading at +0.276%.
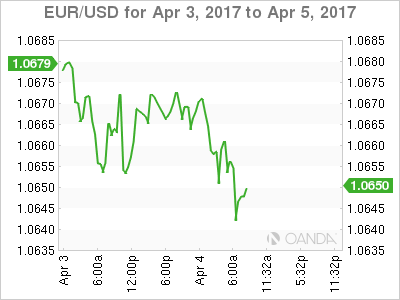
4. Dollar confined to a tight range
With short-term U.S Treasury yields at a five-week low has helped to push USD/JPY below the psychological ¥110.50 overnight. Also providing yen support is the BoJ and government advisors floating the idea of how to move away from yield curve control.
Note: Overnight, BoJ's Kuroda reiterated his 'dovish' stance that it was premature to discuss an exit strategy from the central bank's aggressive easing policy.
The EUR continues to hover in the mid-€1.06 area (€1.0653), while the pound remains under pressure, giving back nearly all of last week's gains, on disappointing domestic data - Monday's U.K PMI data (54.4 from a revised 54.5 in Feb.) was below consensus expectations of 54.6 and the lowest reading for four-months.
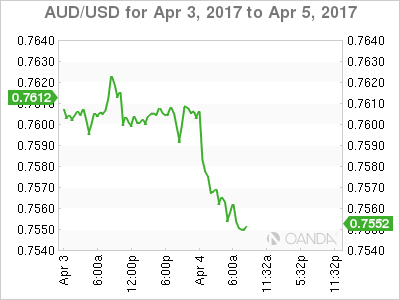
With the Reserve Bank of Australia (RBA) keeping its policy steady with a 'dovish' tilt (see below) has helped push the AUD/USD to print a three-week low below A$0.7560 area.
5. RBA on hold, dovish statement
The Reserve Bank of Australia (RBA) stood pat (+1.5%), but produced a more 'dovish' statement, focusing on wages and their 'hot' housing market, than investors had been anticipating.
To date, Aussie employment had been rather resilient in H2, but last months reading saw the domestic jobless rate jump to a 13-month high with a net change that was negative for the first time in five-months.
In the RBA's communiqué overnight, officials acknowledged that domestic wage growth remains "slow." Another notable change in the statement addressed the Aussie property market, with officials recommending that "lenders ensure the "serviceability metrics that they use are appropriate for current conditions" while also urging reduced reliance on interest-only housing loans.
All in all, the RBA remains wary of risks of accelerating housing correction now that lenders have started to tighten mortgage rates.
Euro Holding Up in Spite of Greek Concerns
- GBP volatile after strong manufacturing data
- Euro holding up in spite of Greek concerns
- Aussie interest rates on hold as trade surplus booms
The Reserve Bank of Australia (RBA) left the Australian interest rates on hold at 1.5% when they met overnight. In an upbeat message the RBA saw global economic expansion, but were cautious about the slightly overheated domestic housing market. I suspect Aussie base rates will stay on hold for quite some time. Australia's trade surplus grew much more than expected to AUD 3.57 billion in February. That is almost double most forecasts and higher valued commodity exports were seen as the main reason. More sustainable growth in Australia's number one export market, China is a key element. The Aussie Dollar was volatile but is largely unchanged from yesterday's close against most other currencies.
Across the Tasman Sea, NZ business confidence slipped last month. A net 16% of businesses expect conditions to improve in the months ahead and that is a sharp drop from the 26% reported in the previous 3 month period. So, whilst the net figure is still in the positive, it is less optimistic than previously and that has weakened the NZ Dollar a little. The GBP-NZD rate still hasn't broken the NZ$1.80 barrier though.
Sterling slipped back from the spike we saw in early trade on Monday in spite of manufacturing data that was four times more positive than forecasters predicted. The lack of data later in the day allowed for profit taking and the lack of UK data today could bring more of the same. However, the service sector Purchasing Managers' Index (PMI) is due tomorrow and we think that should be supportive of the Pound. GBP buyers may seize the opportunity to take advantage during this dip.
The Euro is holding up well in spite of continued concerns over Greece. The funds owed by Greece to the EU have grown by €10 billion in the last two years and now amount to 6% of Greek Gross Domestic Product (GDP). That's unsustainable and the Greek Finance Minister is expected to travel to Brussels today to discuss their plight. Positive manufacturing data from the Eurozone failed to lift the shared currency yesterday.
The US Dollar is bouncing around as the ISM Manufacturing Index showed its 94th consecutive month of growth but was down to the slowest pace of growth in six months. The data was largely in line with expectations but served to remind us that unrelenting good news is not yet the picture in America. The Dollar weakened and then strengthened but may weaken again today because factory orders and durable goods orders (data due for release this afternoon) are likely to be poorer than the previous data.
And this is a momentous day in history. On 4th April in 1581, Sir Francis Drake completed a circumnavigation of the World, in 1918, the Battle of the Somme came to an end, in 1949 NATO came into being and in 1928, Maya Angelou was born. Maya was responsible for one of my favourite quotes, "I've learned that people will forget what you said, people will forget what you did, but people will never forget how you made them feel."
Seen online
"My boyfriend cheated on me, so I convinced him to get matching tattoos. He went first and I went home."
Risk Appetite Wanes ahead of Trump-Xi Summit
Stock markets were vulnerable to downside shocks on Tuesday as investors lost appetite for risk ahead of the Trump-Xi summit this week. Asian shares have already discarded short term gains amid the cautious trading mood with risk aversion exposing European equities to further losses. Although UK's FTSE100 attempted a miraculous rebound during early trading via Sterling weakness, sellers simply exploited the technical bounce to drag prices lower. Wall Street may be in store for further punishment moving forward as risk-off is the name of the game ahead of the meeting between Donald Trump and Chinese President Xi Jinping.,. While the fanatical optimism over Trump's proposed fiscal policies boosting US growth has fueled the phenomenal stock market rally, the rising protectionist fears and concealed concerns over the pro-growth agenda falling short of expectations could catalyze an unexpected selloff.
Flight to safety elevates Gold
The amalgamation of overall geopolitical concerns, political risks in Europe, Brexit woes and Trump uncertainties have boosted the appetite for safe-haven assets with Gold in high demand. This yellow metal has sprung towards $1260 on Tuesday with further inclines expected as bulls exploit the market anxiety to install fresh rounds of buying. The source behind this wave of risk aversion is the uncertainty gravitating around the pending Trump-Xi summit which investors will be paying heavy attention towards. With participants already noticeably jittery, any potential complications in the meeting could accelerate the flight to safety ultimately elevating Gold's price further. The visible fact that Gold remains resilient despite Dollar's resurgence continues to highlight how risk aversion has become a key theme this week.
From a technical standpoint, the yellow metal fulfills the prerequisites of a bullish trend on the daily charts as there have been consistently higher highs and higher lows. A breakout and daily close above $1260 could open a path higher towards $1300. Bulls remain in firm control above the previous higher low at $1240. A situation where bears manage to bring prices back below $1240 simply invalidates this daily bullish setup.
Commodity spotlight - WTI
WTI Crude descended towards $50 on Monday after the rebound in Libya's oil output over the weekend and persistent increase in U.S drilling compounded to the oversupply concerns. The oversupply fears have been a major theme which has ensured oil remains depressed for prolonged periods. With global inventories remaining stubbornly high despite OPEC's valiant efforts to stabilize oil markets and U.S Shales resurgence questioning the effectiveness of the supply cuts, buying sentiment is frighteningly low. Although there are speculations of OPEC extending the supply cut deal by another 6 months to fight the oversupply woes, optimism is rapidly fading over the cartel's ability to elevate oil prices.
WTI Crude may be in the process of a technical bounce which could test the $51 pivotal level. Bears need to break back below $50 to reclaim control with targets stretching back towards $47.
RBA Remains on Hold, But Tilts Somewhat Dovish
The Reserve Bank of Australia remained on hold today, as was widely anticipated. However, the statement had a somewhat dovish tone compared to the previous one, in our view. The Bank indicated that some labor market indicators have softened recently, while it noted that the recently announced supervisory measures with regards to lending could ease financial stability risks.
This suggests to us that once these measures take effect, the Bank would be more flexible to cut rates again if needed, without being concerned that its actions would amplify risks to the economy. Thus, although our base case scenario is still for the RBA to remain on hold in the foreseeable future, further weakness in economic indicators, could encourage officials to act without much hesitation. We believe that the picture will become much clearer on the 26th of April, when we get the nation's CPI data for Q1.
AUD/USD tumbled following the release of the meeting statement, falling below the key support (now turned into resistance) obstacle of 0.7600 (R1). This move confirms a forthcoming lower low on the 4-hour chart and combined with the Bank's dovish language, increases the likelihood for the pair to stay on the back foot for a while. The upcoming meeting between US President Trump and Chinese President Xi Jinping on Thursday could also prove negative for the currency. Any talks of increased protectionism in the global arena could weigh on the currencies of heavily trade-oriented nations, such as AUD and NZD. At the time of writing, the rate is testing the 0.7580 (S1) area, where a decisive dip is possible set the stage for our next support of 0.7550 (S2).
Today's highlights:
During the European day, we get the UK construction PMI for March. The forecast is for the index to have declined, albeit marginally. Nonetheless, following the unexpected tumble in the manufacturing index for the month, we see the risks surrounding the construction forecast as skewed to the downside, perhaps for a greater than expected slide. In such a case, GBP could come under renewed selling pressure. We prefer to exploit further pound weakness against the yen, which continued to strengthen yesterday. GBP/JPY slid and is currently testing the 137.50 (S1) support zone. A disappointing construction PMI today could push the rate below that hurdle and pave the way for the key territory of 137.00 (S2). However, a clear close below that barrier is needed to turn the broader outlook negative as well.
From Eurozone, we get retail sales for February, while from the US, the trade balance and factory orders for the same month are coming out.
We have only one speaker on the schedule: ECB President Mario Draghi. Following the latest media reports that investors over-interpreted the ECB's signals at the March policy meeting, and the subsequent slowdown in the bloc's CPI prints for March, it would be interesting to hear what the ECB chief has to say.
AUD/USD
Support: 0.7580 (S1), 0.7550 (S2), 0.7530 (S3)
Resistance: 0.7600 (R1), 0.7625 (R2), 0.7650 (R3)
GBP/JPY
Support: 137.50 (S1), 137.00 (S2), 136.50 (S3)
Resistance: 138.70 (R1), 139.10 (R2), 140.00 (R3)
Canadian Dollar Dips To 3-Week Low, Trade Balance Next
USD/CAD continues to gain ground this week. In the Tuesday session, the pair has reached a high of 1.3447, its highest level since March 15. On the release front, Canada and the US will both release Trade Balance. Canada's trade surplus is expected to edge lower to C$0.7 billion. In the US, the trade deficit is forecast to narrow to $46.0 billion.
Canada's GDP expanded 0.6 percent, above the forecast of 0.3 percent. This marked a 7-month high for GDP, and raises hopes that a strong US economy will boost its northern neighbor. Although the Canadian economy has been churning out decent numbers, lower oil prices have had a negative impact on the Canadian economy and also weighed on the Canadian dollar, which continues to lose ground. Later in the week, we'll get a look at Canadian Employment Change, which is expected to post a modest gain of 5.7 thousand.
The US economy hasn't missed a beat in 2017, and the markets are expecting strong data for the first quarter. The CB consumer confidence report soared to 125.6 in March, and strong consumer confidence levels should translate into increased consumer spending, a key component of economic growth. GDP for the fourth quarter was revised to 2.1%, up from 1.9% in the previous GDP report. With the economy headed in the right direction, the discussions around the monetary policy tables are not whether the Fed will raise rates, but will it press the rate trigger two or three more times in 2017. The markets will be paying close attention to the minutes of the March meeting, when the Fed raised rates by a quarter-point, to a range of 0.75-1.00%. Any hints about the timing of the next hike, as well as the tone of the minutes are factors which could move the currency markets on Wednesday. The markets considered the rate statement overly cautious, and this sentiment sent the US dollar broadly lower. If the reaction to the minutes is one of disappointment, the dollar could again head downwards.
GBPCHF Beware Of Head And Shoulders At 1.2440
The GBP/CHF has formed head and shoulders pattern (Bearish SHS) with a clear double bottom at 1.2441. Bearish SHS could breakout below at 1.2440 aiming for D L5/ W L4 confluence 1.2415 and 1.2383. If the pair retraces to POC (top of the right shoulder, D H3, ATR pivot) 1.2515-30 we might see a rejection towards above mentioned targets. So traders should pay attention to POC rejection or breakout below 1.2440.
D H3 - Daily Camarilla Pivot (Daily Resistance)
POC - Point Of Confluence (The zone where we expect price to react - aka entry zone)
W L4 - Weekly L3 Camarilla (Very Strong Weekly Support)
D L4- Daily L4 Camarilla ( Very Strong Daily Support)
D L5- Daily L4 Camarilla ( Strongest Daily Support)
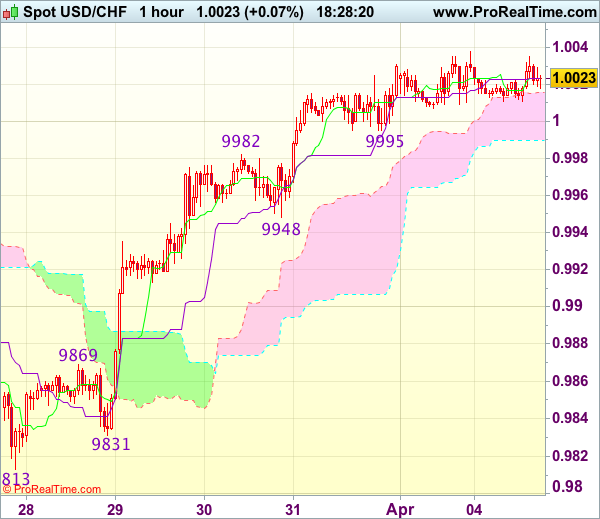
Trade Idea Update: USD/CHF – Buy at 0.9950
USD/CHF - 1.0027
Original strategy :
Buy at 0.9950, Target: 1.0050, Stop: 0.9915
Position : -
Target : -
Stop : -
New strategy :
Buy at 0.9950, Target: 1.0050, Stop: 0.9915
Position : -
Target : -
Stop : -
As the greenback has maintained a firm undertone after last week’s rally above 1.0003 resistance, suggesting recent rise from last week’s low at 0.9813 is still in progress and bullishness remains for this move to extend gain to previous support at 1.0060 (now resistance), however, loss of upward momentum should prevent sharp move beyond resistance at 1.0109, risk from there has increased for a retreat to take place later.
In view of this, would not chase this rise here and would be prudent to buy dollar on pullback as said support at 0.9948 should limit downside. Below 0.9931 (50% Fibonacci retracement of 0.9831-1.0031) would abort and signal top is formed instead, bring correction to 0.9905-10 (61.8% Fibonacci retracement) but reckon previous resistance at 0.9869 would hold from here.
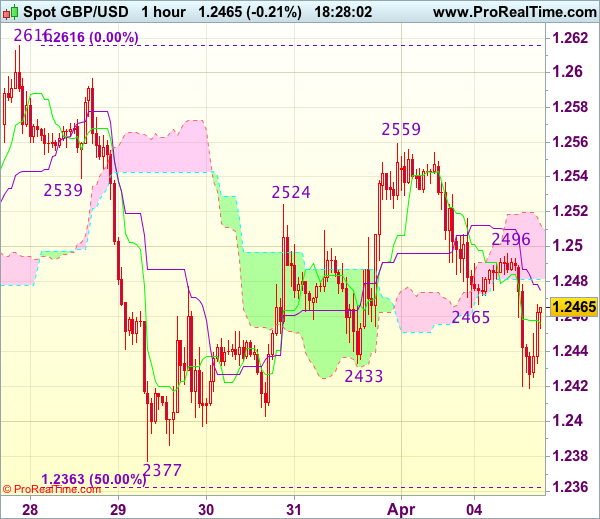
Trade Idea Update: GBP/USD – Hold short entered at 1.2465
GBP/USD - 1.2457
Original strategy :
Sold at 1.2465, Target: 1.2365, Stop: 1.2500
Position : - Short at 1.2465
Target : - 1.2365
Stop : - 1.2500
New strategy :
Hold short entered at 1.2465, Target: 1.2365, Stop: 1.2500
Position : - Short at 1.2465
Target : - 1.2365
Stop : - 1.2500
Although cable has rebounded after finding support at 1.2419 and minor consolidation above this level would be seen, reckon the Kijun-Sen (now at 1.2475) would limit upside and bring another decline later, below said support at 1.2419 would extend weakness to 1.2400, break there would add credence to our view that the rebound from 1.2377 has ended at 1.2559, bring further fall towards support at 1.2377. Looking ahead, only a drop below 1.2377 would confirm the fall from 1.2616 is still in progress for subsequent decline towards key support at 1.2335.
In view of this, we are holding on to our short position entered at 1.2465 but one should exit on such decline. Only break of said resistance at 1.2496 would abort and suggest an intra-day low is formed instead, risk a stronger rebound to 1.2525-30.
EUR/GBP Bulls Retreat Under Resistance At 0.8600
The European Central Bank president Draghi will make a speech at 15:30 BST today, it will likely affect the Euro and Euro crosses.
EUR/GBP has rebounded since yesterday, after hitting a 5-week low of 0.8485.
The bulls attempted to test the near-term major resistance level at 0.8600 in early morning, where the 10-day SMA converges (on the daily chart).
The bulls still have momentum, however, be aware that the selling pressure at this level is heavier. The bullish momentum is likely to be restrained here, prior to the next rally.
The 4-hourly Stochastic Oscillator reading is around 70, suggesting a retracement.
The resistance level is at 0.8565, followed by 0.8580 and 0.8600.
The support line is at 0.8550, followed by 0.8535 and 0.8520.

