Sample Category Title
Trade Idea Update: EUR/USD – Sell at 1.0730
EUR/USD - 1.0651
Original strategy :
Sell at 1.0730, Target: 1.0610, Stop: 1.0765
Position : -
Target : -
Stop : -
New strategy :
Sell at 1.0730, Target: 1.0610, Stop: 1.0765
Position : -
Target : -
Stop : -
As the single currency has remained under pressure after falling to 1.0642 yesterday, adding credence to our bearish view that the decline from 1.0906 top is still in progress and bearishness remains for this fall to extend further weakness to 1.0620-25, then test of previous chart support at 1.0600, however, a sustained breach below the latter level is needed to retain downside bias for subsequent selloff to 1.0570-75 first, otherwise, risk from there is seen for a rebound later.
In view of this, would not chase this fall here and would be prudent to sell dollar on recovery as 1.0730-40 should limit upside. Only a firm break above resistance at 1.0773 would suggest low is formed instead, bring a stronger rebound to 1.0800 but resistance at 1.0827 should remain intact.

Market Update – European Session: Spain Continues With Its Improving Employment Trend
Notes/Observations
Quiet session; focus on key end-of-week events: US payroll data and President Trump/China President Xi meeting in Florida
Spain's Net Unemployment registers its biggest ever decline for the month of March (-48.8K v -40.9K)
Overnight:
Asia:
RBA keeps Cash Rate Target unchanged at 1.50% (as expected). Says view consistent with sustainable growth in the economy and achieving the inflation target over time. Reiterated view that domestic inflation remained quite low but was expected to pick up over the course of 2017
BOJ Gov Kuroda reiterated view that was too early to discuss an exit from current monetary policy. Exit strategy to vary depending on economy and markets. BOJ ETF purchases are not distorting market function
South Korea Mar CPI registered its highest annual pace since June 2012 (2.2% v 2.1%e)
Europe:
UK House of Commons Brexit committee noted that PM May had been urged by to carry out a full economic and legal assessment of the implications for Britain if it failed to sure a trade deal with the EU. Must publish cost reaching no deal in Brexit talks
Americas:
Fed's Harker (hawk, FOMC voter): reiterated three hikes in 2017 would be appropriate; US inflation was moving slowly but surely upward
Senate Judiciary Committee approved Gorsuch nomination to Supreme Court; sent nomination to full Senate floor. Senate Democrats now have 41 votes against cloture, sufficient to filibuster nomination of Neil Gorsuch to the Supreme Court
Economic Data
(ES) Spain Mar Net Unemployment M/M: -48.8K v 0.9Ke (Biggest decline ever for month of March)
(IT) Italy Q4 YTD Budget Deficit to GDP: 2.4% v 2.5% prior
(BR) Brazil Mar FIPE CPI (Sao Paulo) M/M: 0.1% v 0.1%e
(UK) Mar Construction PMI: 52.2 v 52.5e (7th month of expansion)
(EU) Euro Zone Feb Retail Sales M/M: 0.7% v 0.5%e; Y/Y: 1.8% v 1.0%e
Fixed Income Issuance:
(EU) EFSF opened book to sell 2024 and 2045 bonds via syndicate
(ES) Spain Debt Agency (Tesoro) sold total €4.63B vs. €4.0-5.0B indicated range in 6-month and 12-month Bills
(ID) Indonesia sold total IDR4.46 in 2-year, 4-year, 7-year and 15-year Project based Sukuk (PBS)
(AT) Austria Debt Agency (AFFA) sold total €1.32B vs. €1.32B indicated in 2023 and 2027 RAGB bonds
(ZA) South Africa sold total ZAR2.35B vs. ZAR2.35B indicated in 2026, 2036 and 2048 bonds
SPEAKERS/FIXED INCOME/FX/COMMODITIES/ERRATUM
Equities
Index snapshot (as of 10:00 GMT)
Indices [Stoxx50 -0.1% at 3,470, FTSE +0.4% at 7,314, DAX -0.1% at 12,241, CAC-40 flat at 5,086, IBEX-35 +0.1% at 10,337, FTSE MIB -0.2% at 20,193, SMI +0.1% at 8,643, S&P 500 Futures -0.2%]
Equities
Consumer discretionary [ASOS ASC.UK -6.2% (H1 results), Topps Tiles TPT.UK -6.9% (H1 update), Bunzl BNZL.UK +1.8% (2 acquisitions)]
Consumer Staples [Suedzucker SZU.DE -9.5% (Analyst downgrade), ITE Group ITE.UK +4.3% (Trading update), Carl Zeiss AFX.DE +1.3% (prelim H1)]
Materials: [Nanoco NANO.UK -18% (H1 results, lowers outlook)]
Financials: [Grenkeleasing GLJ.DE +3.5% (Q1 update)]
Technology: [Sophos Grp SOPH.UK +11.4% (Raised outlook, resolves patent dispute)]
Energy: [Seadrill SDRL.NO -41% (Amendments to Secured Credit Facilities), Polarcus PLCS.NO -3.5% (Vessel utilization)]
Speakers
BOE Financial Policy Committee (FPC) Mar 22nd Minutes: Concerned rapid growth in unsecured lending to British consumers; could principally represent a risk to lenders if accompanied by weaker lending standards
Sweden Central Bank (Riksbank) Dep Gov Floden: PMI data was a sign for growth but it remained to be seen what growth meant for inflation
RBA Gov Lowe: More home loan curbs would be considered if needed. Reiterates need to see improvement in job market to know economy is strengthening
Eurogroup Chief Dijsselbloem reiterated he had no intention to step down as Eurogroup chief; looking to speak in EU Parliament
EU Official: Greece talks in Brussels today could be an important stepping stone. Greek hurdles were political and not technical. Talks moving beyond July payments would be detrimental
Russia govt said not to be planning any measures to counter gains in RUB currency (ruble). It saw the Ruble currency weakening in H2 due to oil and rate cuts
Moody's on South Africa: Will not be issuing any decision on sovereign rating on Friday, Apr 7th. To issue decision after concluding downgrade review that could take 1-3 months from now
Turkey Fin Min Agbal: Inflation might be back to single digits by Dec; upward trajectory to continue
Currencies
US Treasury yields at 5-week low helping to push the USD/JPY pair below 110.50 in the session. Some dealers also noting that BoJ and government advisors had been floating the idea of how to move away from yield curve control. Nonetheless BoJ's Kuroda did reiterated his dovish stance that it was premature to discuss an exit strategy from the central bank's aggressive easing policy.
EUR/USD hovered in the mid-1.06 area as price action continued the repricing of ECB rate outlook as various officials noted . ECB chief economist Praet continues, after yesterday ' s push back of rate hikes from Praet
RBA kept its policy steady with a dovish tilt and this helped the AUD/USD hit a 3-week low below 0.7560 area.
Spot gold at 1-month highs aided by geopolitical worries with the metal at $1,258/oz
Fixed Income:
Bund futures trade at 162.35 up a further 26 ticks trading at new one month highs with further momentum higher targeting 162.65 followed by 162.98 then Feb contract high at 163.12. Analysts eye support at 161.63 followed by 161.34 then 161.06.
Gilt futures trade at 128.40 up 13 ticks aided by a slight miss in UK construction PMI data. Resistance moves to 128.96 followed by 129.24. Support moves to 127.75 then 127.34 followed by 127.05. Short Sterling futures curve continues to flatten with futures trading flat to up 2bp along the curve. Jun17Jun18 spread falls to 13.5/14bp down 2.5bp from yesterday.
Tuesday's liquidity report showed Monday's excess liquidity fell to €1.444T a fall of €68B from €1.512T prior. Use of the marginal lending facility fell to €212M from €285M prior.
Corporate issuance saw $2.75B come to market via 5 issuers in a slow start to the quarter, headlined by Progressive Corp $850M 30 year offering, and Cimarex Energy $750M 10 year offering. Issuance for the week is expected to be around $25B.
Looking Ahead
(RU) Russia Mar Sovereign Wealth Fund Balances: Reserve Fund: No est v $16.1B prior; Wellbeing Fund: No est v $72.6B prior
(BR) Brazil Mat CNI Consumer Confidence: No est v 104.4 prior
05.30 (UK) Weekly John Lewis LFL sales data - 05:30 (EU) ECB allotment in 7-Day Main Refinancing Tender
05:30 (HU) Hungary Debt Agency (AKK) to sell 3-month Bills
05:30 (DE) Germany to sell €1.0B in 0.1% Apr 2026 Indexed-bonds
05:30 (BE) Belgium to sell €1.3-1.7B in 3-Month and 6-Month Bills
06:00 (IE) Ireland Mar Unemployment Rate: No est v 6.6% prior
06:00 (TR) Turkey to sell Zero 2018 Bonds; Yield: % v 11.67% prior; bid-to-cover: x v 6.86x prior
06:45 (US) Daily Libor Fixing
07:30 (TR) Turkey Mar Real Effective Exchange Rate (REER): No est v 88.83 prior
07:45 (US) Weekly Goldman Economist Chain Store Sales
08:00 (BR) Brazil Feb Industrial Production M/M: +0.7%e v -0.1% prior; Y/Y: 0.4%e v 1.4% prior
08:00 (NO) Norway Central Bank (Norges) Gov Olsen speaks in Oslo
08:00 (RU) Russia announces weekly OFZ bond auction - 08:15 (UK) Baltic Dry Bulk Index
08:30 (US) Feb Trade Balance: -$44.6Be v -$48.5B prior
08:30 (CA) Canada Feb Int'l Merchandise Trade: C$0.6Be v C$0.8B prior
08:30 (SI) Slovenia Debt Agency to sell 12-month and 18-month Bills
08:30 (NZ) Fonterra Global Dairy Trade Auction
08:55 (US) Weekly Redbook Sales
09:00 (EU) Weekly ECB Forex Reserves
09:00 (MX) Mexico Feb Leading Indicators M/M: No est v -0.20 prior
09:30 (EU) ECB's Draghi speaks in Frankfurt
09:30 (EU) ECB announces Covered-Bond Purchases
10:00 (US) Feb Factory Orders: 1.0%e v 1.2% prior; Factory Orders Ex-Transportation: No est v 0.3% prior
10:00 (US) Feb Final Durable Goods Orders: 1.7%e v 1.7% prelim; Durables Ex-Transportation : No est v 0.4% prelim; Capital Goods Orders (Non-defense ex aircraft): No est v -0.1% prelim, Capital Goods Shipments (Non-defense/ex-aircraft): No est v +1.0%prelim; Durables Ex-Defense: No est v 2.1% prelim
10:00 (DK) Denmark Mar Foreign Reserves (DKK): 470.8Be v 466.6 prior
11:00 (BR) Brazil to sell I/L 2022, 2026, 2035 and 2055 Bonds - 11:30 (US) Treasury to sell 4-Week Bills
15:00 (CO) Colombia Mar Total PPI M/M: No est v -0.6% prior; Domestic PPI M/M: No est v -0.2% prior
16:30 (US) Weekly API Oil Inventories
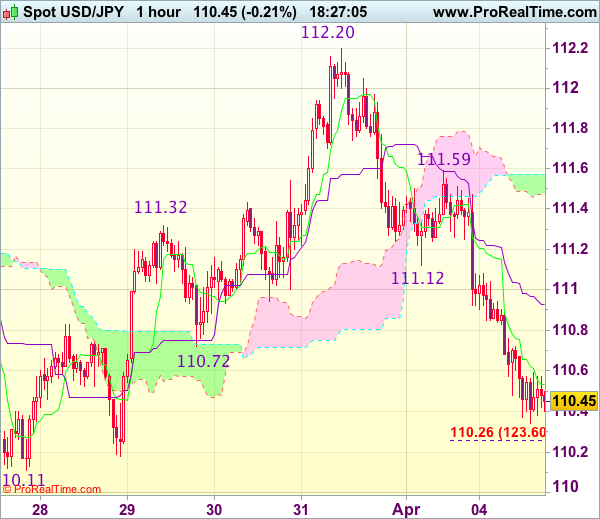
Trade Idea Update: USD/JPY – Sell at 110.95
USD/JPY - 110.45
Original strategy :
Sell at 110.95, Target: 109.95, Stop: 111.30
Position : -
Target : -
Stop : -
New strategy :
Sell at 110.95, Target: 109.95, Stop: 111.30
Position : -
Target : -
Stop : -
As the greenback has dropped again after meeting renewed selling interest at 111.59 yesterday, adding credence to our view that top ha been formed at 112.20 and bearishness remains for the selloff from there to extend weakness to 110.11 support, however, break there is needed to retain downside bias and confirm medium term decline has resumed for further subsequent fall to 109.80-85 (1.618 times projection of 112.20-111.12 measuring from 111.59) which is likely to hold on first testing.
In view of this, would not chase this fall here and would be prudent to sell dollar on recovery as 110.90-95 should limit upside. Above previous support at 111.12 (now resistance) would defer but only break of resistance at 111.59 would abort and signal the fall from 112.20 has ended instead.
Technical Outlook: US Crude – Correction Cracks $50.00 Support, Risks Dips To $49.39
WTI oil extends pullback from recovery highs at $50.82, following repeated upside rejection of recovery rally that was capped by daily Kijun-sen line. The price is in red for the second day and fresh extension lower cracked psychological $50.00 support on Tuesday. The move is so far seen as correction on strongly overbought slow stochastic on daily chart, which is attempting to generate stronger bearish signal on reversal. Correction could extend to $49.39 (Fibo 38.2% of $47.07/$50.82 upleg), before fresh attempts higher. Technicals studies are in mixed mode and without clear direction, however, recent break above $50.00 pivot was positive signal for further recovery. Limited dips are required to keep bullish scenario in play for fresh attempts towards next targets at $51.03/20 (50% of $55.01/$47.06/100SMA). Alternatively, increased downside pressure could be expected on loss of $49.39 support, while extension below $48.95 (daily Tenkan-sen) would signal reversal.
Res: 50.33, 50.73, 50.83, 51.03
Sup: 48.87, 49.39, 48.95, 48.50
GBP/USD Elliott Wave Analysis
GBP/USD – 1.2460
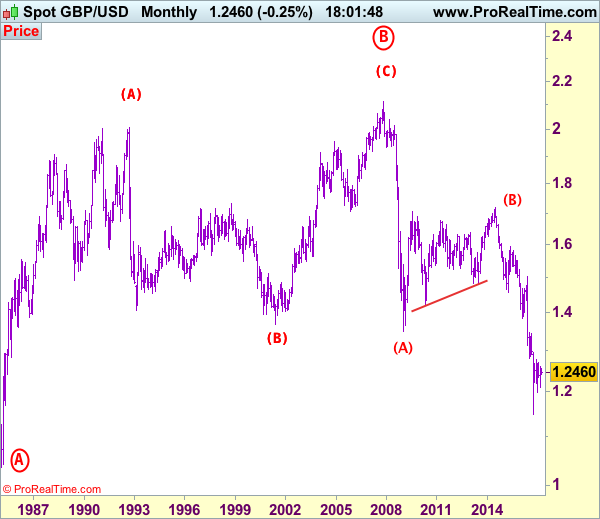
GBP/USD – Wave 4 is unfolding as an (A)-(B)-(C) and could have ended at 1.7192
As cable met resistance at 1.2559 and has slipped again, retaining our view that further consolidation below last month’s high of 1.2616 would be seen and initial downside risk remains for test of 1.2377 support, however, reckon downside would be limited to previous support at 1.2335 and bring another rise later. A daily close above resistance at 1.2559 would signal the retreat from 1.2616 has ended, bring retest of this level, break there would extend the rebound from 1.2109 to previous resistance at 1.2706 but break there is needed to signal another leg of corrective upmove from 1.1986 low is underway for further gain to 1.2800 and then 1.2900, having said that, psychological resistance at 1.3000 would remain intact.
Our preferred count on the daily chart is that cable's rebound from 1.3500 (wave (A) trough) is unfolding as a wave (B) with A ended at 1.7043, followed by triangle wave B and wave C as well as wave (B) has possibly ended at 1.7192, below support at 1.4232 would add credence to this count, then further fall to 1.4000 level would follow but reckon downside would be limited to 1.3655 support and price should stay above previous support at 1.3500.
On the downside, whilst initial pullback to 1.2400-05 cannot be ruled out, reckon downside would be limited to 1.2335 support and bring another rise later. A daily close below support at 1.2335 would dampen this bullish view and bring weakness to 1.2290-00 but reckon 1.2240-50 would hold, bring another rebound. A drop below 1.2240-50 would suggest the rebound from 1.2109 has ended instead, bring further fall to 1.2200 and then 1.2150-60 but said support at 1.2109 should remain intact.
Recommendation: Buy at 1.2340 for 1.2600 with stop above 1.2240.
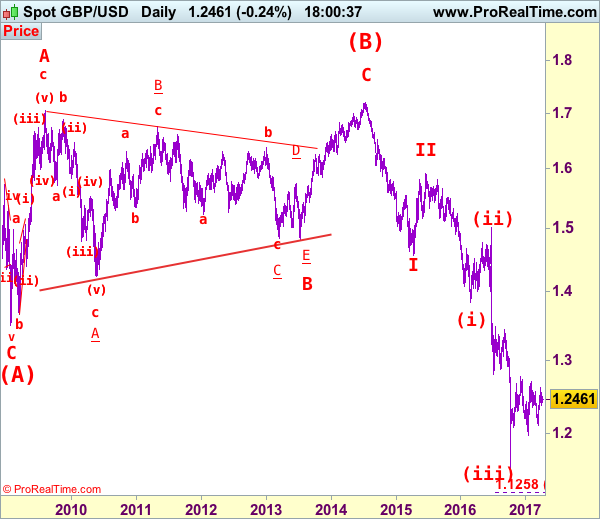
Longer term - Cable's rise from 1.0520 (Feb 1985) to 2.0100 (September 1992) is seen as [A], the decline to 1.3682 is labeled as (B) and (C) wave rally has ended at 2.1162 (9 Nov, 2007) which is also the top of larger degree wave B with circle. The selloff from there is a 5-waver with wave (A) ended at 1.3500 (23 Jan 2009), wave (B) itself is labeled as A: 1.6733, triangle wave B: 1.4813 and wave C as well as top of wave (B) ended at 1.7192 (2014), hence the selloff from there is an impulsive wave (C) with wave I : 1.4566, wave II 1.5930, an extended wave III is unfolding and already exceeded our downside target at 1.3500 and 1.3000, hence weakness to 1.2500 and possibly 1.2000 cannot be ruled out, however, price should stay well above psychological level at 1.0000.
Reserve Bank Of Australia On Hold, USD Gains As Market Switch In Risk-Off Mode
News and Events:
USD extends gain versus G10, JPY resists
After a quiet start into the week, the USD was back in full force on Tuesday as it extended gains against most of its pairs. The Japanese Yen was the only G10 currency able to offer resistance as it rose 0.36% with USD/JPY sliding to 110.40. The market is currently switching slowly into risk-averse mode, with the Yen and Gold seeing good inflow, amid rising global uncertainty.
Investors will soon however ever get some fresh data to get their teeth into. In the US, February factory orders (+1% m/m exp.,1.2% prev.) and durable goods orders (first est. 1.7% m/m) are due this afternoon.
Tomorrow, the publication of the FOMC will get special attention from investors who will try to read between the lines, looking for hidden hints about the pace of the rate normalisation process.
Finally, March’s job report will be Friday’s major event. The US economy is expected to have created 175k private jobs last month, compared to 235k in February. As explained a month ago, we believe that the market is less and less focused on job gains but instead monitoring wage development closely. Looking at the headline figures, the momentum seems solid as average hourly earnings were up 2.8% y/y. Nevertheless, the sustained rise in consumer prices, which has been mostly driven by rising commodity prices, has eroded the purchasing power of the average American as real average weekly earnings dipped in negative territory during the first two months of the year.
Emerging market and commodity currencies took the bigger hit this morning as market participants shied away from risky positions. We do not think this is the time for further Dollar debasement as the global uncertainty favours long USD position, especially ahead of the French and German election. Similarly, the setback of commodity currencies will also prove temporary in our opinion as high returns are still a rare breed.
French Elections: Candidates return to debate
Today 11 candidates will debate for the French Presidency. At the last debate, contrary to what is said now about him being a frontrunner, Emmanuel Macron had not been successful. So this debate may see a turnaround in this presidential election, as Francois Fillon has improved lately in the polls despite the accusations that engulfed him.
Tonight’s debate will mostly be on jobs, security, and the candidates' vision for the future of France. It is clear that the European Union will be at the centre of the debate and we should see “small” candidates trying to make a difference with their views on this.
It is expected that François Asselineau, the Frexit candidate, will largely attack Macron and Fillon on this specific topic, as will Marine Le Pen. But a possible referendum if she gets elected remains somewhat unclear.
For now, markets are still not pricing a Le Pen victory. In terms of currency, the Euro is consolidating against the USD between 1.06 and 1.07 and we believe that there is more room for further downside in the short-term.
Bullish on AUD after RBA kept rates unchanged
As expected the RBA held its cash rate at 1.50%. Despite this, the AUDUSD quickly fell to 0.7557 on market disappointment that rate expectation should be paired back and also due to lower risk appetite and lower iron ore prices.
The accompanying statement was marginally more optimistic regarding the domestic and global economic outlook. They mentioned the improvement in trade and higher commodity prices (on-going large trade surplus) would support domestic conditions. The RBA indicated that “on-going moderate growth” will support forward indicators and backstop softening labor markets.
The RBA also highlighted risks in the housing market. They took particular care in discussing retail credit growth and risk of rising mortgage rates on outstanding loans, adding that lenders must watch serviceability analytics. Additionally, the RBA introduced a new paragraph on macro-prudent measures stating “a reduced reliance on interest-only housing loans in the Australian market would also be a positive development”.
On inflation the statement was unchanged with headline CPI expected to break 2% in 2017, with a limited upside as wage growth is subdued.
All in, it is unlikely the RBA will rise rates unless the housing market continues to accelerate and even then it is likely to use micro-adjustment tools prior to monetary policy hikes. However, we can expect the RBA to shift from dovish to neutral as growth gradually breaches the bank’s forecasted range.
Given the positive global conditions of risk taking (despite the current bout of uncertainty) we are constructive on AUDUSD, as 0.7563 should provide support for a recovery rally to 0.7633 resistance.
Today's Key Issues (time in GMT):
- Mar Unemployment MoM Net ('000s), exp -40,9, last -9,4 EUR / 07:00
- 4Q Deficit to GDP YTD, last 2,30%, rev 2,50% EUR / 08:00
- Mar FIPE CPI - Monthly, exp 0,12%, last -0,08% BRL / 08:00
- Mar Markit/CIPS UK Construction PMI, exp 52,5, last 52,5 GBP / 08:30
- Feb Retail Sales MoM, exp 0,50%, last -0,10%, rev 0,10% EUR / 09:00
- Feb Retail Sales YoY, exp 1,00%, last 1,20%, rev 1,50% EUR / 09:00
- Lowe Gives Remarks at RBA Board Dinner, Melbourne AUD / 09:15
- Mar Effective Exchange Rate, last 88,83 TRY / 11:30
- Feb Industrial Production MoM, exp 0,70%, last -0,10% BRL / 12:00
- Feb Industrial Production YoY, exp 0,30%, last 1,40% BRL / 12:00
- Feb Trade Balance, exp -$44.6b, last -$48.5b USD / 12:30
- Feb Int'l Merchandise Trade, exp 0.60b, last 0.81b CAD / 12:30
- ECB President Draghi speaks in Frankfurt EUR / 13:30
- Mar Foreign Reserves, exp 470,8, last 466,6 DKK / 14:00
- Mar Change in Currency Reserves, last 8.8b DKK / 14:00
- Feb Factory Orders, exp 1,00%, last 1,20% USD / 14:00
- Feb Factory Orders Ex Trans, last 0,30% USD / 14:00
- Feb F Durable Goods Orders, exp 1,70%, last 1,70% USD / 14:00
- Feb F Durables Ex Transportation, last 0,40% USD / 14:00
- Feb F Cap Goods Orders Nondef Ex Air, last -0,10% USD / 14:00
- Feb F Cap Goods Ship Nondef Ex Air, last 1,00% USD / 14:00
- Mar QV House Prices YoY, last 13,50% NZD / 17:00
- Fed's Tarullo speaks at Princeton University USD / 20:30
- Mar Foreign Reserves, last $373.91b KRW / 21:00
The Risk Today:
EUR/USD is getting lower despite ongoing consolidation. The pair is heading lower since the pair failed to hold above former resistance given at 1.0874 (08/12/2017 high). Hourly support can be found at 1.0643 (03/04/2017 low). Stronger support can be found at 1.0493 (22/02/2017 low). The short-term technical structure indicates further weakness.. In the longer term, the death cross late October indicated a further bearish bias. The pair has broken key support given at 1.0458 (16/03/2015 low). Key resistance holds at 1.1714 (24/08/2015 high). Expected to head towards parity.
GBP/USD's bullish pressures have faded abruptly. Hourly resistance is located at 1.2615 (27/03/2017 high) while hourly support can be found at 1.2324 (03/17/2017 low). Expected to show continued strengthening towards resistance at 1.2775 (06/12/2016 high) if support area around 1.24 stands. The long-term technical pattern is even more negative since the Brexit vote has paved the way for further decline. Long-term support given at 1.0520 (01/03/85) represents a decent target. Long-term resistance is given at 1.5018 (24/06/2015) and would indicate a long-term reversal in the negative trend. Yet, it is very unlikely at the moment.
USD/JPY's bearish pressures are fading. Hourly resistance is given at 112.20 (31/03/2017 high). Stronger resistance can be located at 113.57 (16/03/2017 high) while support is given at 110.11 (27/03/2017 low). We favor a long-term bearish bias. Support is now given at 96.57 (10/08/2013 low). A gradual rise towards the major resistance at 135.15 (01/02/2002 high) seems absolutely unlikely. Expected to decline further support at 93.79 (13/06/2013 low).
USD/CHF is strengthening. Hourly support is given at 0.9814 (27/03/2017 low). Key resistance can be found at a distance at 1.0344 (15/12/2016 high). Expected to show further consolidating. In the long-term, the pair is still trading in range since 2011 despite some turmoil when the SNB unpegged the CHF. Key support can be found 0.8986 (30/01/2015 low). The technical structure favours nonetheless a long term bullish bias since the unpeg in January 2015.
| EURUSD | GBPUSD | USDCHF | USDJPY |
| 1.1300 | 1.3445 | 1.0652 | 121.69 |
| 1.0954 | 1.3121 | 1.0344 | 118.66 |
| 1.0906 | 1.2771 | 1.0171 | 115.62 |
| 1.0669 | 1.2504 | 1.0018 | 111.32 |
| 1.0494 | 1.1986 | 0.9550 | 106.57 |
| 1.0341 | 1.1841 | 0.9444 | 106.04 |
| 1.0000 | 1.0520 | 0.9259 | 101.20 |
GBP/JPY Elliott Wave Analysis
GBP/JPY – 137.65
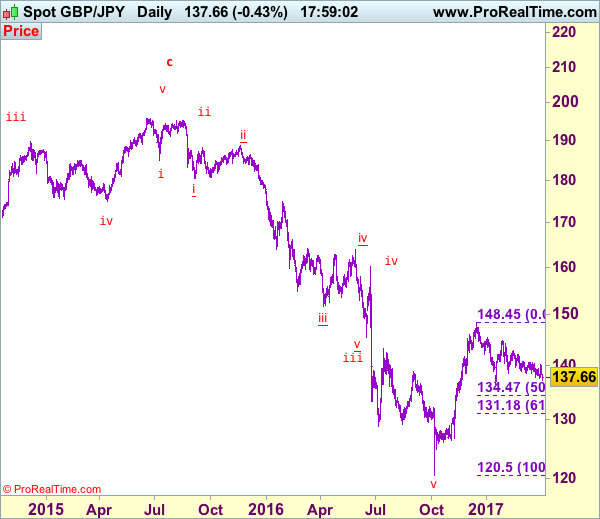
GBP/JPY – Wave 5 as well as wave (III) has possibly ended at 116.85
As sterling has fallen again after faltering below resistance at 140.60, dampening our near term bullishness and near term downside risk remains for the fall from 144.75 to bring a stronger retracement of early upmove from 120.50 to 136.45-50, break there would add credence to this view and extend fall to 135.90-00, then towards 134.45-50 (50% Fibonacci retracement of 120.50-148.45) which is likely to hold on first testing, risk from there is seen for a rebound to take place later.
Our preferred count is that larger degree wave V with circle is unfolding from 251.12 with wave (I) 219.34, (II): 241.38 and wave (III) is subdivided into 1: 192.60, 2: 215.89 (23 Jul 2008) and wave 3 ended at 118.87 earlier in 2009. The correction from there to 162.60 is wave 4 which itself is a double three and is labeled as first a-b-c ended at 151.53, followed by wave x at 139.03, 2nd a ended at 162.60, 2nd b at 146.75 and 2nd c leg of wave 4 ended at 163.00. Therefore, the decline from 163.00 to 116.85 is now treated as wave 5 which also marked the end of larger degree wave (III), hence wave (IV) major correction has commenced for retracement of the wave (III) from 241.38 and upside target at 183.95-00 (50% Fibonacci retracement of the wave (II) from 241.38) had been met, a drop below 160.00 would suggest wave (IV) has ended at 195.85, bring decline in wave (V) for initial weakness to 130 (already met) and 120.
On the upside, whilst recovery to 138.35-40 cannot be ruled out, reckon upside would be limited to 139.00-10 and resistance at 140.10 (last week’s high) should hold, bring another decline later. Only break of indicated resistance at 140.60 would revive bullishness and suggest low is formed, bring a stronger rebound to 142.00-05 but only break of resistance at 142.80 would signal the fall from 144.75 has ended, bring further gain to 143.40-50 first.
Recommendation: Stand aside for this week.
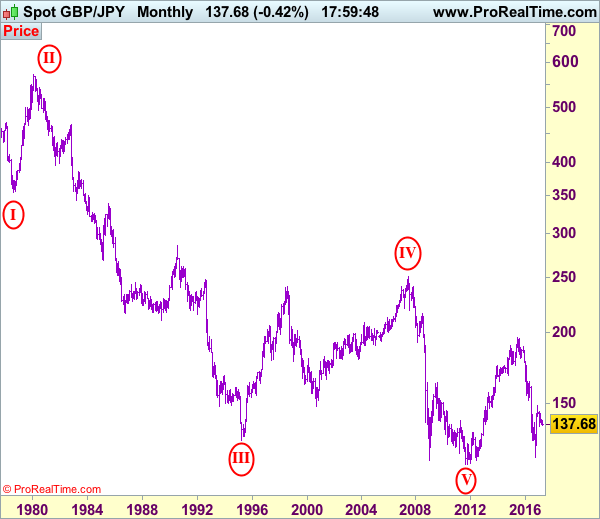
The long-term downtrend from 570.99 (29 Feb 1980) is labeled as an impulsive wave with III with circle ended at 129.77 (20 Apr 1995) and the corrective rebound to 251.12 (20 Jul 2007) is treated as wave IV with circle and the wave V with circle selloff from 251.12 has possibly ended at 116.80 (almost reached our indicated target at 116.00) and major correction has commenced from there and indicated upside target at 183.90-00 (50% Fibonacci retracement of 251.10-116.85) had been met, reckon upside would be limited to 199.80-90 (61.8% Fibonacci retracement) and bring wave (V) decline in later part of 2017.
Euro Under Pressure, Retail Sales Next
EUR/USD has edged lower in the Tuesday session. Currently, the pair is trading at 1.0660. On the release front, the eurozone will release retail sales, which is forecast to post a gain of 0.5%, after three straight declines. ECB President Mario Draghi will speak in Frankfurt, as the ECB launches its new EUR 50 banknote. In the US, today’s highlight is trade balance, which the trade deficit expected to narrow to $46.0 billion. On Wednesday, all eyes will be on the Federal Reserve, which will publish the minutes of its March policy meeting. As well, the US will release ADP Employment Change and ISM Non-Manufacturing PMI.
The euro remains under pressure, as the currency hovers close to 3-week lows. EUR/USD dropped 1.9 percent last week, marking its worst weekly decline since November 2016. Soft inflation numbers late in the week disappointed the markets and soured sentiment on the continental currency. German Preliminary CPI posted a weak gain of 0.2%, short of the forecast of 0.4%. This was followed by Eurozone Flash CPI Estimate, which slipped to 1.5%, missing the forecast of 1.8%. At the same time, Germany, the largest economy in Europe, continues to post solid numbers. Employment and retail sales data in February beat expectations, as the German economy continues to expand at a healthy clip in 2017.
The US economy hasn’t missed a beat in 2017, and the markets are expecting strong data for the first quarter. The CB consumer confidence report soared to 125.6 in March, and strong consumer confidence levels should translate into increased consumer spending, a key component of economic growth. GDP for the fourth quarter was revised to 2.1%, up from 1.9% in the previous GDP report. With the economy headed in the right direction, the discussions around the monetary policy tables are not whether the Fed will raise rates, but will it press the rate trigger two or three more times in 2017. The markets will be paying close attention to the minutes of the March meeting, when the Fed raised rates by a quarter-point, to a range of 0.75-1.00%. Any hints about the timing of the next hike, as well as the tone of the minutes are factors which could move the currency markets on Wednesday. The markets considered the rate statement overly cautious, and this sentiment sent the US dollar broadly lower. If the reaction to the minutes is one of disappointment, the dollar could again head downwards.
Asia Session – Holiday Thinned Trading
Holidays in China, Hong Kong, Taiwan and India saw muted trading in much of Asia with the USD holding firm, except against the JPY.
With so much of the region on holiday today, the focus rested mostly on the USD/JPY and AUD/USD. This follows the tumble in US yields yesterday and the RBA rate decision this afternoon. The dovish tone of the RBA staying unchanged overrode any positive sentiment from this morning’s near record trade surplus. In Japan, the Yen continued to strengthen against the USD and Euro as the yield spread narrowed and risk aversion from Japanese investors continued.
Today in Europe we have ECB President Mario Draghi talking this evening, as well as Euro-zone Retail Sales. The U.S. announces the Trade Balance, Durable Goods and Factory Orders. Tonight will also be notable as the White House announces its mark 2 version of the Obamacare Repeal.
Equities
The Nikkei fell over 1% today as a strengthening Yen weighed on sentiment and pushed automaker stocks in particular, lower. Mainland China and Hong Kong markets were closed. The Nikkei will likely continue to remain heavy as USD/JPY approaches the 110.00 level and JGB’s continue to rally on safe-haven flows. The next important level is 18,850 just below.
FX
AUD struggled today as a dovish RBA (particularly on jobs) and falling imports data tipped it through key support at 7590. Aud has continued to fall into the afternoon session with nearby support at 7550 with a break possibly setting up a test of key long-term support in the 7490/7500 area.
AUD/JPY is also suffering as a high beta pair to the risk -on, risk-off complex.The cross is finishing on its lows at 83.45, having broken support at 83.75. A daily close would be quite bearish technically, setting up further possible losses to the 82.50 area.
USD/JPY has had another bad day as U.S. yields tanking added to the already bearish technical picture. We finish in Asia at the lows of 110.40 having fallen from 111.00 this morning. The bounces in USD/JPY from a technical perspective, have been tepid, to say the least. 110 is the key support level now with stop-loss selling anticipated on a break. Until then, we remain becalmed within the recent 110/112 trading range.
EUR/JPY has broken support at 118.25 and is testing its 200-day moving average at 117.65 as I write. Although a daily close below would be bearish, we do note that the daily RSI is in oversold territory. This may make the technical picture less clear and leave the cross vulnerable to a possible squeeze higher in the short term before the bigger technical picture re-establishes itself.
EUR/USD. The highlight will undoubtedly be Mario Draghi speaking at 2130 Singapore time. The street seems to have taken the ECB’s guidance to heart and scaled back on their tapering ambitions. With Greece coming back into the headlines for all the wrong reasons, peripheral spreads of Bunds, in particular, have widened. This has seen the Euro fall from grace quite quickly from the taper-tantrum heights of last week. The single currency, however, does have technical support down here at 1.0640, yesterday’s low, and more importantly at the 100-day moving average at 1.0630.
In the bigger picture, the key level for Euro is 1.0500. Momentum appears to be waning down here for now from a chart perspective, meaning Euro could be vulnerable to a squeeze higher.
Precious Metals
Gold is benefitting from the risk aversion in other markets, finishing up five dollars in Asia at 1258.50. Dips have been shallow of late, with 1240 now very strong support on the daily charts. This seems to be setting up gold for a test of its 200-day moving average just above at 1259.50. The 200-day has capped all successive rallies this year. A close above 1260.50 now would be a strong technical signal that we are going to higher levels.
Silver has already broken through its 200-day moving average at 18.0900, and this has held all pullbacks in the last week, making it strong support on the technicals. Silver has moved directly higher today from its New York close. Up some 10 cents from 10.2500 t0 10.3500 and putting it in sight of key resistance at 18.5000. The price action suggests a test of the latter is almost inevitable, with a daily close above, possibly setting up a technical move to the 19.0000 area.
Technical Outlook: Spot Gold Is Pressuring Key Barriers For Continuation Of Larger Uptrend
Spot Gold extended recovery rally from $1139 trough on strong risk-off buying and cracked initial target at $1259 (200SMA), pressuring next targets at $1261/63(peaks of 27 Mar and 27 Feb).
The price is looking for daily close above $1255 (Fibo 61.8% of $1337/$1122 descend, which so far resisted several attacks), to generate bullish signal.
Firm break above 200SMA and $1261/63 peaks is needed to signal resumption of larger uptrend from $1122 (15 Dec low) towards Fibonacci projections at $1269/74 and $1286 (Fibo 76.4% of $1337/$1122 descend) in extension.
Meantime, the price may spend some time in consolidation before final break above key barriers, with daily Tenkan-sen (currently at $1250) required to contain extended dips.
Res: 1261, 1263, 1269, 1274
Sup: 1253, 1250, 1244, 1239