

Sample Category Title
Copper Elliott Wave View: 5 Waves Calling Higher
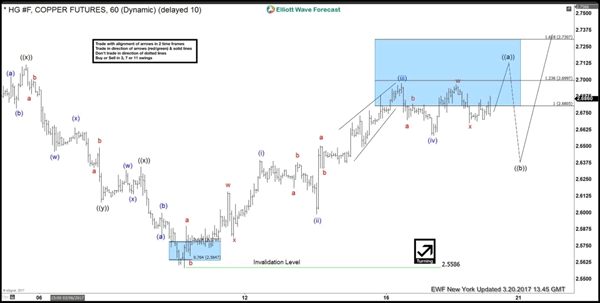
In this technical blog, lets take a quick look at the 1 hour Copper Elliott wave view from March 09 lows. In which the the metal was showing 5 waves bounce from March 09 (2.5593) low & the bounce was impulsive rather then corrective sequence. Thus suggesting the cycle from (2.5593) low could be following the Elliott wave Zig-zag pattern. Where the cycle from (2.5593) low ended at March 20 peak (2.6979) that we have labelled as Minute wave ((a)) of the zig-zag pattern. According to Elliott wave theory Zigzag is a 3 wave structure having internal subdivision of (5-3-5) swing sequence. The internal oscillations are labeled as A, B, C where A = 5 waves, B = 3 waves and C = 5 waves. This means that A and C can be impulsive or diagonal waves. However the A and C waves must meet all the conditions of wave structure 5, such as: having an RSI divergence between wave subdivisions, ideal Fibonacci extensions, ideal retracements etc. The cycle from (2.5593) low to (2.6979) was in 5 waves sequence, then the 3 wave dip in Minute wave ((b)) was expected to hold above (2.5593) low for next leg higher in Minute ((c)) leg higher into the direction of previous wave ((a)) or for 3 swings bounce at least.
Copper 1 hour chart
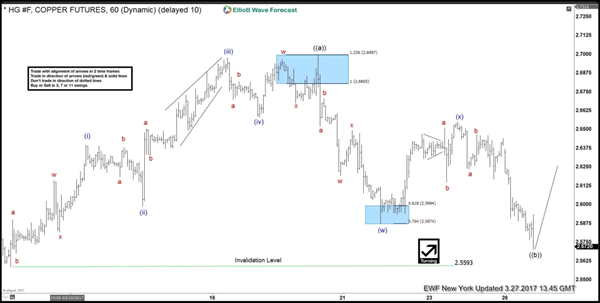
Below is the 1 hour March 27 NY updated chart showing the pullback happening in the metal within Minute wave ((b)), as Elliott wave double three structure from (2.6979) peak, where first leg lower ended in Minutte wave (w) at (2.5863) & Minutte wave (x) at (2.6544), then based on the correlations with US dollar & other commodities i.e OIL, Natural GAS & Metals, Copper was expected to stay above (2.5593) invalidation level.
Copper 1 hour March 27 NY updated chart
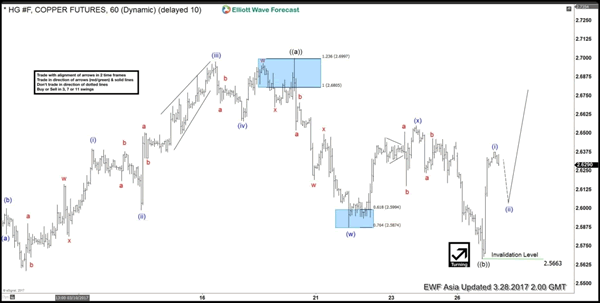
Since then Metal pulled back as expected, the pull back went quite deep but it was still holding above the Invalidation level (2.558) and as far as price stays above there, we were expecting Minute wave (( b )) to complete and metal to turn higher, as shown below
Copper 1 hour March 28 Asia updated chart
False Positive In European Inflation
FX Markets - False Positive In European Inflation
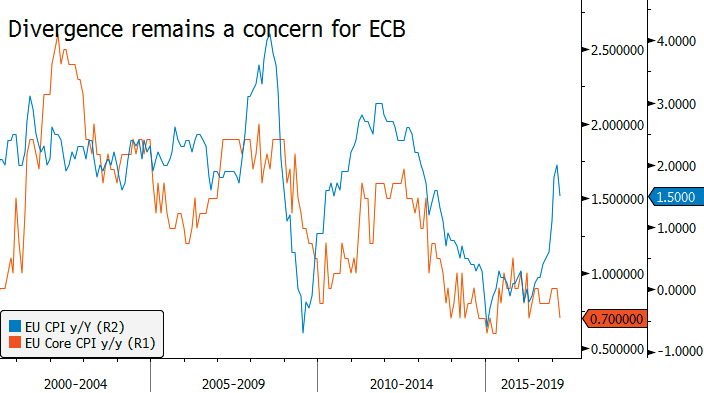
European investors have been cautiously watching last week's EU inflation data for likely forces driving the ECB's monetary policy strategy. Since February, consumer price inflation accelerated to its fastest pace since January 2013 and markets have been debating the rationale and sustainability of the ECB ultra-loose monetary stimulus policy. In addition, headline inflation which is trending higher towards the central bank's objective of below but close to 2%, with divergent core inflation, exuding persistent weakness, is a concern for Draghi.
The data release is expected to temporarily suspend demand for exiting accommodating positioning. Eurozone flash HICP inflation dropped 0.5% to 1.5% in March below consensus of 1.8% while core inflation slid to 0.7% y/y from 0.9% in February, below expectations for 0.8% print. HICP components indicate that all three indexes contributed to the fall in headline inflation.
With the "courgette shortage" fading, fresh food prices have moderated, sending food, alcohol, and tobacco price inflations to 1.8% from 2.5%. In addition, with crude prices falling energy price inflation also weakened to 7.3% from 9.3%. Overall seemingly headline inflation peak of 2.0% in February seems like an anomaly and unlikely to concern the ECB. However, with solid economic data including stronger labour-market outlook we suspect that underlying inflationary trend is on track and March data is a temporary. We could see core inflation climb to 1.1% by June supported by Easter related price increases. Less important are expectations that headline inflation will rebound to 1.8% by June.
The ECB spent much of last week trying to control market chatter over the exit. ECB members have been increasingly concern that the market is getting ahead of itself by misreading communications.
Dovish comments from ECB members such as Nowotny have done little to shift our European outlook. Yet, between data and comments our suspicion remains, that calls for the end of extreme policy setting (negative rates, easy lending, and bond purchases) are getting heard. ECB board member Coeure stated that it was "legitimate" for the ECB to review its pledge to keep rate at record low levels.
Overall, we don't expect to see actual changes in asset purchases and negative interest rates until 2018. However, in between the dovish guidance we suspect there will be hints of tightening. We suspect that we will get higher deposit rate before QE ends in a strategy to keep the market off guard. We remain constructive on EURUSD barring any shift in the French election outlook.
Economics - Brazilian Government Caps Spending
In spite of rising global uncertainty, emerging market currencies have been rather resilient over the last couple of weeks. However, one has to acknowledge that volatility also increased temporarily as investors preferred to remain cautious in the event that Donal Trump had to face another setback in implementing his programme. After completely erasing losses from last November and returning to around 3.05 in February, the Brazilian real has been trading in a volatile range since then, moving between 3.06 and 3.20 as investors await further clarity on the US outlook to emerge.
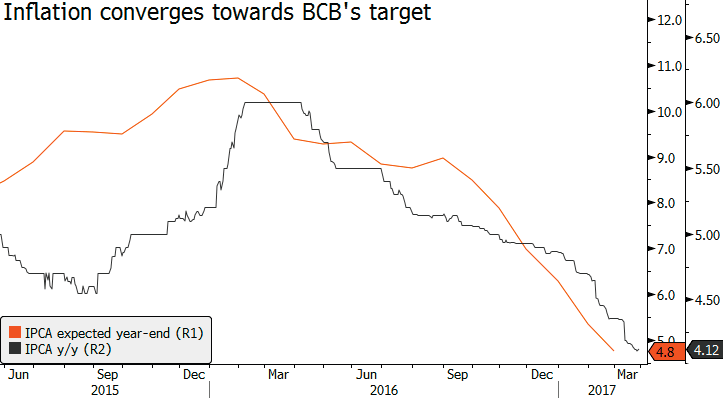
It goes without saying that local developments in EM countries have been largely ignored recently - with the exception of the political turmoil in South Africa last week - as market participants were too busy trying to anticipate Trump's next move. In Brazil, the economy is slowly gearing up as the central bank progressively eases its monetary policy. The Selic rate is currently at 12.25% but the market anticipates the benchmark rate to reach 9% by the end of the year as inflation is expected to return within the BCB's target range of 4.5% +/-1.5%.
All in all, looking at the hard data it seems as though Brazil is on the right track, however on the domestic side, the political situation is in complete upheaval and the uncertainty that stems from it should prevent the real from returning quickly towards its pre-recession levels. Moreover, the austerity measures planned by the government will further delay a speedy recovery as the lower classes of the Brazilian society are losing purchasing power. On the other hand, it will restore confidence and attract foreign investments. In the short-term BRL gains cannot be ruled out as investors are still chasing returns and Brazil's temporary stability is quite attractive. Nevertheless, the market is in wait-and-see mode and has slightly shifted to risk-off.
Economics - UK: The Exit Process Has Finally Begun
Nine months after the Brexit vote, Theresa May has finally started the exit process by triggering Article 50 of the Lisbon Treaty. The UK Prime Minister has spoken in front of the House of Commons last Wednesday. A letter has then be delivered by 1.30pm to Donald Tusk. Negotiations should last at least two years but the UK will still benefit many bilateral agreements in the meanwhile.
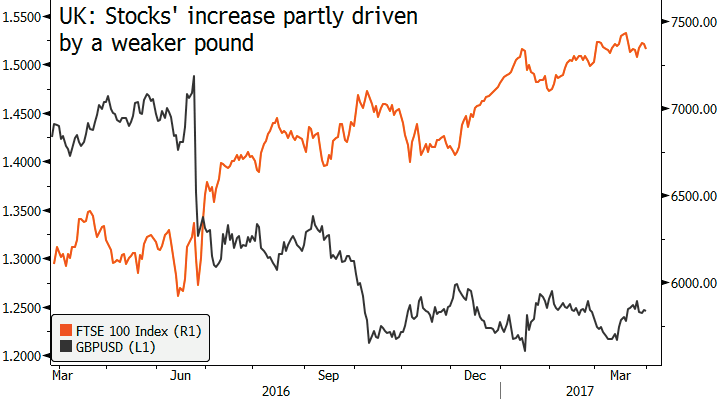
The pound fell the day before from 1.2460 to 1.2380 against the dollar. In our view, we believe that the markets are still overly pessimistic about the UK situation. Recent economic data is improving, but we also believe that the pound should appreciate in the medium-term. It is clear that economists widely missed the target with their doomsday prophecies and ironically, it is this very market pessimism that is supporting the UK economy by increasing the competitiveness of its exports.
Now that Brexit is officially a done deal, the next questions will revolve around the nature and tone of negotiations. 27 counterparts must accept and agree with the UK's terms with each country holding a veto over these conditions. It is for this reason that it is so difficult for countries to renegotiate treaties in general. For this reason, we find the promise to renegotiate treaties somewhat scammy.
Last week, in the two days following the triggering of Article 50, the Footsie 100 has risen and is now trading 16% higher than pre-Brexit levels. It makes the increase even more impressive since the 2016 Brexit vote also sparked a sell-off
Now our view for the negotiations is that we believe there won't be any hard Brexit. It is nonetheless clear that negotiations will be tough with all members having to agree on the final deal, which means that the next two years will be a serious rollercoaster ride.
We are also bullish on the pound which we should further appreciate this year. Strengthening of the pound is now very likely especially as Europe faces a veritable minefield with the upcoming French and German elections. Time to reload GBP.
Themes Trading - Swiss Small Gems
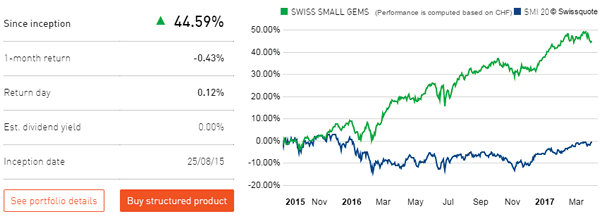
Switzerland's stability has provided ideal soil for global brands to develop. The Swiss National Bank's commitment to hold interest rates negative "for some time" should convince domestic savers to move their savings into stocks while allowing the Swiss franc to further devalue. With a weaker Swiss franc, companies will regain some of the competitive edge they have lost. However, Swiss companies rely more on brand quality and innovation than on pure price competitiveness. Outside the blue chip names are small cap companies that are perfect for value investors, offering a P/E of 15x (compared with 18x for US small caps) and attractive dividend yields.
This theme was built using companies with market capitalizations below CHF 2 billion, P/E less than 18 and used a standard GARP (growth-at-areasonable price) model to uncover the most attractive stocks.
Swiss Small Gems theme can now be trading in an easy to execute Strategic Certificate.
Trade Idea Wrap-up: USD/CHF – Buy at 0.9950
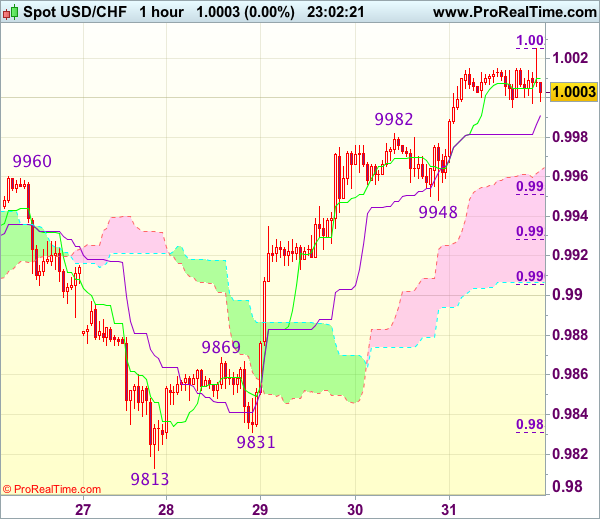
USD/CHF - 1.0006
Most recent candlesticks pattern : N/A
Trend : Near term up
Tenkan-Sen level : 1.0010
Kijun-Sen level : 0.9991
Ichimoku cloud top : 0.9963
Ichimoku cloud bottom : 0.9907
Original strategy :
Buy at 0.9950, Target: 1.0050, Stop: 0.9915
Position : -
Target : -
Stop : -
New strategy :
Buy at 0.9950, Target: 1.0050, Stop: 0.9915
Position : -
Target : -
Stop : -
As the greenback has eased after rising to 1.0025 in NY morning, suggesting minor consolidation below this level would be seen and pullback to 0.9980 cannot be ruled to, however, reckon 0.9948-51 (previous support and 38.2% Fibonacci retracement of 0.9831-1.0025) would limit downside and bring another rise later, above said resistance at 1.0025 would extend the rise from 0.9813 towards previous support at 1.0060 (now resistance) but loss of upward momentum should prevent sharp move beyond resistance at 1.0109.
In view of this, would not chase this rise here and would be prudent to buy dollar on pullback as said support at 0.9948 should limit downside. Below 0.9925-30 (50% Fibonacci retracement of 0.9831-1.0025) would abort and signal top is formed instead, bring correction to 0.9905 (61.8% Fibonacci retracement) but reckon previous resistance at 0.9869 would hold from here.
Trade Idea Wrap-up: GBP/USD – Stand aside
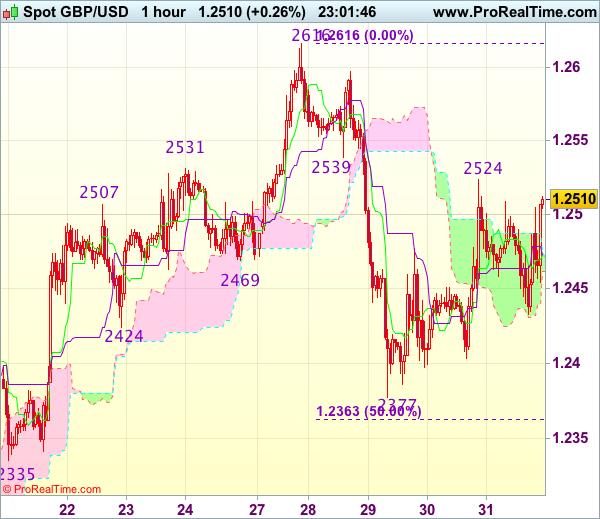
GBP/USD - 1.2511
Most recent candlesticks pattern : N/A
Trend : Near term up
Tenkan-Sen level : 1.2476
Kijun-Sen level : 1.2476
Ichimoku cloud top : 1.2476
Ichimoku cloud bottom : 1.2462
New strategy :
Stand aside
Position : -
Target : -
Stop : -
As cable has rebounded again after finding support at 1.2433, retaining our view that further consolidation above this week’s low at 1.2377 would be seen and another bounce to 1.2524 and possibly 1.2550 cannot be ruled out, however, as broad outlook remains consolidative, reckon upside would be limited to 1.2575-80 and price should falter below 1.2600, bring retreat later.
On the downside, whilst pullback to the Kijun-Sen (now at 1.2478) cannot be rued out, reckon downside would be limited to 1.2450 and said support at 1.2433 should hold. Only break of 1.2433 support would revive bearishness and suggest the rebound from 1.2377 has ended, bring weakness to 1.2400, break there would confirm and retest of 1.2377 would follow.
Trade Idea Wrap-up: EUR/USD – Sell at 1.0765
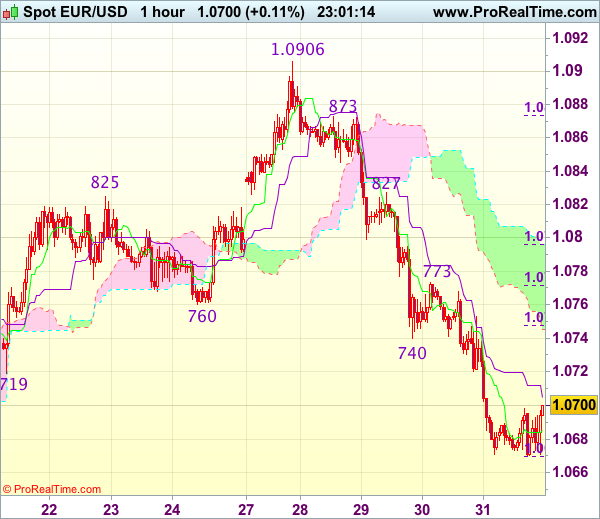
EUR/USD - 1.0690
Most recent candlesticks pattern : N/A
Trend : Near term down
Tenkan-Sen level : 1.0686
Kijun-Sen level : 1.0705
Ichimoku cloud top : 1.0796
Ichimoku cloud bottom : 1.0745
Original strategy :
Sell at 1.0745, Target: 1.0645, Stop: 1.0780
Position : -
Target : -
Stop : -
New strategy :
Sell at 1.0765, Target: 1.0645, Stop: 1.0800
Position : -
Target : -
Stop : -
As this week’s selloff has kept euro under pressure, adding credence to our bearish view that top has been formed at 1.0906 and bearishness remains for the decline from there to extend further weakness to 1.0660, then 1.0640, however, near term oversold condition would limit downside and reckon previous strong support at 1.0600 would hold from here, bring rebound later.
In view of this, would not chase this fall here and would be prudent to sell dollar on recovery as 1.0765-70 should limit upside. Only a firm break above resistance at 1.0773 would suggest low is formed instead, bring a stronger rebound to 1.0800 but resistance at 1.0827 should remain intact.
Trade Idea Wrap-up: USD/JPY – Stand aside
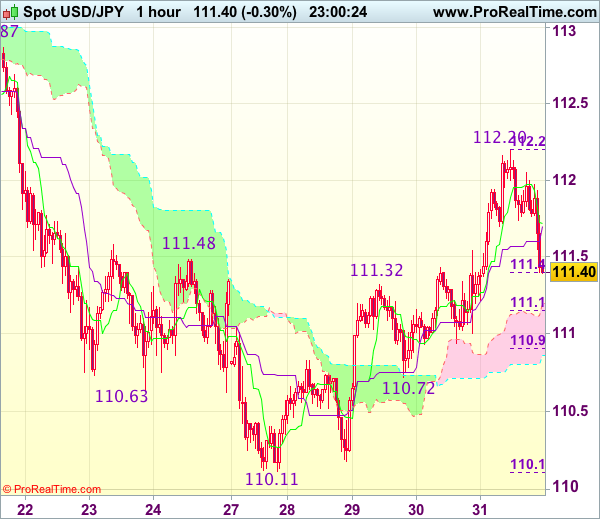
USD/JPY - 111.47
Most recent candlesticks pattern : N/A
Trend : Near term up
Tenkan-Sen level : 111.72
Kijun-Sen level : 111.70
Ichimoku cloud top : 111.20
Ichimoku cloud bottom : 110.86
Original strategy :
Buy at 111.30, Target: 112.30, Stop: 110.95
Position : -
Target : -
Stop : -
New strategy :
Stand aside
Position : -
Target : -
Stop : -
As the greenback has retreated after intra-day initial rise too 112.20, suggesting top has possibly been formed there and downside risk is seen for weakness to 111.10-15 (50% Fibonacci retracement of 110.11-112.20), however, break of 110.91 (61.8% Fibonacci retracement) is needed to add credence to this view, bring further fall to support at 110.72 first.
On the upside, expect recovery to be limited to 112.00 and said resistance at 112.20 should hold from here, bring another retreat. Only break of resistance at 112.20-26 would revive bullishness and extend the rise from 110.11 to 112.50-55 but price should falter below previous resistance at 112.87-90, bring retreat later. As near term outlook has turned mixed, would be prudent to stand aside for now.
Trade Idea: EUR/GBP – Sell at 0.8620
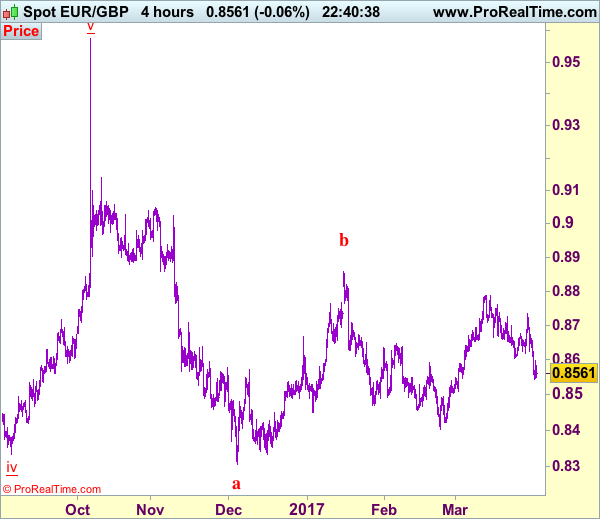
EUR/GBP - 0.8586
Recent wave: Major double three (A)-(B)-(C)-(X)-(A)-(B)-(C) is unfolding and 2nd (A) has possibly ended at 0.6936.
Trend: Near term down
Original strategy :
Sell at 0.8620, Target: 0.8520, Stop: 0.8660
Position : -
Target : -
Stop : -
New strategy :
Sell at 0.8620, Target: 0.8520, Stop: 0.8660
Position : -
Target : -
Stop : -
As the single currency has remained under pressure after this week’s selloff, adding credence to our view that top has been formed at 0.8788 and downside bias remains for the fall from there to bring retracement of early upmove, hence further weakness to 0.8520-25 would be seen, however, oversold condition should prevent sharp fall below 0.8509 support, risk from there has increased for a rebound to take place later.
In view of this, we are looking to sell euro on recovery as 0.8620-25 should limit upside. Only above 0.8660-65 would defer and suggest low is possibly formed, risk rebound to 0.8680, then 0.8700 but price should falter below said resistance at 0.8735, bring further choppy trading later.
Our preferred count is that, after forming a major top at 0.9805 (wave V), (A)-(B)-(C) correction is unfolding with (A) leg ended at 0.8400 (A: 0.8637, B: 0.9491 and 5-waver C ended at 0.8400. Wave (B) has ended at 0.9413 and impulsive wave (C) has either ended at 0.8067 or may extend one more fall to 0.8000 before prospect of another rally. Current breach of indicated resistance at 0.9043 confirms our view that the (C) leg has ended and bring stronger rebound towards 0.9150/54, then towards 0.9240/50.
Trade Idea: USD/CAD – Hold short entered at 1.3340
USD/CAD - 1.3337
Recent wave: Only wave v of c has ended at 0.9407 and wave C of major A-B-C correction is underway for headway to 1.4700
Trend: Near term up
Original strategy :
Sold at 1.3340, Target: 1.3200, Stop: 1.3400
Position: - Short at 1.3340
Target: - 1.3200
Stop: - 1.3400
New strategy :
Hold short entered at 1.3340, Target: 1.3200, Stop: 1.3400
Position: - Short at 1.3340
Target: - 1.3200
Stop:- 1.3400
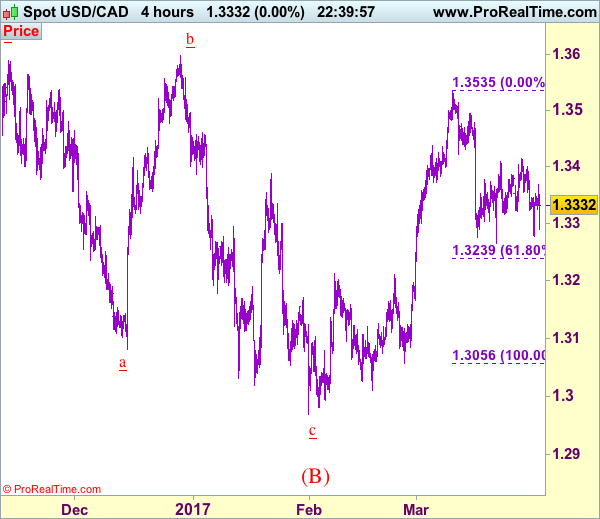
As the greenback rebounded after holding above indicated previous support at 1.3264, suggesting further consolidation would be seen, however, reckon upside would be limited to 1.3370 and bring another decline, below said support at 1.3264 would add credence to our view that top has been made at 1.3535 earlier this month, bring further fall to 1.3235-40 (61.8% Fibonacci retracement of 1.3056-1.3535) and then 1.3200-10, however, oversold condition should limit downside and reckon 1.3170 would hold from here.
In view of this, we are holding on to our short position entered at 1.3340. Above 1.3400 would risk the stop resistance at 1.3415 but break there is needed to signal low is formed and shift risk back to upside for a stronger rebound to 1.3450 and possibly test of resistance at 1.3479, however, only break of 1.3495 resistance would indicate the pullback from 1.3535 has ended and bring retest of this level later.
To recap, wave B from 1.3066 is unfolding as an a-b-c and is sub-divided as a: 1.2192, b: 1.2716 and wave c is a 5-waver with i: 1.1983, ii: 1.2506, extended wave iii with minor iii at 1.0206, wave iv ended at 1.0781 and wave v as well as wave iii has ended at 0.9931, hence the subsequent choppy trading is the wave iv which is unfolding as (a)-(b)-(c) with (a) leg of iv ended at 1.0854, followed by (b) leg at 1.0108 and (c) leg as well as the wave iv ended at 1.0674. The wave v is sub-divided by minor wave (i): 0.9980, (ii): 1.0374, (iii): 0.9446, (iv): 0.9913 and (v) as well as v has possibly ended at 0.9407, therefore, consolidation with upside bias is seen for major correction, indicated target at 1.3700 and 1.4000 had been met and further gain to 1.4700 would be seen later.
Solid Gain in February Personal Income, But Inflation Rising
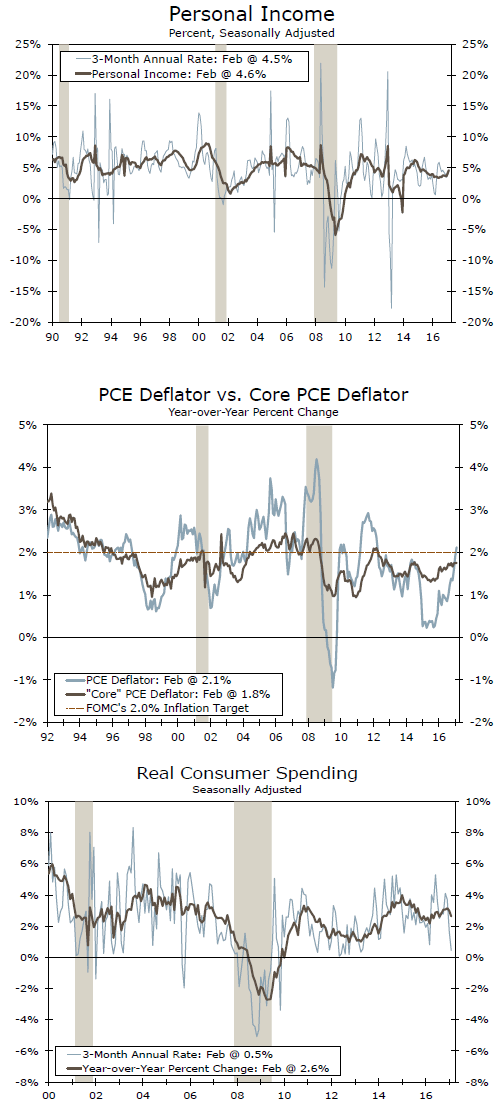
Unseasonably warm weather in February held down spending in February, but income gains suggest the weakness should be temporary. Inflation continues to firm and has returned to the Fed's target.
Income Solid, While Spending Held Down by Utilities
As expected, income among U.S. households posted another solid gain in February. Personal income rose 0.4 percent, while income growth for January was revised up a tick to 0.5 percent. With strong payroll gains and an uptick in average hourly earnings last month, income from wages & salaries rose a touch ahead of the headline in February.
Spending, on the other hand, came in a bit below expectations, increasing just 0.1 percent. Weakness in utilities consumption once again depressed the headline; this year was the second warmest February in the contiguous U.S. since records began back in 1895. In addition, a near 3 percent drop in gasoline & energy prices depressed nominal consumption on energy goods over the month. The upshot of the weakness in spending is that the saving rate rose to a four-month high of 5.6 percent.
At Last, Inflation Reaches the Fed's Target
Inflation showed further signs of firming in February. Headline inflation is now above the Fed's 2.0 percent target for the first time since 2012. The PCE deflator ticked up just 0.1 percent on a drop back in energy prices over the month, but the year-over-year rate rose to 2.1 percent as energy prices have rebounded more than 30 percent over the past year.
Core inflation posted another solid monthly gain, up 0.2 percent. Revisions to previous months' data pushed the year-ago rate up to 1.8 percent, while over the past three months core inflation is rising within a hair of the Fed's target at 1.9 percent. Although still below the Fed's goal, the upward momentum should be enough for the Fed to hike again in June.
While inflation is now back to levels more palatable to the Fed, the upturn has taken a bite out of real consumer spending. After adjusting for inflation, personal spending fell for a second straight month in February and has slowed to a 1.9 percent pace over the past three months.
Currently, it looks like real personal consumption is on track to expand around 2 percent in the first quarter. This would mark a slowdown from Q4 after yesterday's GDP revision showed consumer spending expanded at a 3.5 percent clip - noticeably stronger than the 3.0 percent pace previously estimated.
Spending Should Strengthen from Here
The soft spending numbers look at odds with the recent surge in consumer confidence measures. However, given the weather-related weakness in utilities spending as well as some delays in tax refunds for low- and middleincome earners in February, we expect real consumer spending to strengthen in the quarters ahead. In addition to the elevated readings of consumer confidence, hiring remains solid while average hourly earnings are picking up, which will support income and spending.
RBA Policy Meeting, US Jobs Report, FOMC Minutes, Other Key Data in Focus
Next week's market movers
- In Australia, we expect the RBA to remain on hold and maintain its neutral bias. However, we see the risks as skewed towards a more dovish narrative.
- In the US, the employment report for March could prove critical to market expectations regarding the timing of the next Fed hike. The minutes from the latest FOMC meeting will also be in focus.
- In Japan, we expect the Tankan survey for Q1 to reveal rising business optimism.
- We also get key economic data from the UK, the US, and Canada.
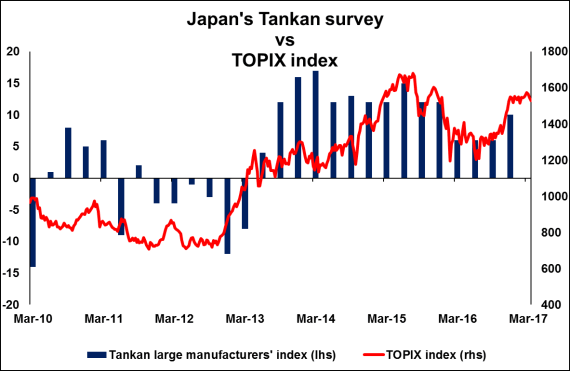
On Monday, during the Asian morning, the Bank of Japan will release its Tankan business confidence survey for Q1. This is perhaps the most important indicator that comes out from Japan and thus, it will be closely watched. No forecast is available, but bearing in mind that the Reuters Tankan Diffusion Index rose notably in all three months of the quarter, we expect the official indices to move in a similar fashion. This could signal that Japanese firms are feeling more optimistic, something that we believe may be related to the notable depreciation of the yen following the US election late last year. We expect Japanese equity markets to benefit from such a strong report, as it may be a signal that GDP growth is set to pick up steam moving forward. Something like that could also generate some speculation that the BoJ may gradually begin thinking about a slight reduction in its massive stimulus program at its upcoming meetings. However, as long as Japan's headline and core inflation rates remain stuck near zero, we do not expect anything like that to happen, as the Bank would not want to undermine the effectiveness of its previous easing measures by triggering a tightening in financial conditions.
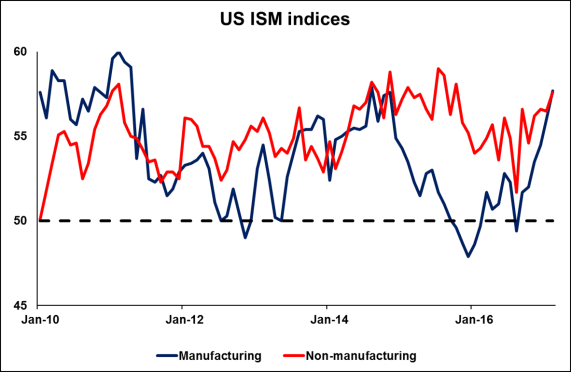
From the US, we get the ISM manufacturing PMI and thereafter on Wednesday, we get the non-manufacturing index, both for March. Both figures are forecast to decline somewhat, but to still remain well above the key 50 barrier that separates expansion from contraction. Despite the potential declines, given that these indices are expected to remain at very healthy levels, we doubt that they will have a material effect on market pricing regarding the timing of the next FOMC rate hike.
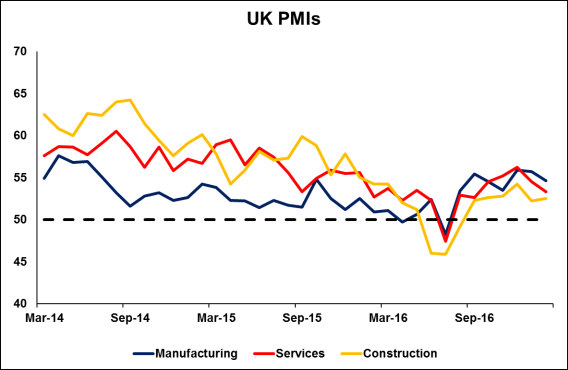
From the UK, we will get the manufacturing PMI for March. Then on Tuesday, we will get the construction index for the month and subsequently on Wednesday, the services figure. No forecast is available for any of these indices. The manufacturing and services indices declined somewhat in February, though they still remained safely above the critical 50 level. The most interesting part of these reports was related to inflation. The service-sector survey, which accounts for the vast majority of the UK economy, showed that prices charged rose at the fastest pace since 2008. It would be interesting to see whether this continued in March, as it could increase speculation for further acceleration in inflation. The latest commentary from BoE policymakers suggests that the Bank is in no hurry to raise rates, despite signs that inflationary pressures are picking up rapidly. As such, we do not expect the BoE to actually hike in coming months, at least not until the Brexit negotiating landscape becomes clearer. We do however believe that further acceleration in inflation could lead to some more hawkish dissents among the Committee, perhaps as early as at the summer meetings.
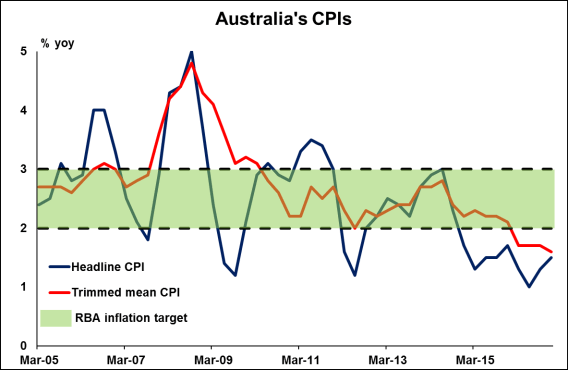
On Tuesday, during the Asian session, the Reserve Bank of Australia will announce its rate decision. The forecast is for the RBA to remain on hold once again, a view that we share considering the neutral tone the Bank has maintained in all of its recent communications. At the latest meeting, the RBA reiterated that underlying inflation is expected to stay low for some time, while in the minutes of that gathering, we saw that the Bank is also worried that the labor market may not be as strong as the headline employment figures indicate. Even though these signals were relatively dovish, they were balanced by a repetition that high housing prices continue to pose risks to financial stability and that any more rate cuts could amplify such risks further. Since that gathering, the only major piece of economic data we got was the unemployment rate for February, which rose. However, considering that employment indicators tend to be volatile on a monthly basis, we don't expect a single data point to alter the Bank's overall bias. Having said that, we think that the risks are tilted towards a more dovish narrative from the RBA. If employment indicators continue to deteriorate, the Bank could lean more towards actually cutting rates, and simultaneously introduce macro-prudential measures in the housing market to limit financial stability risks.
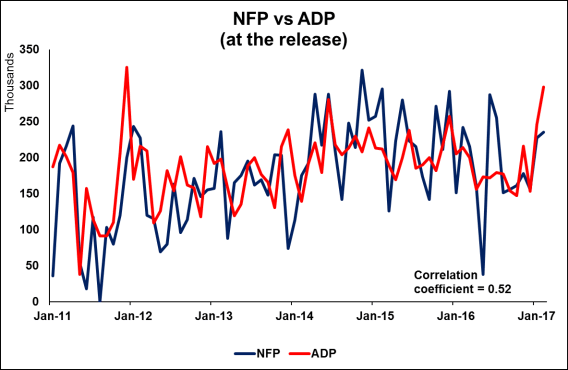
On Wednesday, we get the US ADP employment report for March. The private sector is expected to have added 194k jobs, less than the 298k in February, though still a strong number that is likely to raise speculation for the NFP figure to meet its forecast of 185k. We see the case for the ADP number to be higher than the NFP print as reasonable, considering that Trump's federal hiring freeze is very possible to have led to diminishing hiring in the public sector.
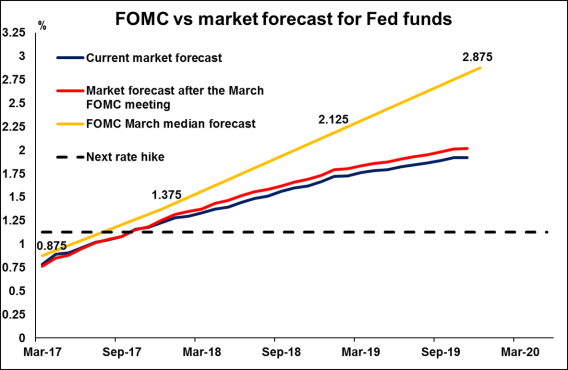
Later during the day, the Fed will release the minutes of the March FOMC meeting, where the Committee raised interest rates by 25bps, as was very widely expected. However, the signals we received were not as hawkish as one would have expected given how quick this hike was compared to the time elapsed between the first two of this hiking cycle. Firstly, Minneapolis Fed President Neel Kashkari added a dovish touch by dissenting the decision. What's more, even though the Fed upgraded its forecasts for the US economy, the "dot plot" was left largely unchanged, and Chair Yellen shifted to a much more cautious tone in her press conference compared to her latest appearances. The key message we got was that this hike does not reflect heightened optimism on the economic outlook, and does not imply that future rate hikes will be faster than previously anticipated. It would be interesting to see whether the tone of the minutes is equally cautious, as something like that could push somewhat back market expectations regarding the timing of the next rate hike. However, we believe that Friday's employment data will probably be a much bigger determinant of when investors will anticipate the Fed's next move (see below).
We also get the US ISM non-manufacturing PMI for March, as well as the UK services PMI for the same month, as we noted above.
On Thursday, we have a relatively light day, no major events or indicators due to be released.
On Friday, the US employment report for March will take center stage. The forecast is for nonfarm payrolls to have risen by 185k, less than the robust 235k in February, but still a solid number consistent with further tightening in the jobs market. The unemployment rate is forecast to have held steady at 4.7%, while average hourly earnings are expected to have risen at the same pace as previously in monthly terms. This would likely be one more set of data entering the basket of those supporting another near-term Fed rate hike. According to the Fed funds futures, the market is currently pricing in the next hike to come in September. So, a solid employment report could bring those expectations forward, perhaps to anticipate such action in summer months.
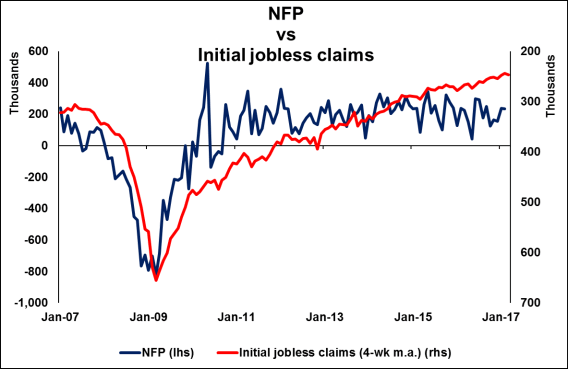
We also get employment data for March from Canada.