Sample Category Title
Weekly Focus: US Labour Market Report in Focus
Market movers ahead
- In the US, the key event of next week is Friday's labour market report. We forecast it will show a total of 160,000 new jobs, an unchanged unemployment rate of 4.7% and monthly wage growth of 0.2% m/m. The week also brings ISM manufacturing for March and a number of speeches by FOMC members.
- In the euro area, ECB minutes will be scrutinised by markets for clues on whether a rate hike before QE termination is on the cards. We do not think so. The week also brings the monthly labour markets report, retails sales and German factory orders.
- In the UK, PM Theresa May triggered Article 50 this week, meaning Brexit negotiations have officially started and we are likely to begin to get more headlines about what to expect of the negotiations in coming weeks and months. For more information on what happens next, see Brexit Monitor No. 27: Brexit negotiations set to start today - what now? 29 March. The week also brings PMIs and the NIESR GDP estimate.
- In China, focus is on Caixin manufacturing PMI on Monday. The official PMI manufacturing on Friday surprised a bit on the upside and pointed to continued strong growth in March. We look for a rise to 52.0, from 51.7 in February.
- In the Scandi area, the key releases are currency reserve data from Danmarks Nationalbank and industrial production releases for Norway, Sweden and Denmark.
Global macro and market themes
- The EU favours a multi-speed Europe - progress will depend on upcoming elections.
- Italy is the big worry - expect the EU to get tougher on its debt and banking problems.
- Greece has become a political issue between the EU and the IMF but do not expect a summer-2015 scenario.
- In our view, the ECB is unlikely to raise rates before late 2018 at the earliest.
EUR/USD Stabilizes Near Week Low
Headlines
European stock markets opened lower, but traded with a minor upward bias, erasing those opening losses. US equities opened abound 0.25 % lower, but show no clear trend after the open.
The PCE deflator moved above the Fed's 2% inflation target for the first time since Q1 2012. The measure rose from 1.9% Y/Y to 2.1% Y/Y, while the core PCE stabilised at an upwardly revised 1.8% Y/Y. Both figures were in line with expectations.
US consumer spending rose less than forecast in February (0.1% M/M) even as wage growth improved (0.4% M/M). The Chicago PMI increased from 57.4 to 57.7 in March, while a small decline to 56.9 was expected.
NY Fed Dudley repeated that a couple more rate hikes this year seems reasonable. He puts risks for growth and inflation on the upside because of the expected fiscal stimulus boost. Additionally, he said that balance sheet rolloffs could start late 2017.
Eurozone inflation readings disappointed in March. Both headline and core CPI rose at a much slower pace than in February and than expected. Headline CPI printed at 1.5% Y/Y (from 2% Y/Y) and core CPI at 0.7% Y/Y (from 0.9% Y/Y). The slowdown was partly related due to the timing of the Easter holiday.
German unemployment dropped by another 30,000 this month - three times better than expected and driving the country's jobless rate to 5.8%. That's the lowest since it became a reunified country in 1991 and down from 5.9%.
The ECB's policy guidance, including the expected order of its next steps, remains valid for now but could change if inflation fundamentals warrant, ECB Executive Board member Coeure said.
EU leaders are preparing a tough opening stance in Brexit talks, explicitly stating that Britain must accept the bloc's existing laws, court, and budget fees if it seeks a gradual transition out of the single market. The EU won't agree to any future trade pact with the UK until after Britain leaves the bloc.
Spain's minority government is expected to offer public sector pay rises and more social spending in its muchdelayed draft budget for 2017, steering further away from years of austerity as it tries to get the opposition to back the bill.
Rates
Dispersion between EMU and US inflation ignored
Global core bonds had every right to react to EMU and US inflation data, but they didn't. EMU inflation increased at a much slower pace (1.5% Y/Y) than forecast (1.8% Y/Y) and than in February (2% Y/Y) while also core inflation slowed down (0.7% Y/Y from 0.9% Y/Y). The data were partly influenced by the timing of Easter holidays, but nevertheless fend off speculation on an early ECB exit. ECB's Coeuré was the first board member to question the sequence of the normalisation process (tapering vs hiking), but his comments were ignored. US inflation today printed in line with expectations with the PCE deflator rising above the Fed's 2% inflation goal for the first time since Q1 2012. It turned out to be a dull pre-weekend session until NY Fed Dudley hit the wires for a second day running. He echoed comments by Cleveland Fed Mester yesterday, saying that the Fed could start letting its balance sheet run-off late 2017. One could expect a bear steepening on such quotes, but instead the US curve bull steepened (5yr to 30yr) as Dudley added that normalizing the balance sheet is a substitute for rate hikes. US Treasuries ticked slightly higher after his comments.
At the time of writing, changes on the German yield curve range between +0.2 bps (2-yr) and -1.4 bps (5-yr). Changes on the US yield curve vary between +0.3 bps (30-yr) and -3 bps (5-yr). On intra-EMU bond markets, 10-yr yield spread changes versus Germany range between -1 bp and +3 bps. The 16 bps Italian spread widening is due to a BB benchmark change.

Currencies
EUR/USD stabilizes near week low
EUR/USD entered calmer waters today even as the EMU inflation slowed much more than expected. The news was apparently discounted. EUR/USD hovered in a tight range in in the high1.06 area. USD/JPY failed to sustain yesterday's rebound and the rise in core yields and the equity rally did ran into resistance.
Overnight, Asian equities traded mixed with Japan and China initially outperforming. However, the daily momentum faltered as the session proceeded. Japanese eco data were mixed with the headline February CPI slightly higher than expected at 0.3% Y/Y. USD/JPY tried to regain the 112 barrier, but the pair already traded back below the big figure at the start of the European session. So, the impact of yesterday's hawkish comments from Fed Dudley on USD/JPY was far from spectacular. EUR/USD hovered near yesterday's lows (1.0675 area).
The EMU eco data were interesting with the German unemployment rate declining to a record low of 5.8%. This good news was balanced by EMU inflation slowing sharply from 2.0% Y/Y in February to 1.5% Y/Y in March. Core inflation also eased to a low 0.7% Y/Y. The reaction of European interest rate markets and of the euro was very limited. The news was already discounted after yesterday's German data. EUR/USD hovered in a tight range near the 1.0675 pivot.
US data also didn't help to inspire any end-of-week/quarter activity. The personal income and spending data were almost exactly in line with expectations (including the close watched PCE deflators). USD/JPY trades currently is the 111.70 area. EUR/USD is holding in the 1.0675 area.

Sterling taking a breather
Today's UK eco data were interesting but hardly impacted sterling trading. The final UK Q4 GDP printed at 0.7% Q/Q and 1.9% Y/Y. However, details suggested a softening in consumer spending even as the savings ratio declined. On the other hand, net exports made a substantial positive contribution to growth. This was illustrated by a bigger than expected decline in the UK current account deficit. Looking forward, the questions is whether exports (supported by a weaker sterling) will continue to compensate for a slowdown in domestic spending as the Brexitprocedure continues. In a guideline for the Brexit-negotiations, EU Tusk indicated that enough progress has to be made on issues regarding the separation process before talks on future trade relations can start. The eco data were mixed for markets/sterling. The EU-approach is not the start the UK wants, but is no surprise. At least for now, sterling holds strong. EUR/GBP hovers near the recent lows (currently 0.8560 area), but this also still partially euro softness. Cable hovered mostly in the higher half of the 1.24/lower 1.25 big figure. Tentative signs of GBP consolidation?

Personal Income Up Nicely, But Spending Pulled Back in February
Personal income rose 0.4% (month-on-month) in February. Removing taxes and inflation real disposable personal income was up just half that pace at 0.2%.
Personal spending was up a modest 0.1% in nominal terms, and actually fell 0.1% after removing price effects. This poor showing follows a 0.2% decline in real spending in January.
By component, spending on services fell for a second straight month (-0.14%), durables sales were flat (-0.05%), and non-durables inched up 0.1%.
Consumer prices rose 0.2%, pushing headline inflation (year-on-year) up to 2.1% (from 1.9% in January). Core prices (excluding food and energy) also rose 0.1% (m/m), and accelerated to 1.8% in February (from 1.7%).
The personal saving rate rose to 5.6% from a downwardly revised 5.4% in January
Key Implications
After a knock-out quarter end to last year, consumers tightened their purse strings at the start of this one. Real consumer spending looks to advance by less than 1% (annualized) in the first quarter after a 3.5% gain in the fourth quarter of 2016. So, just like last year, 2017 year is likely to start with a thud in terms of real GDP growth.
And just like last year, it is likely to be a temporary setback. Weather and delayed tax rebates likely played a part and with strong consumer confidence and strengthening income growth, we fully expect spending to bounce back in the second quarter, restoring economic growth to an above trend rate.
Notably, inflation continues to push higher with the core rate moving to 1.8%, in striking distance of 2%. With this inflationary backdrop in place, the Federal Reserve is likely to look past the temporary setback in economic growth and continue to normalize monetary policy.
A Great Start to 2017 for the Canadian Economy
The Canadian economy recorded a third straight monthly expansion with output rising 0.6% month-on-month in January. Growth was fairly widespread, with 15 of the 20 major industries reporting gains.
The goods producing sectors performed well, up 1.1% as a whole. Output was supported by the manufacturing sector (+1.9%), with a particularly strong performance recorded among durables manufacturers (+2.0%). Mining, quarrying, and oil and gas extraction came back from December's 0.5% contraction, with output growing 1.9% in January.
Services-producing industries were up by 0.4% month-on-month in aggregate - a 17th straight monthly gain. Particularly strong performances were recorded among wholesalers (+2.4%), and retailers (+1.5%), as the latter more than offset December's pullback. Accommodation and food services also performed well, rising 0.9% to end three months of prior contractions.
Key Implications
The hits just keep on coming. Although it is still early days and risks abound, signs are pointing to an economy that looks increasingly poised to shake off the setbacks of recent years.
Indeed, while our initial expectations of first quarter growth were for a repeat of the prior quarter's 2.6% expansion (q/q, annualized), data to date suggest an even healthier start to the year. Incorporating today's data moves our tracking for first quarter GDP growth to 3.4%, putting Canada on track for the strongest yearly start since 2013.
The recent spate of positive Canadian economic data will likely feed through to the Bank of Canada's forecasts as well. We expect their growth outlook to be revised higher in the next Monetary Policy Report (on April 12th). The upgraded outlook is not expected to be matched by a change in the tone of the accompanying statements however. Rather, the dovish bent that has typified recent communication should remain intact, consistent with Governor Poloz's comments in a Q&A session earlier this week. During a public appearance, the Governor continued to point to sizeable economic slack in the Canadian economy, and also noted that Canada has seen a few 'false starts' in recent years. All told, we remain of the view that the monetary policy interest rate is not likely to be raised from its current 0.50% level until late next year.
US Consumer Spending Disappointed in February
Highlights:
- US personal consumption expenditures (PCE) edged up 0.1% in February, but excluding price effects, the volume of spending (real PCE) fell for a second consecutive month.
- Market expectations were for a slightly stronger increase in both nominal and real spending.
- Upward revisions to real PCE in three of the prior four months take some of the sting out of the disappointing February number.
- Personal incomes rose 0.4% thanks to solid job and wage growth in February.
- PCE inflation rose to 2.1% year-over-year, the fastest pace since 2012. Prices excluding food and energy were 1.8% higher than a year ago, again matching the highest rate since 2012
Our Take:
The disappointing decline in real PCE in February is offset somewhat by upward revisions to previous months, although there is no hiding the fact that spending has slowed early this year relative to the impressive pace recorded through much of 2016. We are now monitoring consumer spending growth of around 1% in Q1, which would trim our GDP forecast for the quarter to 1.7% from 2.0% previously. Some of this slowdown reflects temporary factors, particularly a decline in utilities spending amid mild winter weather, while payback for strong gains in earlier months may also have been at play. It isn't hard to come up with factors supporting US households -strong job growth and rising wages, rising home prices and equity markets, and the prospect of lower income taxes have all contributed to a pickup in consumer confidence in recent months -so soft consumer spending isn't expected to last. We look for quarterly gains in the 2½% range going forward, supporting above-trend growth in GDP this year.
For the Fed, today's PCE report will be a disappointment but we think they too will maintain a constructive view on household spending in the face of Q1's slowdown. The bigger takeaway from today's data was arguably firmer PCE inflation, both in the headline and core measures. Progress toward their 2% inflation objective will keep the Fed on their plotted course for gradual rate hikes - we expect another two this year following March's 25 basis point increase.
Canadian GDP Jumps 0.6% in January
Highlights:
- Canadian January GDP jumped 0.6% in the month which was double the 0.3% expected going into the report. This represented the third consecutive month of stronger-than-expected monthly gains with GDP rising 0.3% in December and 0.5% in November.
- Goods-producing industries jumped 1.1% with manufacturing output soaring 1.9% and mining up a similar 1.9%. Rising energy and non-energy commodity prices were a factor in the strength in both sectors. These increases were tempered by mild winter temperatures sending utilities down 1.3%.
- Growth in service-producing industries rose a stronger-than-expected 0.4%, led by wholesale trade jumping 2.4% with the retail trade sector up 1.5%.
Our Take:
The increase in January GDP represents the third consecutive month of robust gains. It contributed to the year-over-year rate jumping to 3.1% in January relative to 2.0% in Q4 and an average of 1.1% over the first three quarters of 2016. The upward trend in this rate in part reflects oil and gas sector activity starting to contribute to growth though it also reflects an improving trend non-oil and gas commodities and continued steady gains in non-commodity-related sectors. This broadening in economic strength is expected to contribute to GDP growth continuing at an above-average pace soaring to likely 4.0% in the first quarter following stronger-than-expected gain of 2.6% in the fourth quarter. The expected increase in Q1 would be well above the 2.5% projected by the Bank of Canada in its January forecast with Q4 growth also well above the Bank's 1.5% forecast. Thus domestic conditions are seemingly pointing to the reduced need for stimulus. However, recent comments by Governor Poloz are not indicative of policy poised to change with some doubt expressed as to the sustainability of the recent stronger-than-expected data. As well, uncertainty about the potential increase in trade protectionism by the Trump Administration presents a downside risk to growth going forward and reason to keep policy very accommodative. Our forecast does assume an eventual hike in the overnight rate from the current 0.50% though not until the second quarter of 2018 with uncertainty about external trade weighing on growth through the remainder of this year.
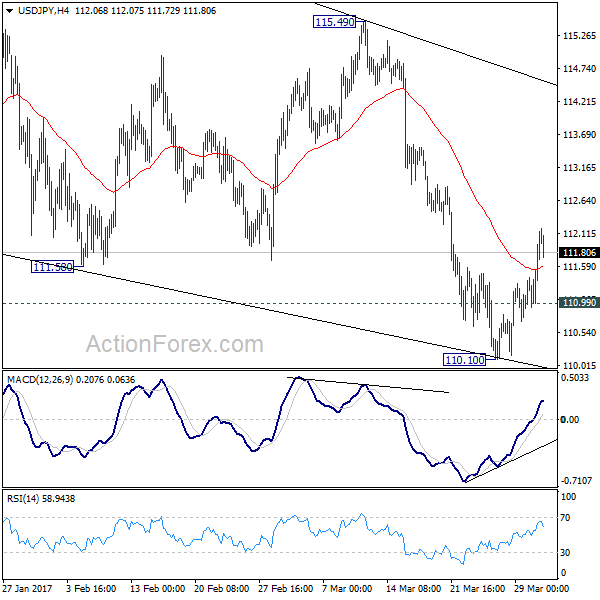
USD/JPY Mid-Day Outlook
Daily Pivots: (S1) 111.26; (P) 111.60; (R1) 112.27; More....
Intraday bias in USD/JPY remains on the upside as rebound 110.10 short term bottom should extend higher to 55 day EMA (now at 112.91). Sustained break there will raise the chance of near term reversal and target 115.49 resistance for confirmation. On the downside, though, below 110.99 minor support will turn bias back to the downside for 110.10 and break will extend the corrective fall from 118.65.
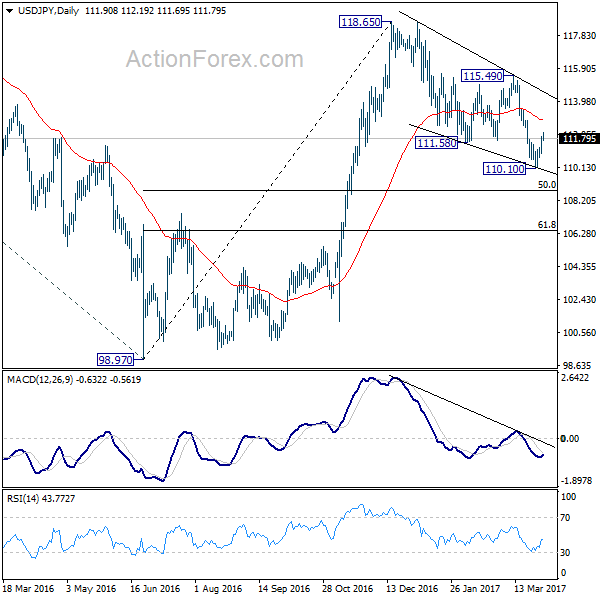
In the bigger picture, price actions from 125.85 high are seen as a corrective pattern. sustained trading below 55 week EMA (now at 111.11) will indicates that such consolidation is not completed. And another fall would be seen back to 98.97 as the third leg. In that case, downside would be contained by 61.8% retracement of 75.56 to 125.95 at 94.77 to complete the correction. On the upside, above 115.49 will extend the rise from 98.97 to retest 125.85 first. Overall, up trend from 75.56 is expected to resume after the consolidation from 125.85 completes.
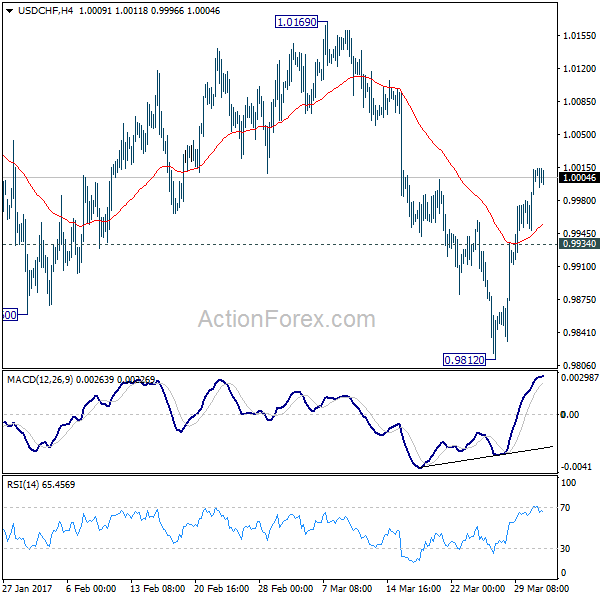
USD/CHF Mid-Day Outlook
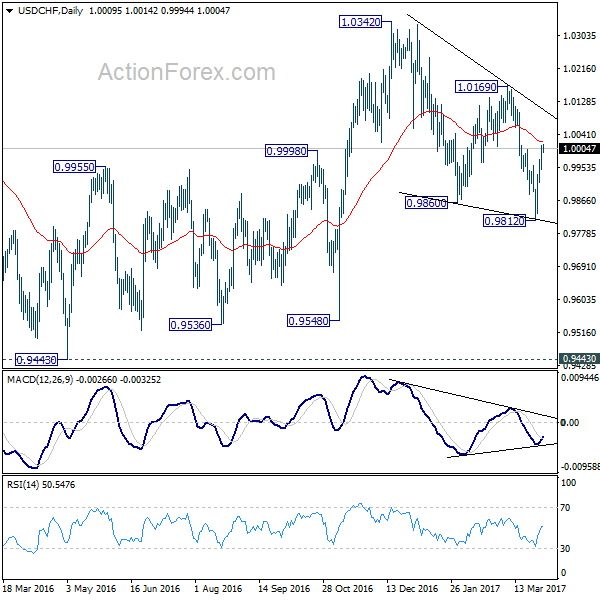
Daily Pivots: (S1) 0.9969; (P) 0.9990; (R1) 1.0033; More.....
Intraday bias in USD/CHF remains on the upside as rebound from 0.9812 short term bottom continues. Sustained trading above 55 day EMA (now at 1.0021) will argue that whole decline from 1.0342 has completed. Further rise should then be seen to 1.0169 resistance for confirmation. On the downside, below 0.9934 minor support will turn bias back to the downside for 0.9812 instead.
In the bigger picture, USD/CHF is staying in medium term sideway pattern between 0.9443/1.0342. In any case, decisive break of 1.0342 resistance is needed to confirm underlying strength. Otherwise, we'll stay neutral in the pair first. In case of deeper fall, we'd expect strong support from 0.9443/9548 support zone.
GBP/USD Mid-Day Outlook
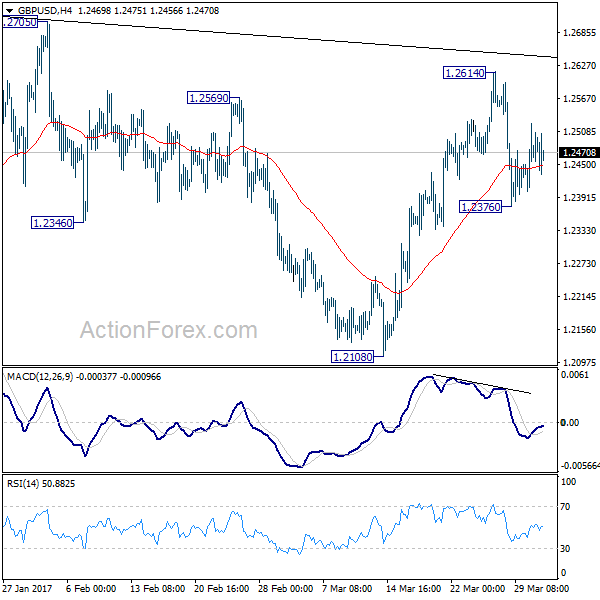
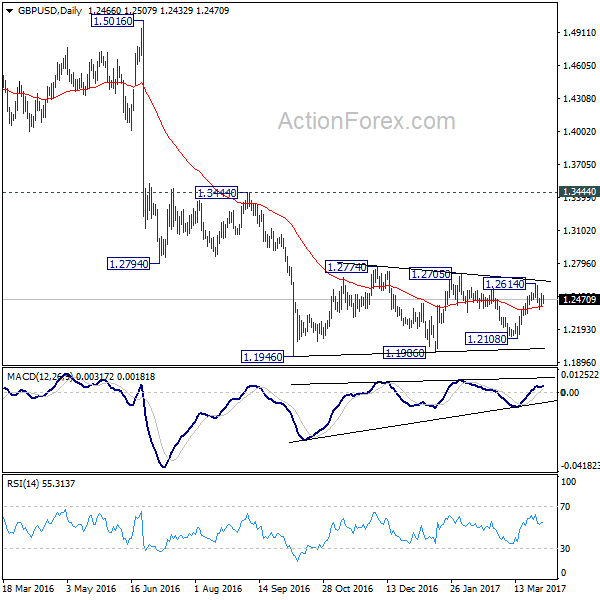
Daily Pivots: (S1) 1.2405; (P) 1.2465; (R1) 1.2527; More...
Intraday bias in GBP/USD remains neutral for the moment. Break of 1.2614 will extend the rise from 1.2108. Overall, price actions from 1.1946 are viewed as a consolidation pattern pattern. Upside should be limited by 1.2705/2774 resistance zone to bring larger down trend resumption eventually. On the downside, below 1.2376 will target 1.2108 support next. Break there will be an early sign of larger down trend resumption.
In the bigger picture, fall from 1.7190 is seen as part of the down trend from 2.1161. There is no sign of medium term reversal yet. Sustained trading below 61.8% projection of 2.1161 to 1.3503 from 1.7190 at 1.2457 will target 100% projection at 0.9532. Overall, break of 1.3444 resistance is needed to confirm medium term bottoming. Otherwise, outlook will remain bearish.
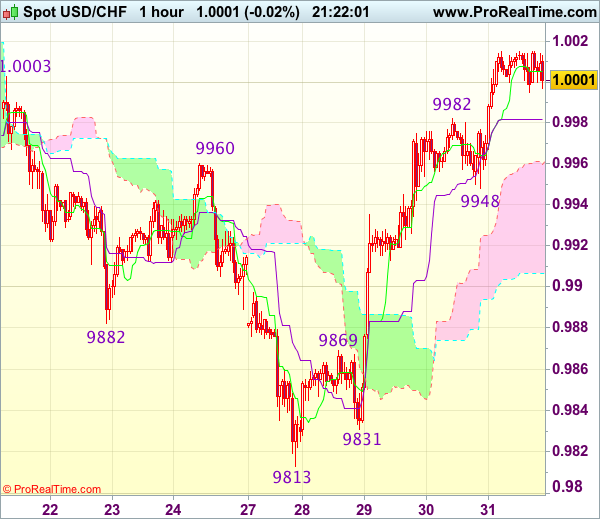
Trade Idea Update: USD/CHF – Buy at 0.9950
USD/CHF - 1.0002
Original strategy :
Buy at 0.9950, Target: 1.0050, Stop: 0.9915
Position : -
Target : -
Stop : -
New strategy :
Buy at 0.9950, Target: 1.0050, Stop: 0.9915
Position : -
Target : -
Stop : -
As the greenback has surged again after finding renewed buying interest at 0.9948 yesterday, adding credence to our view that recent decline has ended at 0.9813 and bullishness remains for the rise from there to extend further gain to 1.0030, then towards previous support at 1.0060 (now resistance), however, near term overbought condition should limit upside and price should falter below resistance at 1.0109, risk from there is seen for a retreat later.
In view of this, would not chase this rise here and would be prudent to buy dollar on pullback as said support at 0.9948 should limit downside. Below 0.9910-15 would abort and signal top is formed instead, bring correction to 0.9880 but reckon previous resistance at 0.9869 would hold from here.