Sample Category Title
GBP/USD Bulls Test 1.2600 Ahead of Brexit Triggering
This morning GBP/USD reached 1.2597, the highest the pair has attained since February 2, helped by the slump of USD caused by Trump's healthcare bill failure.
GBP/USD has been trading above the downside uptrend line support since mid-March. The significant psychological resistance level at 1.2500 was broken today during early Asian session.
The bulls are currently testing the next significant psychological resistance level at 1.2600.
At present, the price still trades along the upper band of the Bollinger Band indicator, suggesting the trend remains bullish.
The resistance level is at 1.2600, followed by 1.2630 and 1.2650.
The support line is at 1.2550, followed by 1.2530 and 1.2500.
There are two upcoming risk events this week, which will likely have some impact on GBP.
UK Prime Minister, Theresa May, will trigger Article 50 of the Lisbon treaty on Wednesday March 29, starting the 2-year Brexit negotiation process with the EU. Theresa May will formally notify the EU Council President, Donald Tusk. Tusk is expected to present draft Brexit guidelines to the European Union's 27 member states within 48 hours of the UK triggering Article 50.
Theresa May's letter, and Donald Tusk's response, will likely give markets more clues about the potential difficulties of the upcoming Brexit procedure.
The Scottish parliament will vote on whether to hold a second Scottish independence referendum on Tuesday March 28, which is only one day ahead the triggering of the Brexit process. If the result is to hold a referendum, the proposal will be delivered to the UK parliament for voting. In this situation, it will pose more political uncertainties on the UK's economic prospects and GBP.
UK Q4 GDP final reading will be released this Friday with better-than-expected readings likely providing some support to GBP.


EUR/AUD Mid-Day Outlook
Daily Pivots: (S1) 1.4101; (P) 1.4154; (R1) 1.4211; More...
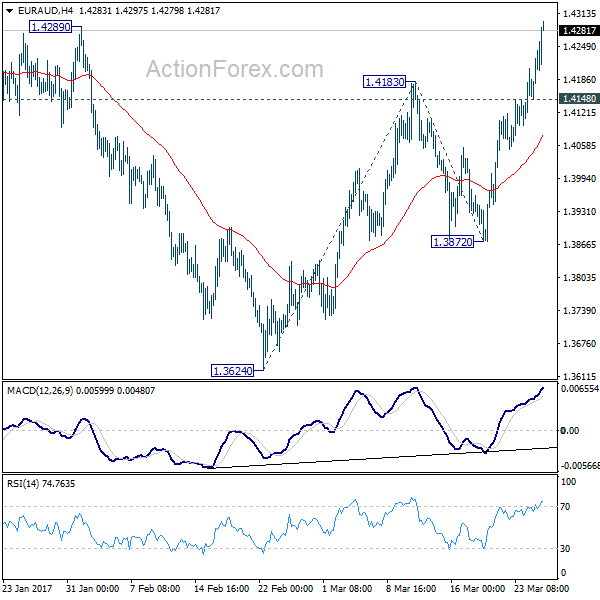
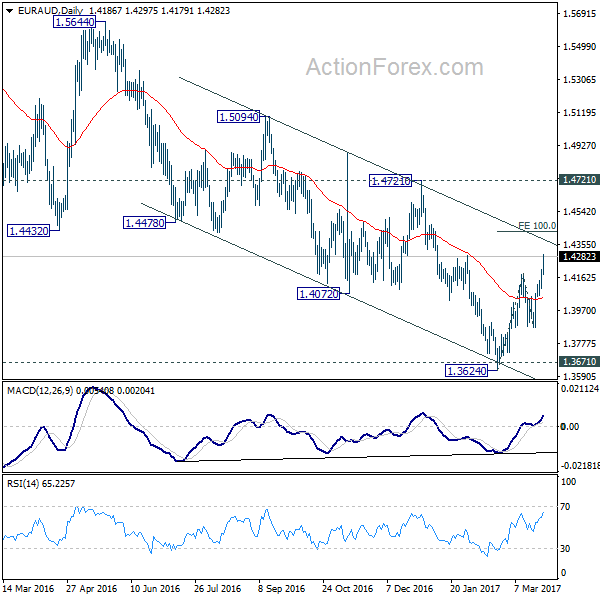
EUR/AUD rises to as high as 1.4297 so far today. Intraday bias remains on the upside. Current rise should target 100% projection of 1.3624 to 1.4183 from 1.3872 at 1.4431 next. Decisive break there will indicate upside acceleration and target 1.4721 key resistance. On the downside, below 1.4148 minor support will turn bias neutral and bring consolidations first before staging another rally.
In the bigger picture, price actions from 1.6587 medium term top are viewed as a corrective pattern. Such correction could be completed after testing 1.3671 support. Break of 1.4721 cluster resistance (38.2% retracement of 1.6587 to 1.3624 at 1.4756) should confirm this case and target 61.8% retracement at 1.5455 and above. Overall, we'd expect the up trend from 1.1602 to resume later. However, sustained break of 1.3671 will invalidate our bullish view and would turn focus back to 1.1602 long term bottom.
USD/JPY Mid-Day Outlook
Daily Pivots: (S1) 110.79; (P) 111.14; (R1) 111.65; More...
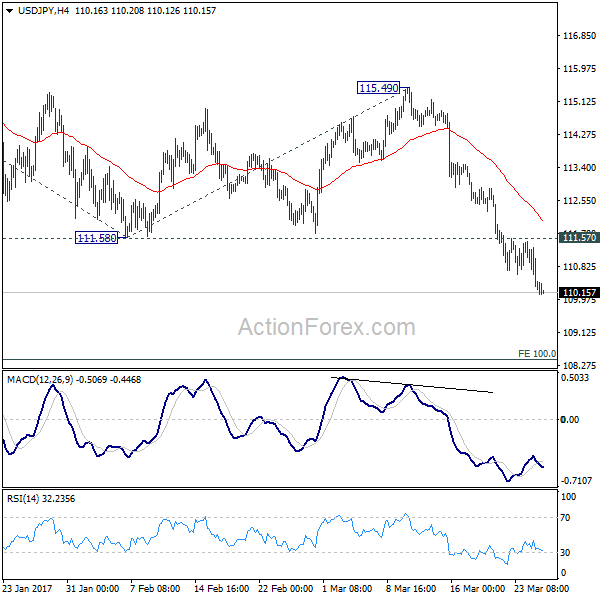
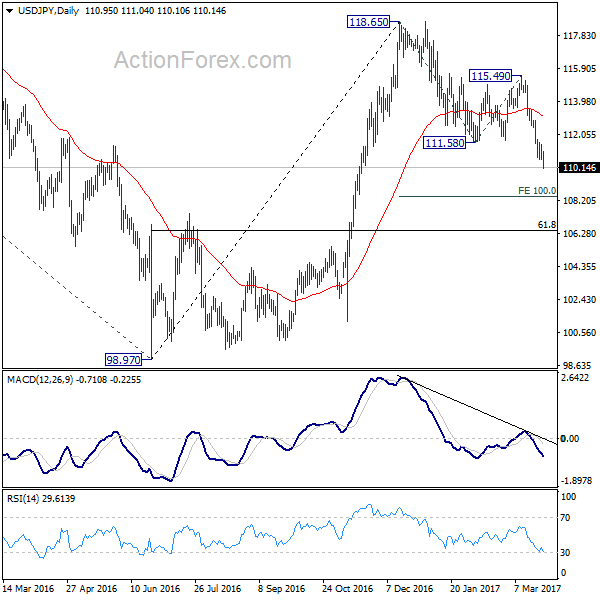
USD/JPY's fall continues today and reaches as low as 110.10 so far. Intraday bias remains on the downside and the fall from 118.65 would target 100% projection of 118.65 to 111.58 from 115.49 at 108.42 and possibly below. On the upside, break of 111.57 resistance is needed to indicate short term bottoming. Otherwise, near term outlook stays mildly bearish in case of recovery.
In the bigger picture, price actions from 125.85 high are seen as a corrective pattern. sustained trading below 55 week EMA (now at 111.11) will indicates that such consolidation is not completed. And another fall would be seen back to 98.97 as the third leg. In that case, downside would be contained by 61.8% retracement of 75.56 to 125.95 at 94.77 to complete the correction. On the upside, above 115.49 will extend the rise from 98.97 to retest 125.85 first. Overall, up trend from 75.56 is expected to resume after the consolidation from 125.85 completes.
USD/CHF Mid-Day Outlook
Daily Pivots: (S1) 0.9881; (P) 0.9920; (R1) 0.9952; More.....
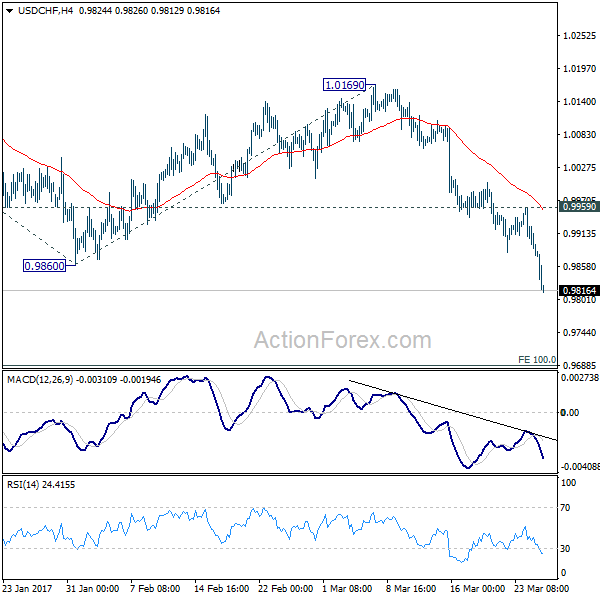
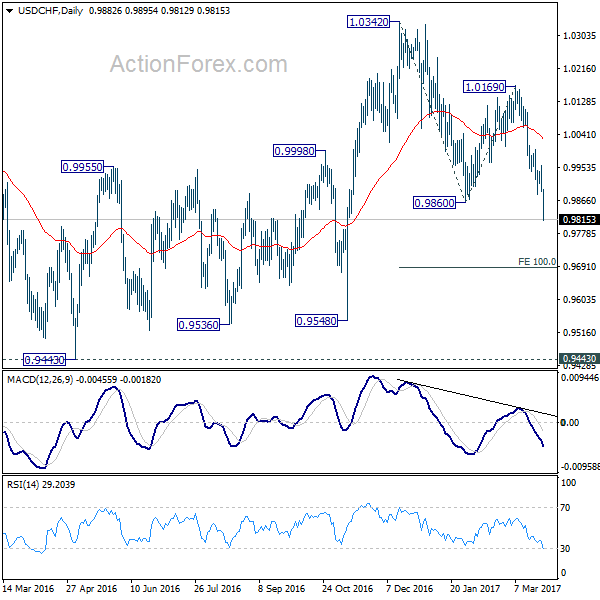
USD/CHF's decline accelerates to as low as 0.9812 so far. Intraday bias remains on the downside. Whole decline from 1.0342 would target 100% projection of 1.0342 to 0.9860 from 1.0169 at 0.9687 and possibly below. On the upside, break of 0.9959 resistance is needed to indicate short term bottoming. Otherwise, outlook will stay bearish in case of recovery.
In the bigger picture, USD/CHF is staying in medium term sideway pattern between 0.9443/1.0342. In any case, decisive break of 1.0342 resistance is needed to confirm underlying strength. Otherwise, we'll stay neutral in the pair first. In case of deeper fall, we'd expect strong support from 0.9443/9548 support zone.
GBP/USD Mid-Day Outlook
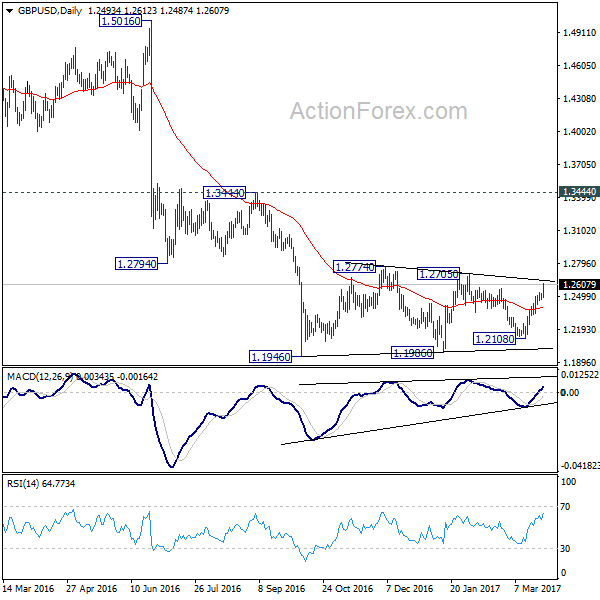
Daily Pivots: (S1) 1.2453; (P) 1.2487; (R1) 1.2506; More...
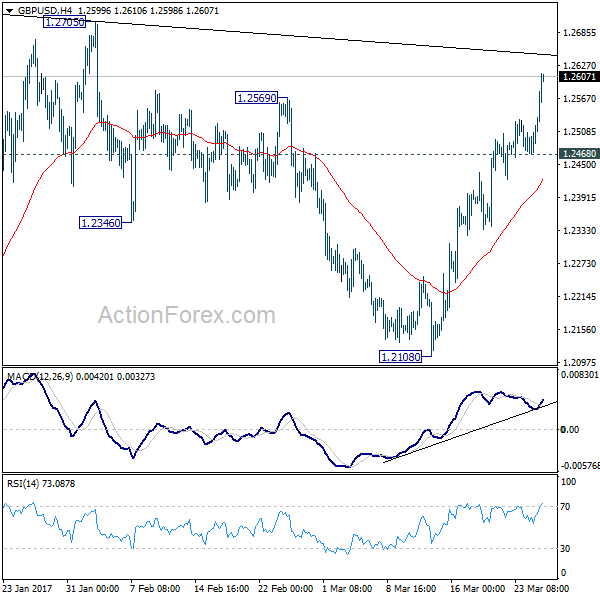
GBP/USD's rally accelerates through 1.2569 resistance today and hit as high as 1.2612 so far. Intraday bias remains on the upside for 1.2705/74 resistance zone. Such rise is seen as part of the consolidation pattern from 1.1946. We'd expect upside to be limited by 1.2705/2774 to bring down trend resumption eventually. On the downside, below 1.2422 minor support will turn bias back to the downside for 1.2108 support first. Though, sustained break of 1.2774 will extend the rise towards 1.3444 key resistance level.
In the bigger picture, fall from 1.7190 is seen as part of the down trend from 2.1161. There is no sign of medium term reversal yet. Sustained trading below 61.8% projection of 2.1161 to 1.3503 from 1.7190 at 1.2457 will target 100% projection at 0.9532. Overall, break of 1.3444 resistance is needed to confirm medium term bottoming. Otherwise, outlook will remain bearish.
EUR/USD Mid-Day Outlook
Daily Pivots: (S1) 1.0764; (P) 1.0791 (R1) 1.0823; More.....
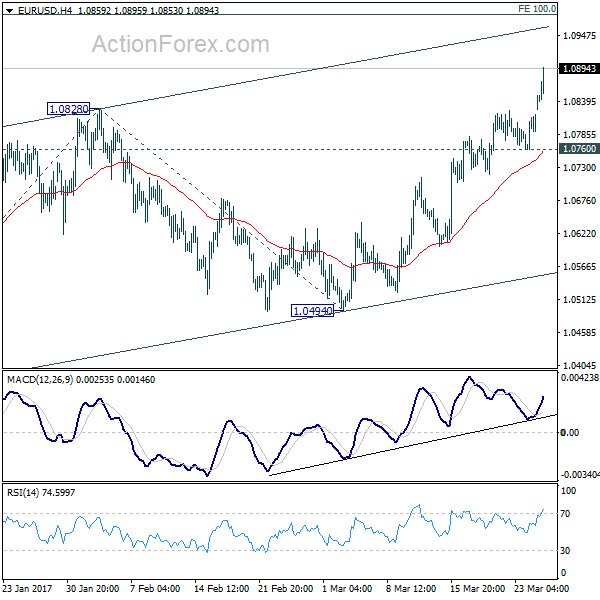
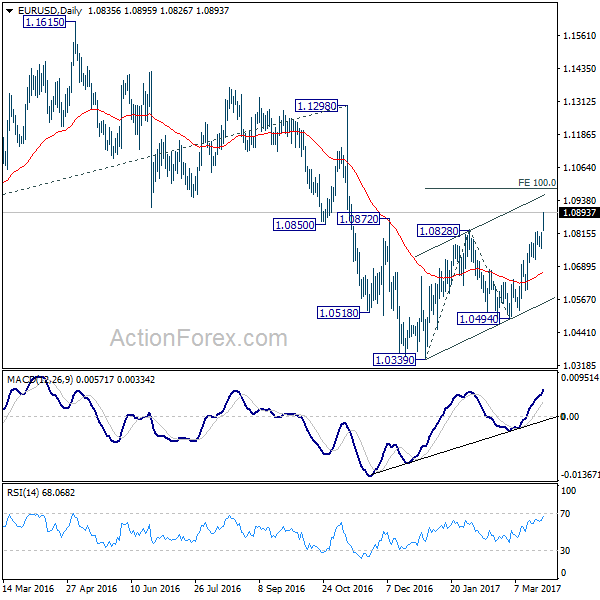
EUR/USD's rally accelerates to as high as 1.0895 so far and intraday bias remains on the upside. Current rise is expected to target 100% projection of 1.0339 to 1.0828 from 1.0494 at 1.0983. At this point, we're still treating rise from 1.0339 as a correction. Hence, we'd expect strong resistance from 1.0983 to limit upside and bring near term reversal. On the downside, break of 1.0760 support will turn bias back to the downside for 1.0494 support. However, firm break of 1.0983 will dampen our view and put focus on 1.1298 key resistance.
In the bigger picture, as long as 1.1298 key resistance holds, whole down trend from 1.6039 (2008 high) is still expected to continue. Break of 1.0339 low will send EUR/USD through parity to 61.8% projection of 1.3993 to 1.0461 from 1.1298 at 0.9115. However, considering bullish convergence condition in weekly MACD, break of 1.1298 will indicate term reversal. this would also be supported by sustained trading above 55 week EMA.
Dollar Decline Accelerates as Reverse Trump Trade Intensifies
Dollar's decline accelerates as markets seem to have made up their mind regarding US president Donald Trump's health care act failure. The dollar index is losing -0.7% at the time of writing, diving through 99.23 near term support and hits as low as 98.90 so far. Risk aversion dominates the markets as investors seriously question Trump's ability to push through his policies. Nikkei closed down -1.44% at 18985.59. FTSE, DAX and CAC are trading down -0.8%, -0.95% and -0.45% respectively. US futures point to another three-digit fall in DJIA at open. In the currency markets, Yen and European majors are generally higher with Sterling leading the way. Commodity currencies are broadly under pressured.
Labour demands May's Brexit plan to meet six tests
In UK, Prime Minister Theresa May is going to meet Scotland First Minister Nicola Sturgeon later today. In a speech in Scotland, May said that she would never allow UK to become "looser or weaker" because of Brexit. And she emphasized that when all four nations "works together with determination, we are an unstoppable force." May is expected to discuss with Sturgeon on the topic of another Scottish independence referendum.
May will trigger Article 50 for Brexit negotiation on Wednesday. Ahead of that Labour Party's Keir Starmer demanded May's Brexit plan to meet "six tests" to get the party's support. The tests include "fair migration system for UK business and communities", "retaining strong collaborative relationship with EU", "protecting national security and tackling cross-border crime", "delivering for all nations and regions of the UK", "protecting workers' rights and employment protections", and "ensuring same benefits currently enjoyed within single market.
German Ifo hit near six year high
Germany Ifo business climate rose to 112.3 in March, up from 111.0 and beat expectation of 111.1. That's also the highest reading in nearly six years since July 2011. Current assessment gauge rose to 119.3, up from 118.4 and beat expectation of 118.3. Expectations gauge rose to 105.7, up from 104.0 and beat expectation of 104.3. Ifo president Clemens Fuest noted that "the upwards trend in assessments of the current business situation continues unabated." And, "the business outlook for companies also improved again this month. Also "the upswing in the German economy is gaining impetus." Meanwhile, Ifo economist Klaus Wohlrabe also said that "the political uncertainties don't affect the German economy."
Also from Eurozone, M3 money supply rose 4.7% yoy in February, below expectation of 4.9% yoy.
BoJ opinions: monetary policy based on Japan, not overseas
In Japan, BoJ released summary of opinions from the March 15/16 policy meeting. The document noted that "some market participants argue that the Bank needs to change the monetary policy in response to the rise in the long-term yields overseas." But, majority believed that "monetary policy in Japan should be decided based on Japan's economic activity and prices". Therefore, "it will be a considerable length of time before the Bank will need to change its monetary policy." At the meeting, BoJ held interest rate unchanged at -0.1%. And under the Yield Curve Control framework, BoJ target to guide 10 year yield at around 0%. The annual target of asset purchase was held at JPY 80T.
Also from Japan, corporate serve price index rose 0.8% yoy versus expectation of 0.5% yoy.
EUR/USD Mid-Day Outlook
Daily Pivots: (S1) 1.0764; (P) 1.0791 (R1) 1.0823; More.....
EUR/USD's rally accelerates to as high as 1.0895 so far and intraday bias remains on the upside. Current rise is expected to target 100% projection of 1.0339 to 1.0828 from 1.0494 at 1.0983. At this point, we're still treating rise from 1.0339 as a correction. Hence, we'd expect strong resistance from 1.0983 to limit upside and bring near term reversal. On the downside, break of 1.0760 support will turn bias back to the downside for 1.0494 support. However, firm break of 1.0983 will dampen our view and put focus on 1.1298 key resistance.
In the bigger picture, as long as 1.1298 key resistance holds, whole down trend from 1.6039 (2008 high) is still expected to continue. Break of 1.0339 low will send EUR/USD through parity to 61.8% projection of 1.3993 to 1.0461 from 1.1298 at 0.9115. However, considering bullish convergence condition in weekly MACD, break of 1.1298 will indicate term reversal. this would also be supported by sustained trading above 55 week EMA.
Economic Indicators Update
| GMT | Ccy | Events | Actual | Forecast | Previous | Revised |
|---|---|---|---|---|---|---|
| 23:50 | JPY | BoJ Summary of Opinions at March 15-16 Meeting | ||||
| 23:50 | JPY | Corporate Service Price Y/Y Feb | 0.80% | 0.50% | 0.50% | |
| 8:00 | EUR | Eurozone M3 Y/Y Feb | 4.70% | 4.90% | 4.90% | |
| 8:00 | EUR | German IFO - Business Climate Mar | 112.3 | 111.1 | 111 | |
| 8:00 | EUR | German IFO - Expectations Mar | 105.7 | 104.3 | 104 | |
| 8:00 | EUR | German IFO - Current Assessment Mar | 119.3 | 118.3 | 118.4 |
Dow Fell Further after Holding in Directionless Mode
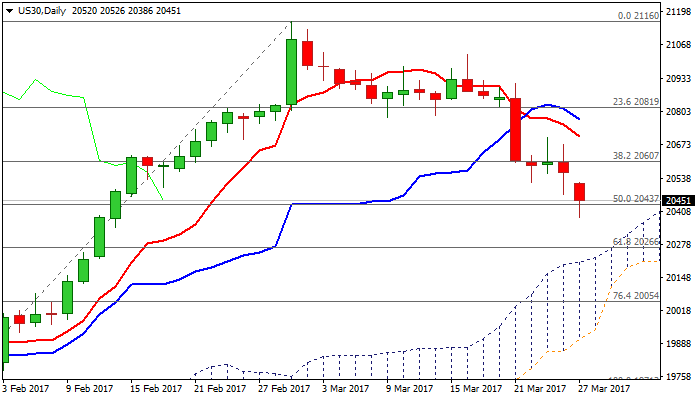
Dow fell further on Monday after holding in directionless mode during past three days and hit fresh nearly six-weeks low at 20386, where rising 55SMA offered temporary to renewed bears.
Extended wave C, on which the price is currently riding, hit levels below its FE 161.8% (20400), seeing scope for further extension towards next Fibonacci expansion levels at 20344 (176.4%), possibly towards double Fibo support at 20260 zone (FE200% / Fibo 61.8% of 19713/21160 rally).
Session high at 20526 (also 22 Mar low, reinforced by falling 4-hr 10SMA) marks solid barrier.
Res: 20471; 20526; 20558; 20664
Sup: 20400; 20386; 20266; 20225
Lack of Fundamentals Leave Canadian Dollar Unchanged
USD/CAD is almost unchanged in the Monday session. Currently, the pair is trading at 1.3350. On the release front, it's a quiet start to the week, with no economic indicators in Canada or the US. On Tuesday, the US releases CB Consumer Confidence.
The US dollar enjoyed an impressive run after Donald Trump's election last November. However, the euphoria over President Trump's upset election win is long past. The inquiry into the Trump administration's links with Russia continues to make headlines, and is another cause for concern for nervous investors. Trump has been in office for over two months, but he has yet to provide any details over even an outline of economic policy. Last week, Trump's proposed bill to change Obamacare was not even voted on, as the White House could not garner enough support to pass the bill. This debacle will only increase market uneasiness over Trump, and could send the DAX lower.
The Canadian dollar is sensitive to movement in oil prices, so lower crude prices could weigh on the currency. West Texas crude has dropped 1.0% in March, and dipped to $47.05 last week, its lowest level since the end of November. Crude headed lower after Crude Oil Inventories posted a strong surplus of 5.0 million barrels, crushing the estimate of 1.9 million. The weekly indicator has recorded only two declines in 2017, as US oil drillers continue to enter the market and ratchet up US oil production. This, together with increased US shale production, has more than offset OPEC's production cuts. Last week, OPEC announced it was considering extending the production cut agreement by another 6 months, until the end of 2017, but it's doubtful that such a move will prop up oil prices.
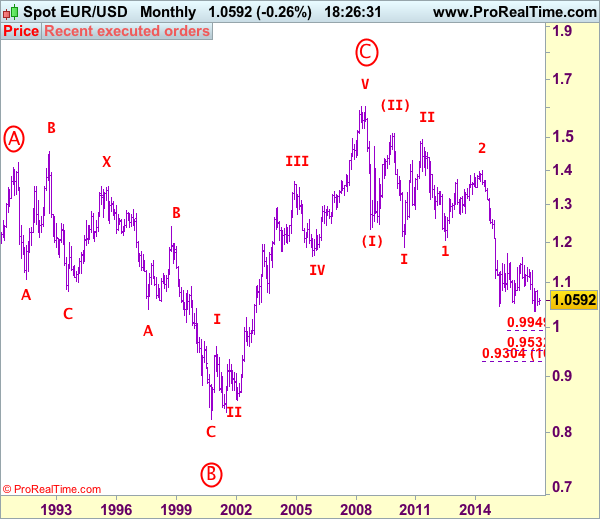
EUR/USD Elliott Wave Analysis
EUR/USD – 1.0877
EUR/USD: Wave (c) of 2 ended at 1.3993 and wave 3 of III has commenced for weakness to 1.0411 (1.236 of wave 1), then 1.0000.
The single currency finally broke above previous resistance at 1.0829, adding credence to our bullish view that the erratic rise from 1.0340 low is still in progress and upside bias remains for this move to bring retracement of early downtrend, hence further gain to 1.0930-35 (61.8% Fibonacci retracement of 1.1300-1.0340), then 1.1000 would be seen, however, near term overbought condition should prevent sharp move beyond latter level and reckon 1.1065-70 would limit upside and price should falter below 1.1100, bring retreat later.
Our preferred count on the daily chart remains that a wave (II) from 1.2329 ended at 1.5145 with A-leg ended at 1.4720, followed by wave B at 1.2457, the wave C from there was also a 3 legged move and is labeled as (a): 1.3739, (b): 1.2885, the wave iii of the 5-waver (c) from 1.2885 has ended at 1.4339 and wave iv is a triangle ended at 1.3878 and wave v formed a top at 1.5145. The decline from there is a 5-waver (C) with minor wave (i) of I of (C) ended at 1.4218 with wave (ii) ended at 1.4580, wave (iii) ended at 1.3267 and wave (iv) ended at 1.3692 and wave (v) ended at 1.1876, this is also the low of wave I of (C) and wave II ended at 1.4940, hence wave III is now in progress with a diagonal wave 1 ended at 1.2042, the breach of previous support at 1.1876 (wave I trough) adds credence to our view that the wave 2 has ended at 1.3993, wave 3 has commenced for further weakness to 1.0411, then towards 1.0000.
On the downside, whilst pullback to 1.0820-25 cannot be ruled out, reckon downside would be limited to support at 1.0760 and bring another rise later. A daily close below support at 1.0719 would abort and suggest top is possibly formed, bring further fall to 1.0650-60 and indicated key support at 1.0600 should hold. Only a daily close below this level would confirm top formed and signal the aforesaid rise from 1.0340 has ended, bring further fall to 1.0550, then 1.0525 support but support at 1.0493-96 would hold from here.
Recommendation: Buy at 1.0780 for 1.0980 with stop below 1.0680.
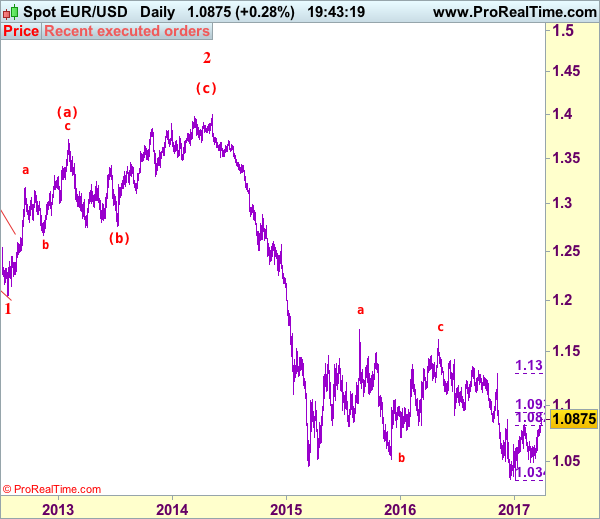
Euro's long-term uptrend started from 0.8228 (26 Oct 2000) with an impulsive structure. The rise from 0.8228 to 0.9593 (5 Jan 2001) is labeled as wave I, the retreat to 0.8352 (6 Jul 2001) is wave II and the rally to 1.3670 (31 Dec 2004) is wave III. Wave IV from there ended at 1.1640 (15 Nov 2005), the subsequent upmove to 1.6040 (July 15, 2008) is treated as wave V, the major selloff from the record high of 1.6040 to 1.2329 (October 27, 2008) signals a reversal has taken place with (I) leg ended at 1.2329 and once (II) ended at 1.5145, wave (III) itself is an extended move with I: 1.1876 and complex wave II ended at 1.4902, wave III has commenced with wave 1 and 2 ended at 1.2042 and 1.3993 respectively, wave 3 of III is now unfolding for weakness towards parity.