

Sample Category Title
Trade Idea: EUR/JPY – Stand aside
EUR/JPY - 120.05
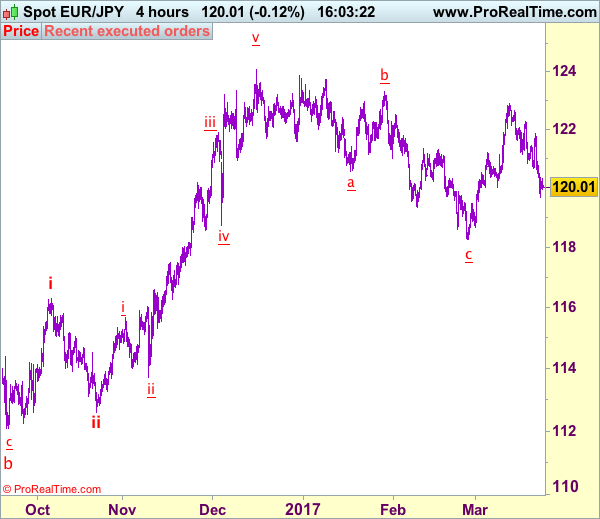
Recent wave: wave v of (C) ended at 94.12 and major correction in wave A has ended at 149.79
Trend: Near term up
New strategy :
Stand aside
Position: -
Target: -
Stop:-
As the single currency has remained under pressure after meeting renewed selling interest at 121.84 earlier this week, adding credence to our view that recent rise from 118.24 has ended at 122.89 last week, hence downside risk remains for this fall from 122,89 top to extend further weakness to 119.65-70 and then 119.35-40, however, near term oversold condition should limit downside to 119.00 and support at 118.67 should hold from here,
In view of this, would not chase this fall here and would be prudent to stand aside in the meantime. On the upside, whilst recovery to 120.60-70 cannot be ruled out, reckon upside would be limited to 121.15-20 and bring another decline later. Only break of said resistance at 121.84 would revive bullishness and suggest low is formed instead, bring test of indicated resistance at 122.26 first.
Our latest preferred count is that wave (ii) is ABC-X-ABC which ended at 123.33 and wave (iii) is unfolding with wave iii ended at 100.77, followed by wave iv at 111.57 and wave v as well as the wave (iii) has ended at 97.04, followed by wave (iv) at 111.43 and wave (v) has ended at 94.12 which is also the end of the larger degree v, this also implied the major wave (C) has also ended there, hence major correction has commenced from there with (A) leg unfolding in its lower degree wave c which has possibly ended at 145.69. Under this count, A-B-C wave (B) has commenced with A leg ended at 136.23, wave B at 143.79 and wave C has possibly ended at 149.79.
Our larger degree count is that the decline from 139.26 is wave (C) and is sub-divided into a diagonal triangle i-ii-iii-iv-v with wave i - 105.44, wave ii- 123.33, wave iii - 97.03, wave iv - 111.43, followed by the final wave v as well as the end of wave (C) at 94.12, this also mark the bottom of larger degree wave B. Under this count, major rise in wave C has commenced as an impulsive wave with minor wave III ended at 145.69, wave V is still in progress for further gain to 150.00. Having said that, this so-called wave V could well be the first leg of larger degree 5-waver wave C and this wave C should bring at least a retest of wave A top at 169.97 (July 2008).
Is The Party Over?
Did the market just experience a mini-correction? Or is this the beginning of something bigger? Why are news headlines making a big issue of a 1% drop in U.S. equities? Shall investors buy on the dips, or better protect themselves from the downside?
These were the top questions I received since Tuesday's more than 1% drop in U.S. equities, but unfortunately, there are no black or white answers in our gray world.
A 1% fall in equities isn't frightening. In 2016 we experienced 21 days of more than 1% drop in S&P 500, and the index still managed to gain 5% from January 2016 until the presidential election on November 8. Most of the gains since November 9 until the beginning of March of 12.4% were attributed to Trump trade and improving economic conditions in the U.S. and globally.
However, the price action experienced in the last couple of days indicates that the first phase of Trump trade is over. U.S. equities are currently priced for perfection, and now we should be looking for justifications of the overstretched valuations.
Worrying signs
Equity analysts are revising their earnings growth downward, Donald Trump's approval rating by the latest Gallup Poll sank to 37%, and FBI's Director James Comey hurt the President's credibility even further.
Other worrying signs are coming from different asset classes. For example, U.S. 10-year treasury bond yields declined by more than 20 basis points from Mid-March highs. If this drop in yields reminds me of anything, it reminds me of Neel Kashkari, the President of the Federal Reserve Bank of Minneapolis, who was the only dissenter to raise interest rates in Fed's last meeting. He was worried that the economic data did not back up the belief that things had gotten significantly better, and markets seem to share his skepticism by flocking to the safety of bonds.
Energy markets are sharing a similar story as well. Although oil prices were mostly pressured due to increasing U.S. inventories; prices should rally when the dollar falls which did not happen.
So, we need a lot of good news to keep investors buying into the second longest bull market ever.
Repealing Obama Care
Today will be a major test to Trump trade. The U.S. Congress will vote on the bill to repeal Obamacare after some modification took place on Monday. If the bill passed, we might see some relief in equities. However, there's a high chance that more than 21 Republicans will vote against the health care plan, leading to the first significant loss of Trump's administration. Such a loss would be perceived as jeopardizing the President agenda, and could potentially lead to shaking investors' confidence.
I'm not calling for a major correction as of yet, but for investors who want to remain invested largely in equities, I suggest it's a good time to think about buying a protection to protect from a market downturn.
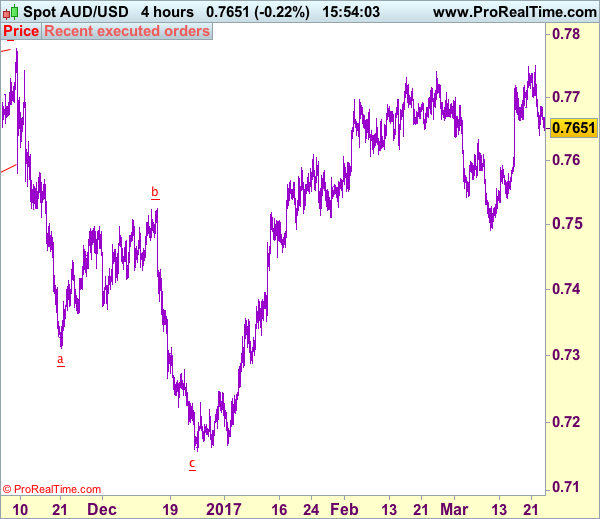
Trade Idea: AUD/USD – Hold long entered at 0.7645
AUD/USD – 0.7647
Recent wave: Wave 5 ended at 1.1081 and major correction has commenced for fall to 0.7000 and then towards 0.6500-10
Trend: Near term up
Original strategy :
Bought at 0.7645, Target: 0.7800, Stop: 0.7585
Position: - Long at 0.7645
Target: - 0.7800
Stop: - 0.7585
New strategy :
Hold long entered at 0.7645, Target: 0.7800, Stop: 0.7585
Position: - Long at 0.7645
Target: - 0.7800
Stop:- 0.7585
Although aussie has remained under near term pressure after retreating quite sharply from 0.7750 (this week’s high) and marginal weakness from here cannot be ruled out, reckon downside would be limited and as long as 0.7592 (previous resistance) holds, mild upside bias remains for another rise, above said resistance would extend gain to 0.7778 (last year’s high), however, break there is needed to retain bullishness and extend headway to 0.7840-50 but price should falter below 0.7900.
In view of this, we are holding on to our long position entered at 0.7645. Only below previous resistance at 0.7592 would abort and signal top is formed instead, then further choppy trading would take place and risk is seen for pullback to 0.7530-40 but indicated support at 0.7491 should remain intact.
On the 4-hour chart, the move from 0.8066 is the wave 5 with i: 0.8860, ii: 0.8315, wave iii is an extended move ended at 1.0183, iv: 0.9706 and wave v has ended at 1.1081 (also the top of entire wave 5). The subsequent selloff is the major correction which is unfolding as ABC-X-ABC and 2nd A leg has ended at 0.8848, followed by a-b-c wave B which ended at 0.9758, hence, 2nd C wave is now in progress and indicated downside target at 0.7000 and 0.6950 had been met, so further fall to 0.6710-20 cannot be ruled out.
EUR/CHF Daily Outlook
Daily Pivots: (S1) 1.0678; (P) 1.0712; (R1) 1.0737; More...
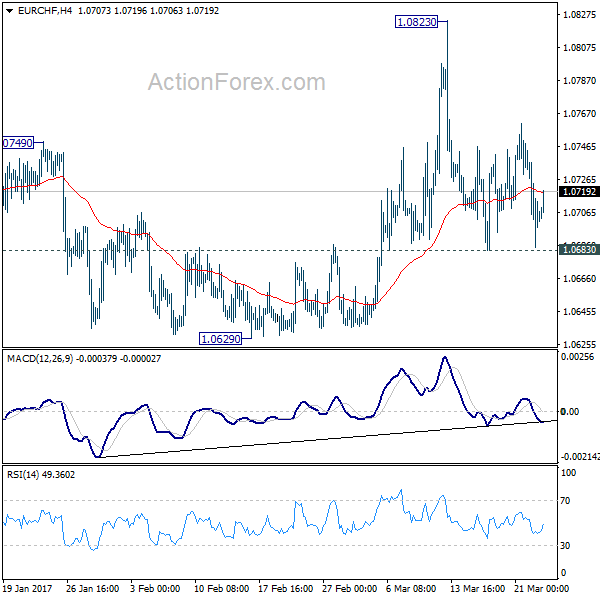
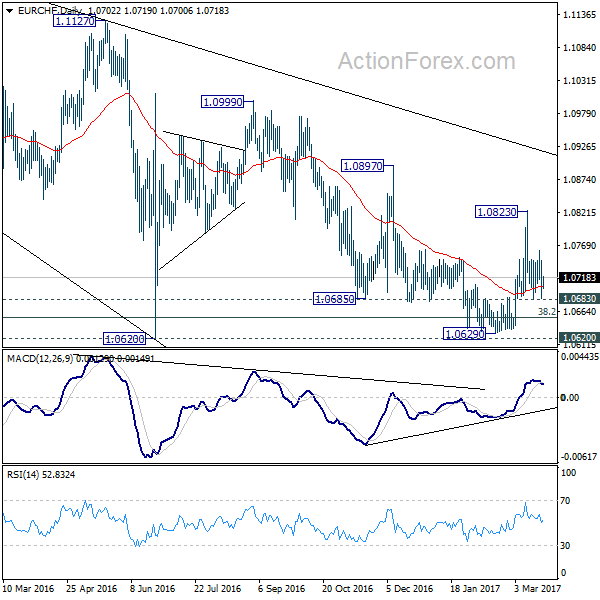
Much volatility is seen in EUR/CHF as consolidative trading continues. But still it's holding above 1.0683 minor support, and in range below 1.0823. Intraday bias remains neutral for the moment. On the upside, break of 1.0823 resistance will re-affirm the case of trend reversal. And intraday bias will be turned back tot he upside for 1.0897 resistance for confirmation. However, break of 1.0683 minor support will turn bias to the downside for 1.0620 key support level again.
In the bigger picture, the decline from 1.1198 is seen as a corrective move. Decisive break of 1.0897 resistance should confirm that it's completed. And in that case, larger up trend is resuming for another high above 1.1198. Meanwhile, sustained trading below 38.2% retracement of 0.9771 to 1.1198 at 1.0653 will target 50% retracement at 1.0485.
GBPUSD Trading At The Start Of A Big Bullish Impulse
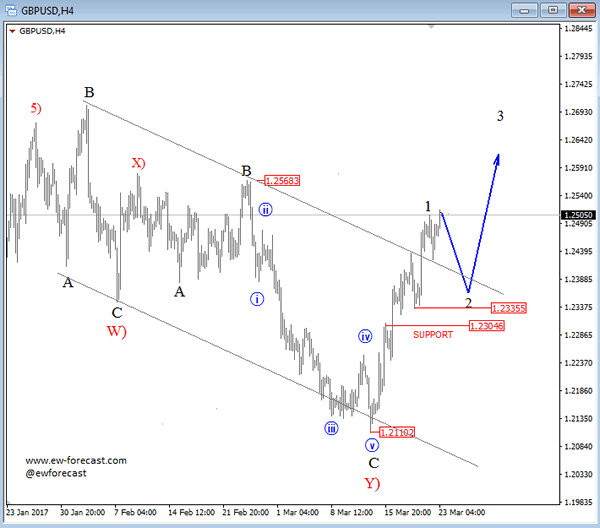
Cable is turning nicely up since start of the month, when pair most-likely completed a deep and complex corrective retracement from February highs down to 1.2110 level. It was a double three pattern that is now finished after a nice recovery back above 1.2384 bullish level, where overlap with wave A and break out of a downward channel confirms a reversal. As such, we will look for even more upside in days ahead, but in the mean-time we still need to be aware of a corrective set-back in wave 2 that may find a support at 1.2300 zone.
GBP/USD, 4H
EUR/GBP Candlesticks and Ichimoku Analysis
Weekly
• Last Candlesticks pattern: N/A T
• ime of formation: N/A
• Trend bias: Near term up
Daily
• Last Candlesticks pattern: Hammer
• Time of formation: 3 Feb 2016
• Trend bias: Up
EURGBP – 0.8708
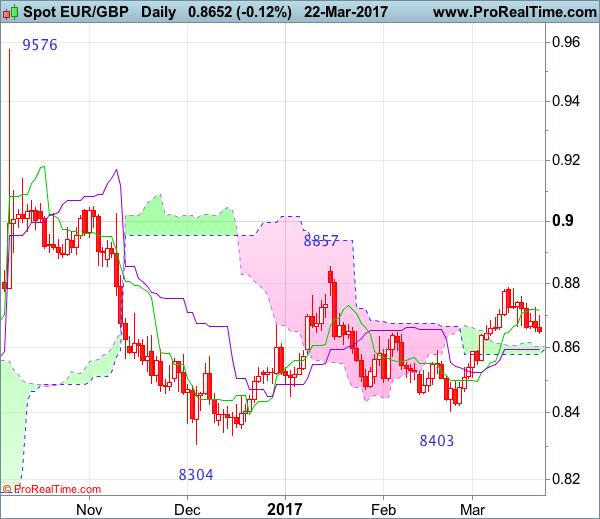
The single currency met resistance at 0.8760 last week and has slipped again, suggesting near term downside risk remains for the retreat from 0.8788 to bring retracement of recent upmove, hence initial downside risk remains for correction to 0.8630-35, however, reckon the Kijun-Sen (now at 0.8596) would limit downside and bring another rise later, above said resistance at 0.8760 would signal pullback from 0.8788 has ended, bring retest of this level. Looking ahead, break there would extend rise from 0.8403 to 0.8810-15 but as broad outlook remains consolidative, reckon upside would be limited to previous resistance at 0.8857, risk from there is seen for a retreat to take place later. Only break of said resistance at 0.8857 would signal the rise from 0.8304 low is underway for headway to 0.8900, then towards 0.8940 (50% Fibonacci retracement of 0.9576-0.8304) which is likely to hold from here.
On the downside, whilst pullback to 0.8630-35 cannot be ruled out, reckon the Kijun-Sen (now at 0.8596) would contain downside and bring another rise later. A daily close below the Kijun-Sen would signal top is formed and bring weakness to 0.8550-55 and then test of 0.8505-10 but break of latter level is needed to signal the rebound from 0.8403 has ended, bring subsequent fall to 0.8460-65, however, price should stay well above said support at 0.8403 and bring another rebound later.
Recommendation: Buy at 0.8605 for 0.8785 with stop below 0.8505.
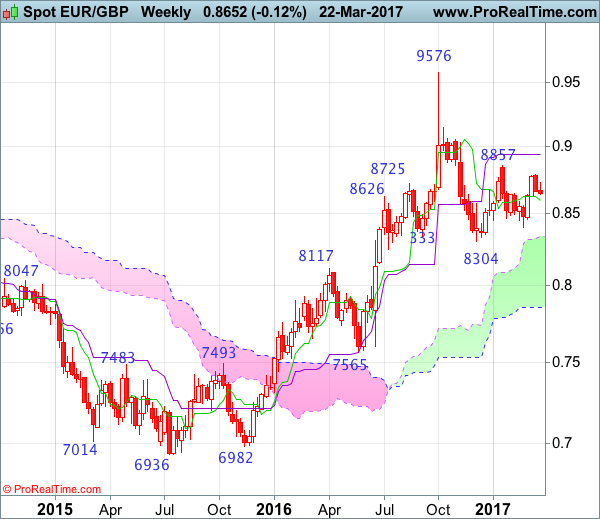
On the weekly chart, as the single currency has eased after meeting resistance at 0.8788, retaining our view that initial consolidation below this level would be seen and pullback to the Tenkan-Sen (now at 0.8596) cannot be ruled out, however, reckon downside would be limited to 0.8580 and bring another rise later. Above said resistance at 0.8788 would extend the rebound from 0.8403 towards said resistance at 0.8857. Looking ahead, only a break of this level would revive bullishness and extend the rise from 0.8304 to 0.8940 (50% Fibonacci retracement of 0.9576-0.8304 and current level of the Kijun-Sen) but price should falter below resistance at 0.9026.
On the downside, expect pullback to be limited to 0.8630 and 0.8595-00 should hold, bring another rebound. Below 0.8550 would defer and risk weakness to 0.8520 but reckon 0.8495-00 would contain downside. Below 0.8460-65 would bring retest of 0.8403 but break there is needed to revive bearishness and extend the fall from 0.8857 to 0.8350-55. Looking ahead, below there would signal decline from 0.9576 top has resumed for retest of 0.8304 but only break there would extend the fall from 0.9576 top for retracement of medium term upmove to previous support at 0.8251, then 0.8200.
Focus On Yellen And UK Retail Sales
Market movers today
The key event today will be the vote in the US House of Representatives on the American Health Care Act (Trumpcare), which is to replace Obamacare. It is a close call and the uncertainty was the trigger for the Tuesday stock market sell-off. A rejection of the bill will delay Trump’s plan for tax cuts and infrastructure spending and put into question his ability to govern even with a Republican majority in both houses of Congress. See The Washington Post, 23 March 2017.
The results of the fourth and final ECB TLTRO are due to be announced today. We expect a take-up of about EUR250bn, which is a significantly higher figure compared to the first three auctions. We expect higher demand at the final auction because (1) banks have increased information on the interest, (2) it is the final opportunity to acquire liquidity with an interest rate no higher than 0%, (3) markets are pricing in an increasing probability of an ECB hike, making the TLTRO II more attractive and (4) French banks could demand extra liquidity ahead of the election.
Fed Chairman Janet Yellen (dove) is due to speak today at a Community Development Conference. It is not clear if she will talk about the overall economy but if she does, we do not expect her to change much compared to the Fed press conference last week.
UK retail sales for February will get some attention as the two past months of weakness broke a strong trend in 2016. A small increase of 0.4% m/m is estimated by consensus.
Other data released today on the global front will be initial jobless claims, US new home sales and euro consumer confidence. We do not expect these to have any big market impact.
There are no market movers in Scandi today.
Selected market news
Markets have consolidated a bit yesterday and overnight after the risk-off day on Tuesday. Stocks and bond yields have seen a slight increase while EUR/USD is a bit lower in Asia trading. Oil prices are up close to USD1 per barrel from the low yesterday to USD51 per barrel (Brent).
We continue to see a risk of a further correction in markets in the short term as momentum has been very strong for a long time, which normally leads to profit taking and a market correction at some point. We also believe we are close to a peak in the global manufacturing cycle, which has been a key ingredient behind the strong rally.
Yesterday, London’s worst terror attack in more than a decade left five people dead and at least 40 injured.
Chinese short-dated repo rates came down overnight following a spike yesterday on the back of tighter liquidity. However, the three-month and 12-month money market rates continue to climb higher, increasing the cost of longer-term funding for banks – not least institutions within shadow banking. The three-month money market rate is now at 4.44%, up from 2.8% in October.
EUR/CHF Candlesticks and Ichimoku Analysis
Weekly
• Last Candlesticks pattern: Doji
• Time of formation: 20 Feb 2017
• Trend bias: Up
Daily
• Last Candlesticks pattern: Doji
• Time of formation: 1 Sep 2016
• Trend bias: Near term down
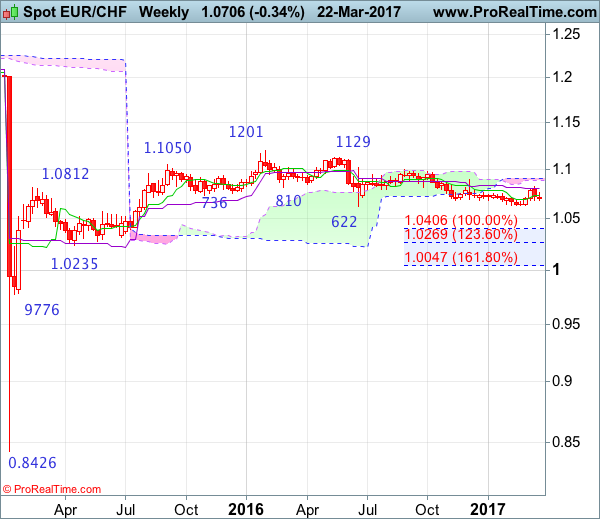
EUR/CHF – 1.0715
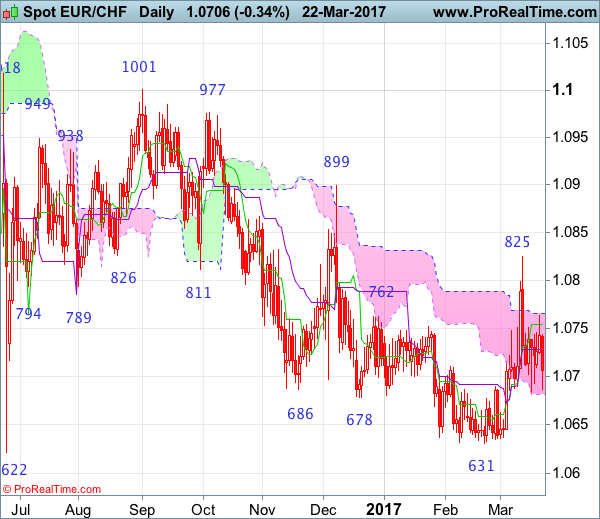
As the single currency has slipped again after last week’s sharp retreat from 1.0825, suggesting the rebound from 1.0631 has ended there and consolidation with mild downside bias is seen for another test of said support, however, break of 1.0622-31 is needed to retain bearishness and signal the decline from 1.1201 (2016 high) has resumed and extend further fall to 1.0590-00, then towards 1.0530-35 but loss of downward momentum should prevent sharp fall below 1.0500, price should stay well above 1.0400-10, risk from there has increased for a strong rebound to take place later.
On the upside, whilst recovery to 1.0720-25 cannot be ruled out, reckon 1.0763 (this week’s high) would remain intact and bring another decline later. Above 1.0763 would risk another bounce to said resistance at 1.0825 but break there is needed to shift risk back to upside and signal low has been formed, bring further subsequent gain to 1.0850 but price should falter below key resistance at 1.0899 (Dec high), risk from there is seen for a retreat later.
Recommendation: Sell at 1.0725 for 1.0525 with stop above 1.0825.
On the weekly chart, euro’s retreat after last week’s brief rise to 1.0825 formed a long black candlestick, suggesting top is possibly formed there and consolidation below this level is seen with mild downside bias for weakness towards strong support at 1.0622-31, however, break there is needed to signal recent decline from 1.1201 top has resumed and extend further fall to 1.0550-55, then 1.0500-10 but oversold condition should prevent sharp fall below 1.0400-10 (100% projection of 1.1201-1.0622 measuring from 1.1001) and price should stay well above previous support at 1.0314, risk from there is seen for a rebound to take place later.
On the upside, expect recovery to be limited to 1.0720-30 and resistance at 1.0763-70 should hold, bring another decline Only above said resistance at 1.0825 would signal low has been formed at 1.0631, bring retracement of recent decline to 1.0850 but a break above indicated resistance at 1.0899 is needed to add credence to this view and bring a stronger rebound to 1.0970-75, then test of 1.1001. Looking ahead, only a sustained breach above 1.1001 would signal the fall from 1.1201 has ended, bring further gain to 1.1100 but reckon resistance at 1.1129 would hold on first testing.
AUD/USD: Aussie Trading On A Weaker Footing This Morning
For the 24 hours to 23:00 GMT, the AUD declined 0.14% against the USD and closed at 0.7669.
LME Copper prices declined 0.9% or $53.5/MT to $5712.0/MT. Aluminium prices declined 0.4% or $8.0/MT to $1910.0/MT.
In the Asian session, at GMT0400, the pair is trading at 0.7658, with the AUD trading 0.14% lower against the USD from yesterday’s close.
The pair is expected to find support at 0.7635, and a fall through could take it to the next support level of 0.7611. The pair is expected to find its first resistance at 0.7683, and a rise through could take it to the next resistance level of 0.7707.
The currency pair is trading below its 20 Hr and 50 Hr moving averages.

EUR/USD: Euro-Zone’s Current Account Surplus Dropped To Its Lowest Level Since January 2016 In January
For the 24 hours to 23:00 GMT, the EUR declined 0.17% against the USD and closed at 1.0793.
On the economic front, the Euro-zone's seasonally adjusted current account surplus narrowed to a twelve-month low level of €24.1 billion in January, amid weaker exports and following a revised surplus of €30.8 billion in the previous month.
In economic news, existing home sales in the US dropped more-than-expected by 3.7% on a monthly basis, to a level of 5.48 million in February, after jumping to a decade high level of 5.69 million in the prior month, as tight inventory and rising home prices muted purchases. Markets expected existing home sales to ease to a level of 5.55 million. Additionally, the nation's house price index remained flat on a monthly basis in January, compared to an advance of 0.4% in the prior month, whereas investors had envisaged the index to climb 0.4%. Further, the nation's MBA mortgage applications fell 2.7% in the week ended 17 March 2017, after registering a rise of 3.1% in the previous week.
In the Asian session, at GMT0400, the pair is trading at 1.0790, with the EUR trading marginally lower against the USD from yesterday's close.
The pair is expected to find support at 1.0768, and a fall through could take it to the next support level of 1.0745. The pair is expected to find its first resistance at 1.0819, and a rise through could take it to the next resistance level of 1.0847.
Going ahead, market participants look forward to the ECB's economic bulletin report and Germany's GfK consumer confidence index for April, slated to release in a few hours, along with the Euro-zone's flash consumer confidence index for March, slated to release later in the day. Moreover, the US weekly jobless claims data and a speech from the Federal Reserve Chair, Janet Yellen, will keep investors on their toes.
The currency pair is showing convergence with its 20 Hr and 50 Hr moving averages.
