Sample Category Title
GBP/USD Stable Above 1.23
'The rally could stall here this week but if GBP/USD breaks above 1.2400 on Friday, we could see an extension to 1.25.' – Kathy Lien, BK Asset Management (based on PoundSterlingLive)
Pair's Outlook
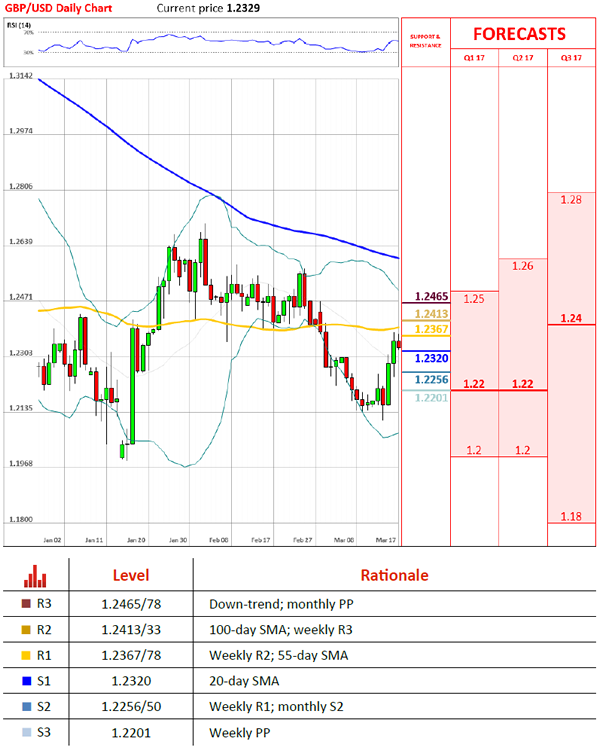
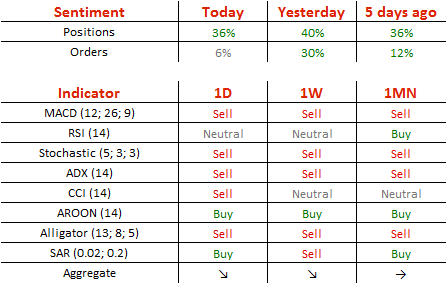
The British Pound was able to post more gains against the US Dollar on Thursday, ultimately closing at a fresh two-week high of 1.2363. The Cable's volatility was limited by the resistance around 1.2370, formed by the weekly R2 and the 55-day SMA. This tough area is likely to prevent the Sterling from appreciating again today, being a minor setback on the pair's path towards retesting the down-trend around 1.2450. Nevertheless, a bearish development is anticipated today, but with the exchange rate retaining position above the 1.23 mark. Technical studies are now able to confirm the possibility of the negative for the Pound outcome.
Traders' Sentiment
Market sentiment remains strongly bullish, namely at 68%, but the number of purchase orders declined from 65 to 53% over the day.
EUR/JPY Candlesticks and Ichimoku Analysis
Weekly
- Last Candlesticks pattern: Hammer
- Time of formation: 19 Sep 2016
- Trend bias: Down
Daily
- Last Candlesticks pattern: Hammer
- Time of formation: 9 Nov 2016
- Trend bias: Near term up
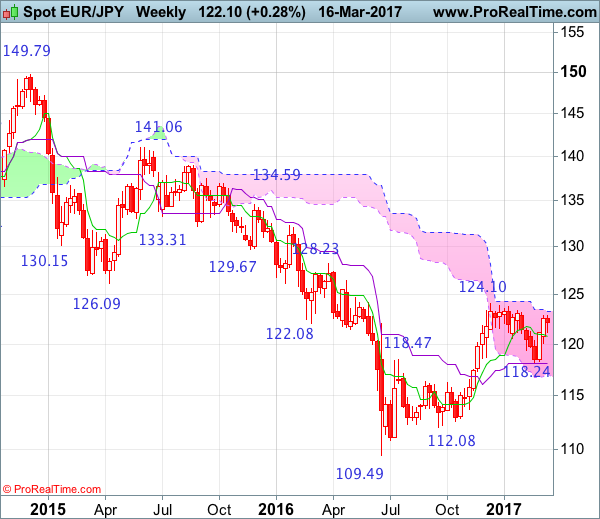
EUR/JPY – 122.09
Although the single currency slipped to 121.13 yesterday, as euro found renewed buying interest there and has rebounded, suggesting the pullback from 122.89 has possibly ended there and consolidation with upside bias is seen for gain towards this level, however, break there is needed to signal the rise from 118.24 low has resumed and extend further gain to resistance at 123.31. Looking ahead, only a daily close above resistance at 123.31 would signal the entire fall from 124.10 top has ended at 118.24 back in Feb and bring further subsequent rise towards this level which is likely to hold on first testing.
On the downside, whilst initial pullback to 121.70 cannot be ruled out, reckon the Tenkan-Sen (now at 121.46) would limit downside and bring another upmove later. A drop below said support at 121.13 would abort and suggest top is possibly formed at 122.89, bring further weakness to 120.65-70, then towards support at 120.02, only a daily close below the latter level would provide confirmation, bring further fall to 119.50-60 and possibly 119.00 but still reckon 118.80 would limit downside and price should stay well above said support at 118.24, bring another rebound later.
Recommendation: Buy at 121.50 for 123.50 with stop below 120.50.
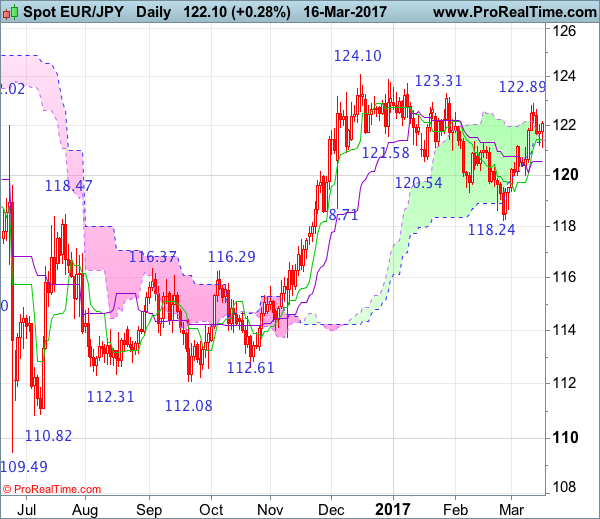
On the weekly chart, the single currency has maintained a firm undertone after last week’s rise to 122.89, suggesting bullishness remains for the rebound from 118.24 is still in progress and may extend gain to indicated key resistance at 123.31. Looking ahead, only above this level would signal recent rise from 109.49 low has resumed for retracement of early decline to 125.25-30 (50% Fibonacci retracement of 141.06-109.49), having said that, reckon resistance at 126.47 would cap upside and price should falter below resistance at 128.23, bring retreat later.
On the downside, expect pullback to be limited to 121.40-50 and the Tenkan-Sen (now at 120.78) should hold, bring another rise later to aforesaid upside targets. Only below support at 120.02 (last week’s low) would defer and risk weakness to 119.30-35 but a drop below 118.80 is needed to suggest the rebound from 118.24 has ended, bring retest of this level, a break there would signal the retreat from 124.10 top is still in progress and near term downside bias remains for this move to bring retracement of recent upmove, hence weakness towards the Kijun-Sen (now at 118.09), however, a weekly close below there is needed to signal the rise from 109.49 has ended, bring further decline to 117.30-35 but previous resistance at 116.29 should contain downside due to near term oversold condition, bring rebound later.
USD/JPY Stuck Between 113.15 And 113.75
'Overall, I think the dollar will continue to be under some pressure for a period of time in which the market has to digest what the Fed is saying.' – Ron Waliczek, INTL FC Stone (based on Business Recorder)
Pair's Outlook
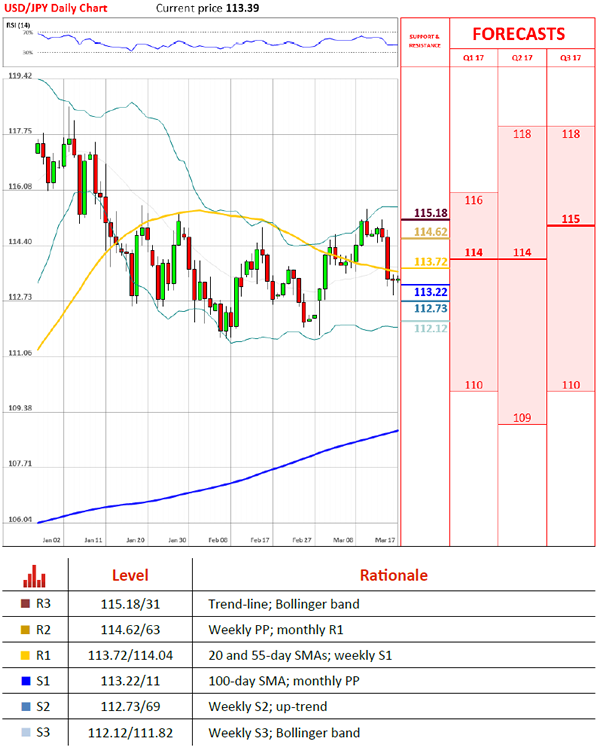
The US Dollar managed to avoid more weakness, remaining relatively unchanged against the Japanese Yen yesterday. The two immediate support clusters were strong enough to limit the losses on Thursday, but at least one of them is expected to give in in the near future. As a result, the USD/JPY pair is to drop under 113.00, leaving the ascending channel's support line to trigger a U-turn. Moreover, a rebound from this up-trend would reconfirm the channel pattern and provide sufficient bullish momentum to climb back to 115.00 and eventually breach that psychological resistance.
Traders' Sentiment
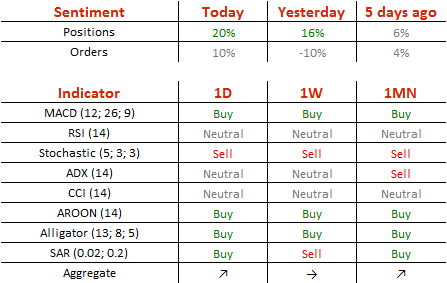
There are 60% of all open positions being long today, compared to 58% on Thursday. At the same time, the portion of orders to acquire the US Dollar added 10% points. The orders now take up 55% of the market.
Gold Remains Near 1,225 Level On Friday
'What's happening now is just an inverse trade against the dollar.' – Jiang Shu, Shandong Gold Group (based on Reuters)
Pair's Outlook
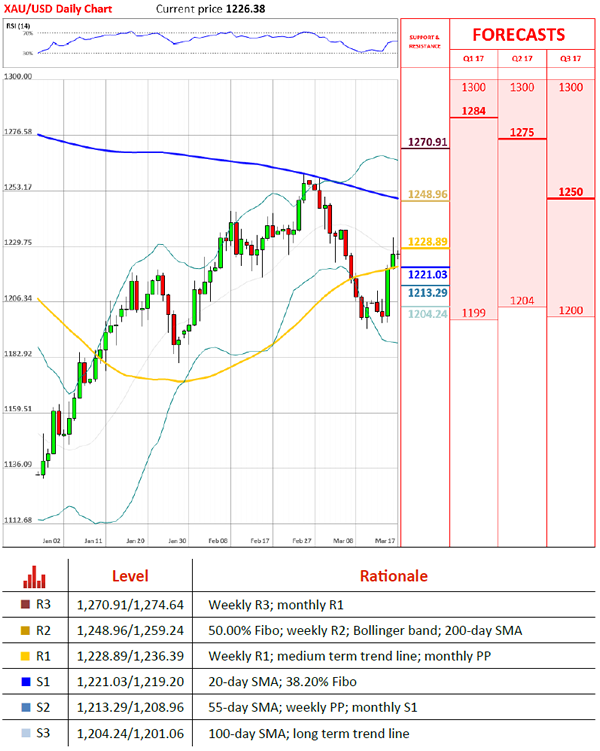
On Friday morning the yellow metal's price remained rather unchanged, as the bullion fluctuated just above the 1,225 mark. Previously, during Thursday's trading session the bullion extended the gains, which it scored on the Federal Reserve's rate hike. However, at the 1,233.59 mark the bullion encountered the resistance of a medium term descending channel, which proved strong enough to cause a minor decline in the commodity price. It is most likely that the bullion will make another attempt to break higher, as on Friday morning the decline has stopped, and the yellow metal has begun to approach the weekly R1, which is located at the 1,228.89 level.
Traders' Sentiment
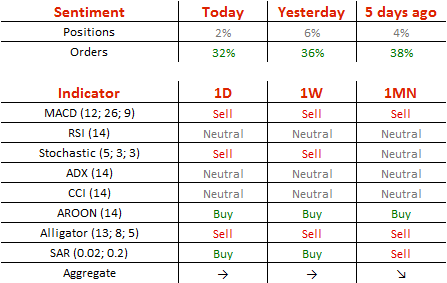
SWFX traders are almost neutral, as 51% of open positions are long. Meanwhile, 66% of trader set up orders are to buy.
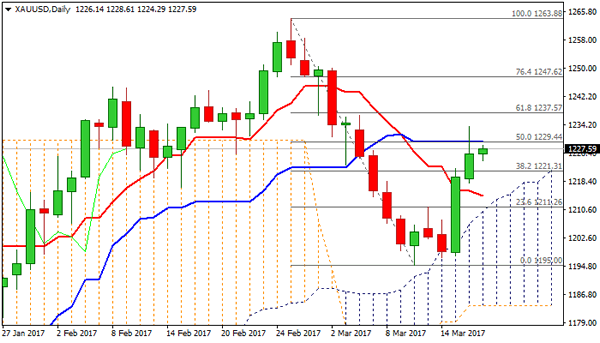
Spot Gold – Hourly Cloud Top Should Contain Dips Before Bulls Resume
Spot Gold maintains positive near-term tone and consolidating under $1233 (top of two-day post-Fed bullish acceleration from $1197).
Failure to clearly break above daily Kijun-sen at $1229 (barrier was cracked but no close above) signals consolidation, before bulls resume.
Bullishly aligned daily studies are also supportive, with thickening daily cloud that contained $1263/$1195 pullback, continuing to underpin.
Close above Kijun-sen barrier will be bullish signal for extension towards $1237 (Fibo 61.8% of $1263/$1195), with extended downticks expected to find solid support at $1221 (hourly cloud top / broken Fibo 38.2% of $1263/$1195).
Alternatively, extension below the latter and violation of $1213 (daily cloud top / Tenkan-sen) would generate stronger bearish signal.
Res: 1229, 1233, 1237, 1244
Sup: 1224, 1221, 1215, 1213
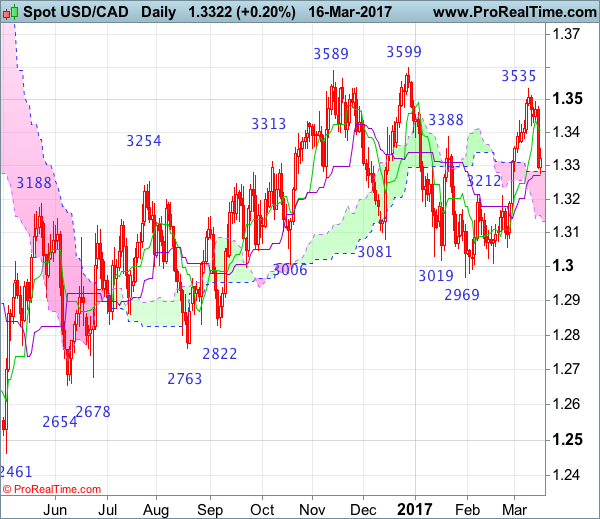
USD/CAD Candlesticks and Ichimoku Analysis
Weekly
- Last Candlesticks pattern: Bullish engulfing
- Time of formation: 02 May 2016
- Trend bias: Up
Daily
- Last Candlesticks pattern: Hammer
- Time of formation: 19 Oct 2016
- Trend bias: Up
USD/CAD – 1.3333
Although the greenback has retreated quite sharply this week and further consolidation below recent high of 1.3599 would be seen and initial downside risk remains for test of the Kijun-Sen (now at 1.3272), reckon downside would be limited to 1.3250 and bring another rebound later, above the Tenkan-Sen (now at 1.3406) would bring rebound to 1.3495-00 but break there is needed to signal the retreat from 1.3535 has ended, bring retest of this level. looking ahead, only a break of this level would retain bullishness and extend early erratic upmove from 1.2461 low to 1.3599, then 1.3660-70 but still reckon upside would be limited to 1.3700 and risk from there is seen for a retreat later.
On the downside, whilst initial fall to 1.3270-75 cannot be ruled out, reckon 1.23240-50 would limit downside and bring another rebound later. Only below previous resistance at 1.3210 would abort and signal top has indeed been formed at 1.3535, bring further fall to 1.3160-65 and possibly towards 1.3100 but price should stay well above support at 1.3056, bring rebound later. Only a daily close below this level would revive bearishness and signal the rebound from 1.2969 has indeed ended, bring further fall to 1.3000 first but said support at 1.2969 should remain intact.
Recommendation: Buy at 1.3250 for 1.3450 with stop below 1.3150.
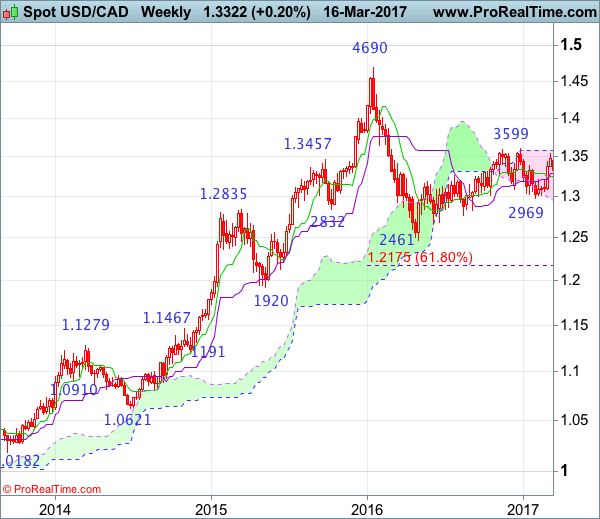
On the weekly chart, despite last week’s rise to 1.3535, this week’s retreat looks set to form a black candlestick and consolidation below resistance at 1.3535 would be seen and pullback to the Kijun-Sen (now at 1.3284) cannot be ruled out, however, reckon the Tenkan-Sen (now at 1.3252) would limit downside and bring another rebound, above 1.3400 would bring rebound to this week’s high at 1.3495 but a weekly close above there is needed to signal retreat from 1.3535 has ended, bring retest of 1.3535, above there would extend recent rise from 1.2969 to indicated resistance at 1.3599, however, a break of this resistance is needed to retain bullishness and signal upmove from 1.2461 (2016 low) has resumed for headway to 1.3700 and later towards 1.3835-40 (61.8% Fibonacci retracement of 1.4690-1.2461) which is likely to cap upside.
On the downside, although pullback to 1.3280-85 cannot be ruled out, reckon downside would be limited to the Tenkan-Sen (now at 1.3252)and bring another rise later. A drop below previous resistance at 1.3210 would suggest a temporary top is formed instead, risk weakness to 1.3150-60, break there would add credence to this view and signal the rebound from 1.2969 has ended, bring further fall to towards 1.3083, however, indicated support at 1.3056 support should hold.
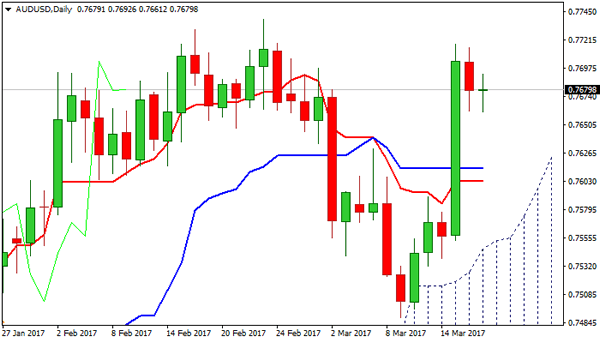
AUDUSD – Hourly Cloud To Hold Consolidation Before Final Push To 0.7739 Target
Bull-leg from 0.7489 (09 Mar correction low) is showing strong hesitation at 0.7700 barrier, signaled by repeated failure to clearly break above it.
Near-term structure, however, remains bullish and underpinned by rising daily cloud that also contained recent corrective phase (0.7739/0.7489).
Easing from fresh recovery highs at 0.7717 so far found footstep at 0.7663 (Fibo 23.6% of 0.7489/0.7517 rally top of thick hourly cloud), but extended dips cannot be ruled out.
Strong support at 0.7630 (hourly cloud base / Fibo 38.2%) should contain to prevent risk of deeper pullback and reversal signal.
Near-term focus remains at 0.7739 (23 Feb high) and 0.7776 (08 Nov peak) in extension.
Res: 0.7692, 0.7717, 0.7739, 0.7758
Sup: 0.7663, 0.7630, 0.7600, 0.7576
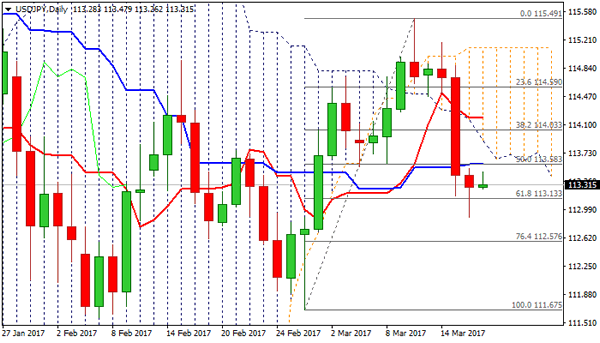
USDJPY Is Consolidating Above Cracked Fibo Support At 113.13, Thickening Daily Cloud Weighs
Near-term sentiment remains negative, as steep post-Fed fall extended on Thursday and cracked pivotal support at 113.13 (Fibo 61.8% of 111.67/115.49 rally / rising 100SMA), but failed to close below.
Recent strong upside rejection that formed Bull-trap pattern and subsequent strong acceleration lower, confirmed reversal and signal further downside.
Eventual close below 113.13 is needed to confirm bearish continuation and expose next target at 112.57 (Fibo 76.4% retracement.
Thickening daily cloud continues to heavily weigh on near-term action, which is so far holding below initial barrier at 113.58 (daily Kijun-sen), guarding daily cloud base (113.90), where extended upticks should be ideally capped.
Res: 113.47, 113.58, 113.90, 114.19
Sup: 113.13, 112.89, 112.57, 112.00
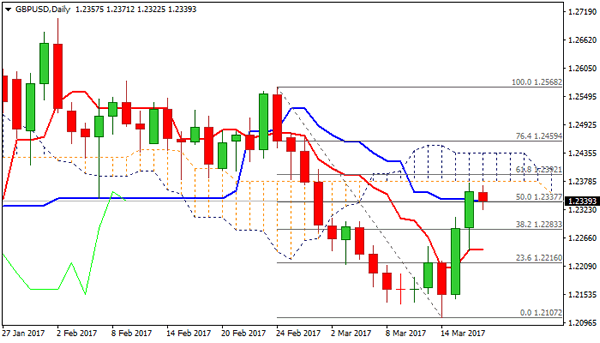
GBPUSD – Strong Post Fed, BoE Rally Is Consolidating Under Daily Cloud
Cable maintains strong bullish sentiment that came in play after Fed and accelerated further after BoE on Thursday. Two-day rally peaked at 1.2375, being so far capped by falling 30SMA and just ticks ahead of base of daily Ichimoku cloud (spanned between 1.2379 and 1.2435). Break above the cloud would generate another strong bullish signal for further retracement of 1.2568/1.2107 downleg. Meantime, consolidative/corrective phase could be expected ahead of fresh attempts higher. Broken 20SMA marks immediate support at 1.2315, with extended dips to hold above 1.2240 zone (yesterday's low/daily Tenkan-sen line).
Res: 1.2379, 1.2392, 1.2435, 1.2459
Sup: 1.2315, 1.2272, 1.2239, 1.2200
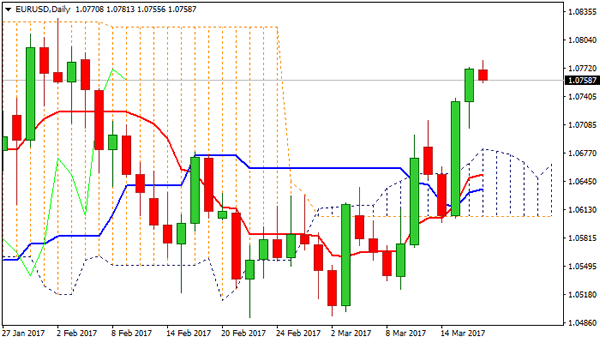
EURUSD – Bulls Eye 1.0827 Peak, Daily Cloud To Contain Extended Dips
The Euro closed above Fibo 76.4% barrier at 1.0748 on Thursday, confirming strong bullish stance after Fed.
This signals further upside and full retracement of 1.0827/1.0492 downleg as likely near-term scenario.
The pair is on track for the third consecutive bullish weekly close that confirms the notion.
Overbought near-term studies suggest that final push towards 1.0827 target might be preceded by corrective dip.
Yesterday's low at 1.0704 marks initial support, ahead of daily cloud top at 1.0681, which is expected to keep downside protected.
However, stronger pullback on end-of-week profit taking cannot be ruled out. Below cloud top, daily Tenkan-sen and Kijun-sen lines offer next supports at 1.0652 and 1.0637 respectively.
Any extension below the latter would weaken near-term structure and risk test of lower breakpoint at 1.0605 (daily Ichimoku cloud base).
Res: 1.0781, 1.0800, 1.0827, 1.0872
Sup: 1.0738, 1.0704, 1.0681, 1.0652