Sample Category Title
EURUSD – Larger Bears May Take a Breather Before Probing Through 2026 Low
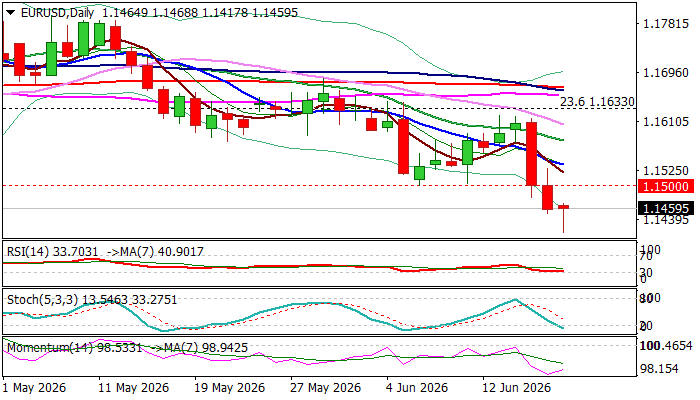
The Euro trades near 2026 low (1.1410) on Friday, holding in red for the third straight day, in reaction to hawkish signals from Fed (the pair has registered the biggest daily loss since 30 July 2025 on Wednesday, following Fed’s hawkish hold).
The price neared YTD low on Friday, but subsequent bounce that created long tail on daily candle signals that bears started to face increased headwinds on approach to significant support.
This may lead to scenario of consolidation / limited correction, as oversold conditions and end of the week could spark partial profit taking.
Overall structure remains firmly bearish on daily chart (reinforced by the latest 100/200 DMA bear cross) suggesting that bears may take a breather to position for fresh push lower.
Broken 1.1500 support (former base / round-figure) reverted to initial resistance, followed by falling 10DMA (1.1536) which should ideally cap upticks.
Firm break of 1.1410 (2026 low) and 1.1355 (Fibo 38.2% of 1.0177/1.2082 rally) would generate strong bearish signal and open way for deeper correction of Jan 2025 / Jan 2026 ascend.
Res: 1.1500; 1.1536; 1.1578; 1.1620
Sup: 1.1410; 1.1355; 1.1283; 1.1215
Bitcoin Breaks the Channel, ETHereum Fails to Reclaim Support
Market Overview
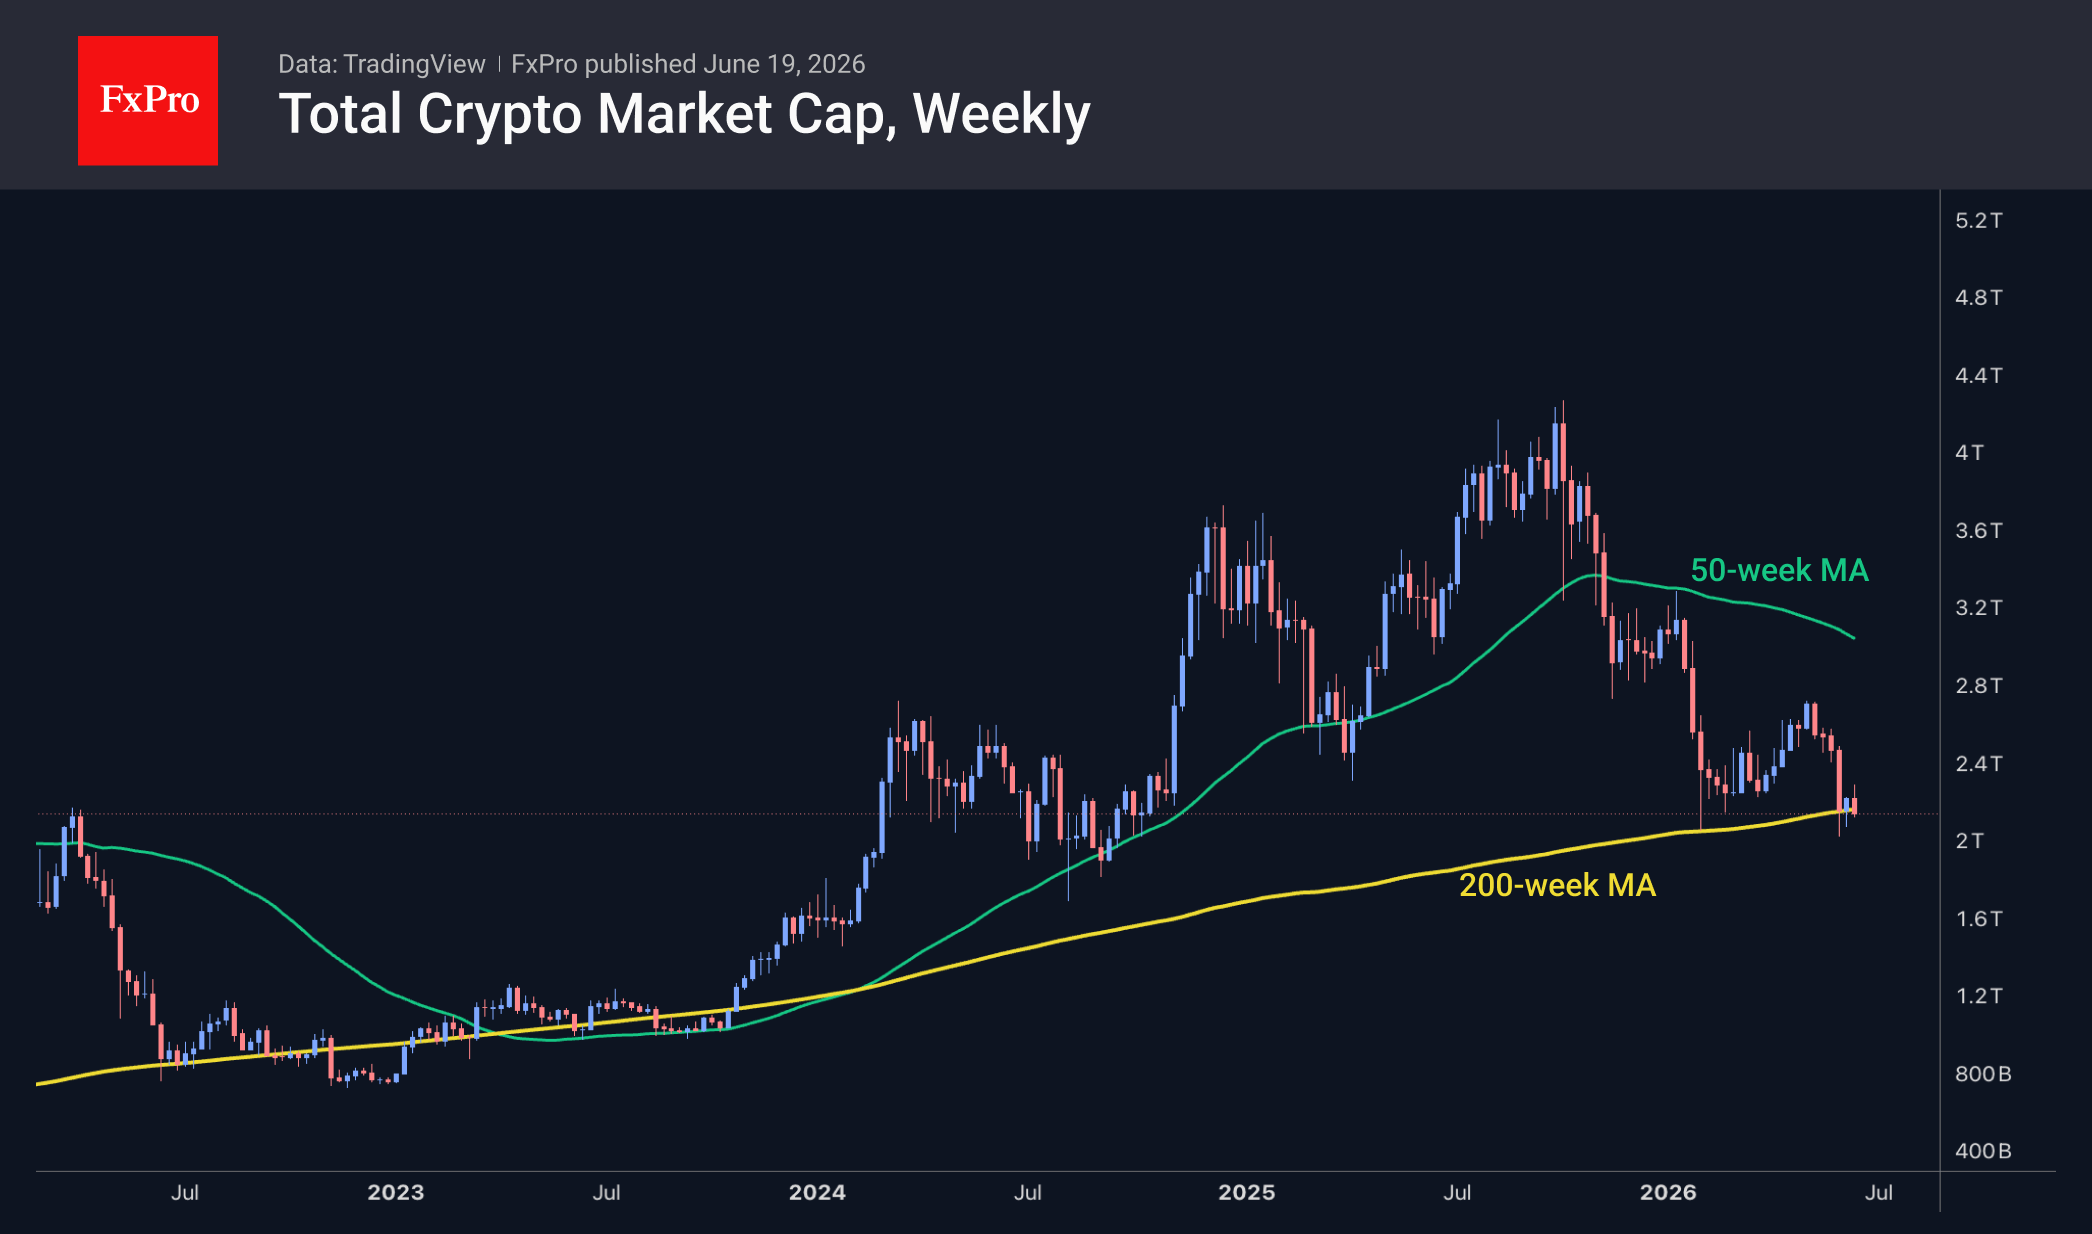
The crypto market has fallen 1.8% over the past 24 hours, to $2.16T, continuing its downward trend after a rebound in the first half of the month. Market capitalisation has once again returned to its 200-week moving average, around which it has been fluctuating for the third consecutive week. We should be prepared for a prolonged period of trading near or below this line, as was the case from June 2022 to October 2023, when periods below it lasted between 4 and 18 weeks. Among the most liquid coins, only three have gained over the past day: The Graph (+1.8%), Aave (+0.3%) and Tron (+0.1%). The worst performers on our list were Avalanche (-8.6%), Bitcoin Cash (-6%) and SushiSwap (-5%).
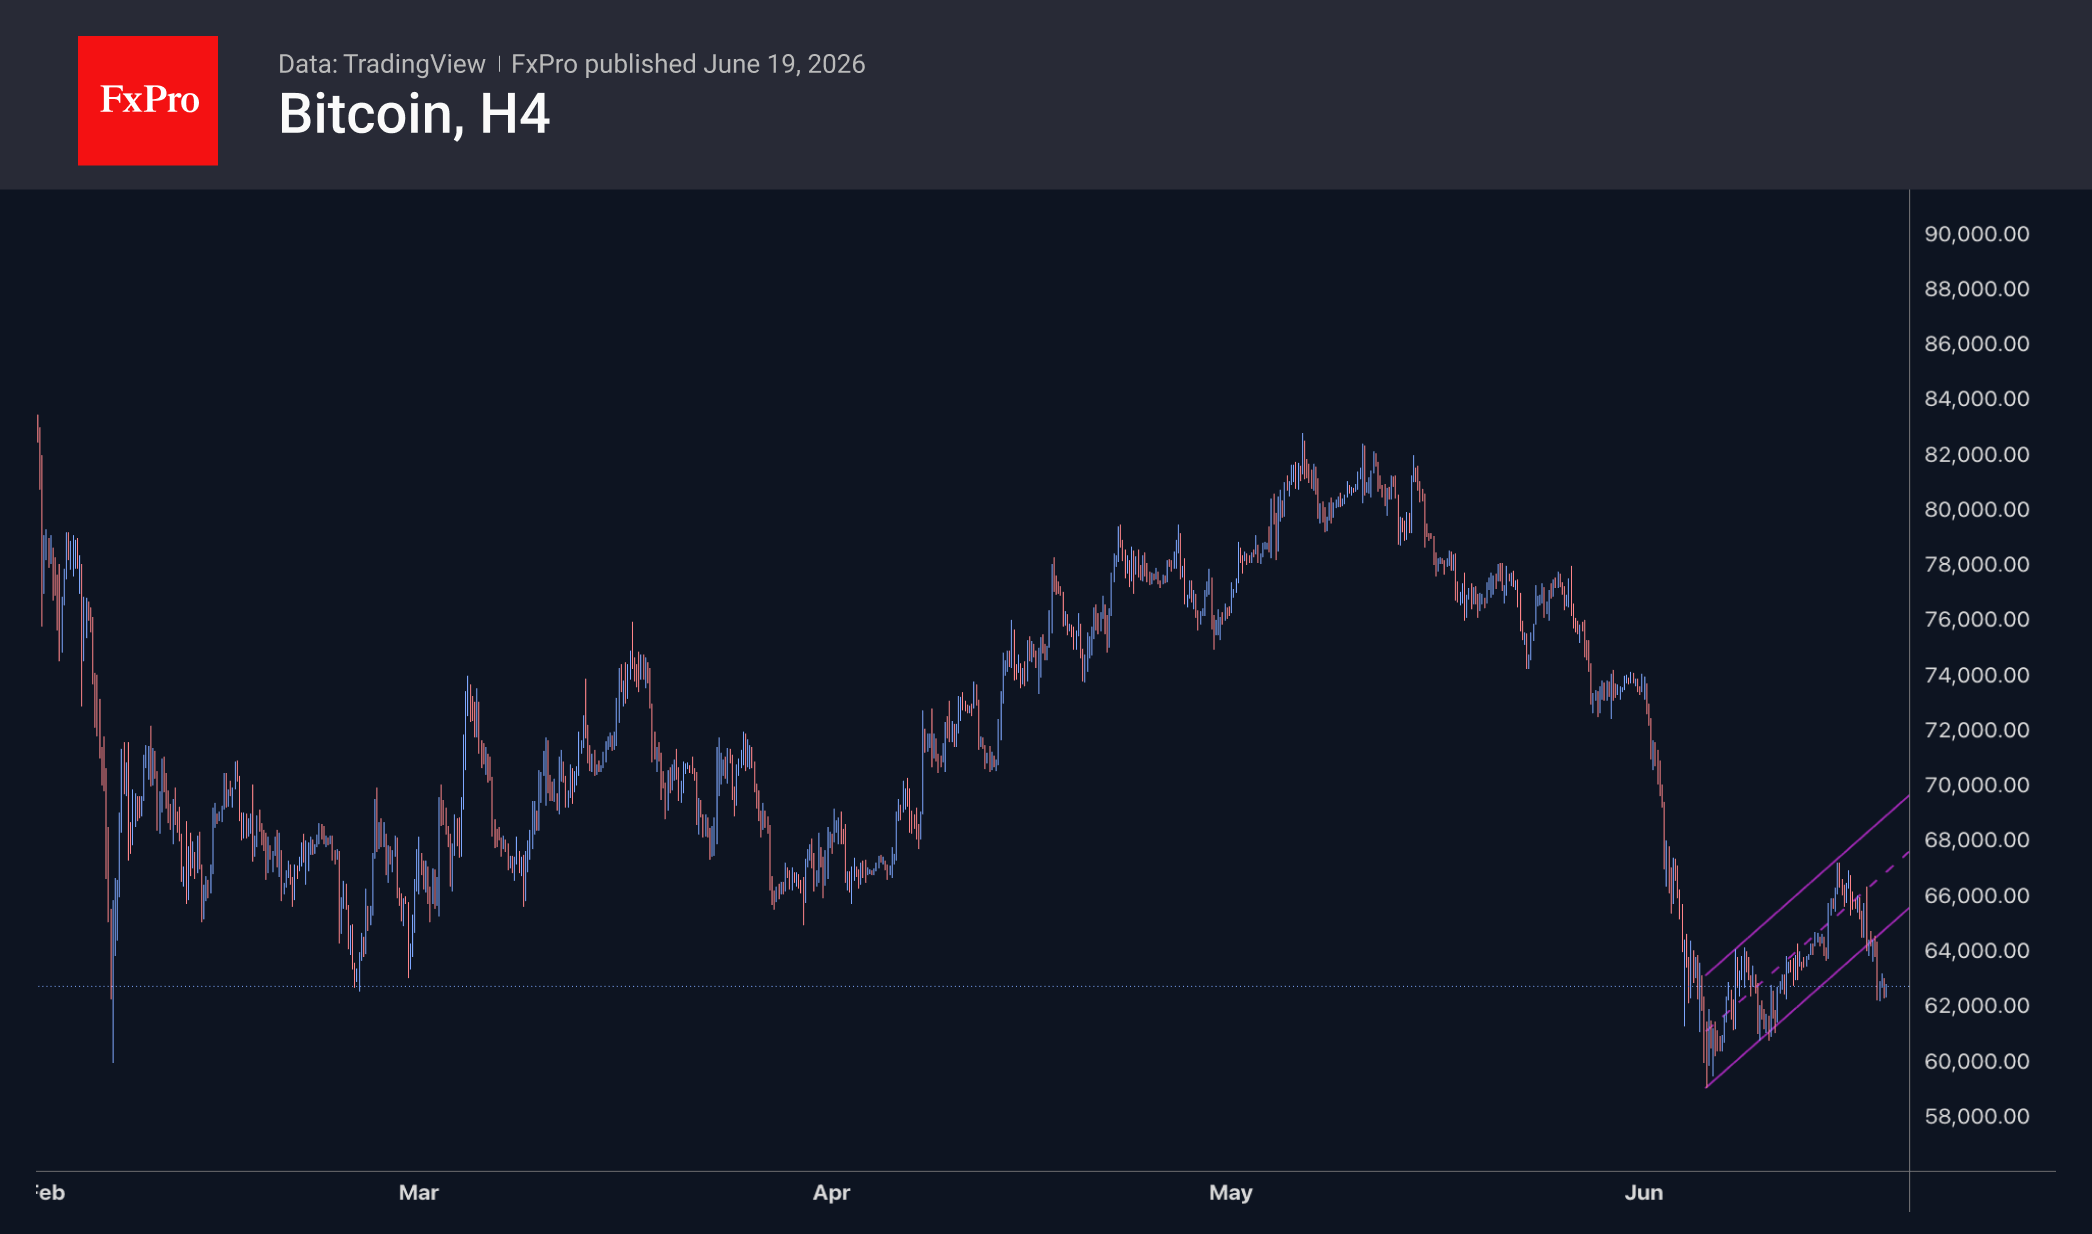
The price of Bitcoin has broken out of its upward channel and has traded predominantly below $63K since late Thursday. The bulls still have some hope, as a formal break of the trend would require the price to settle below previous lows near $61.5K. Even in this scenario, the price decline could stall in the $59–60K range, which represents this year’s most critical support level. The significance of this area is reinforced by the fact that the 2021 highs and the 2024 consolidation zone were located near it.
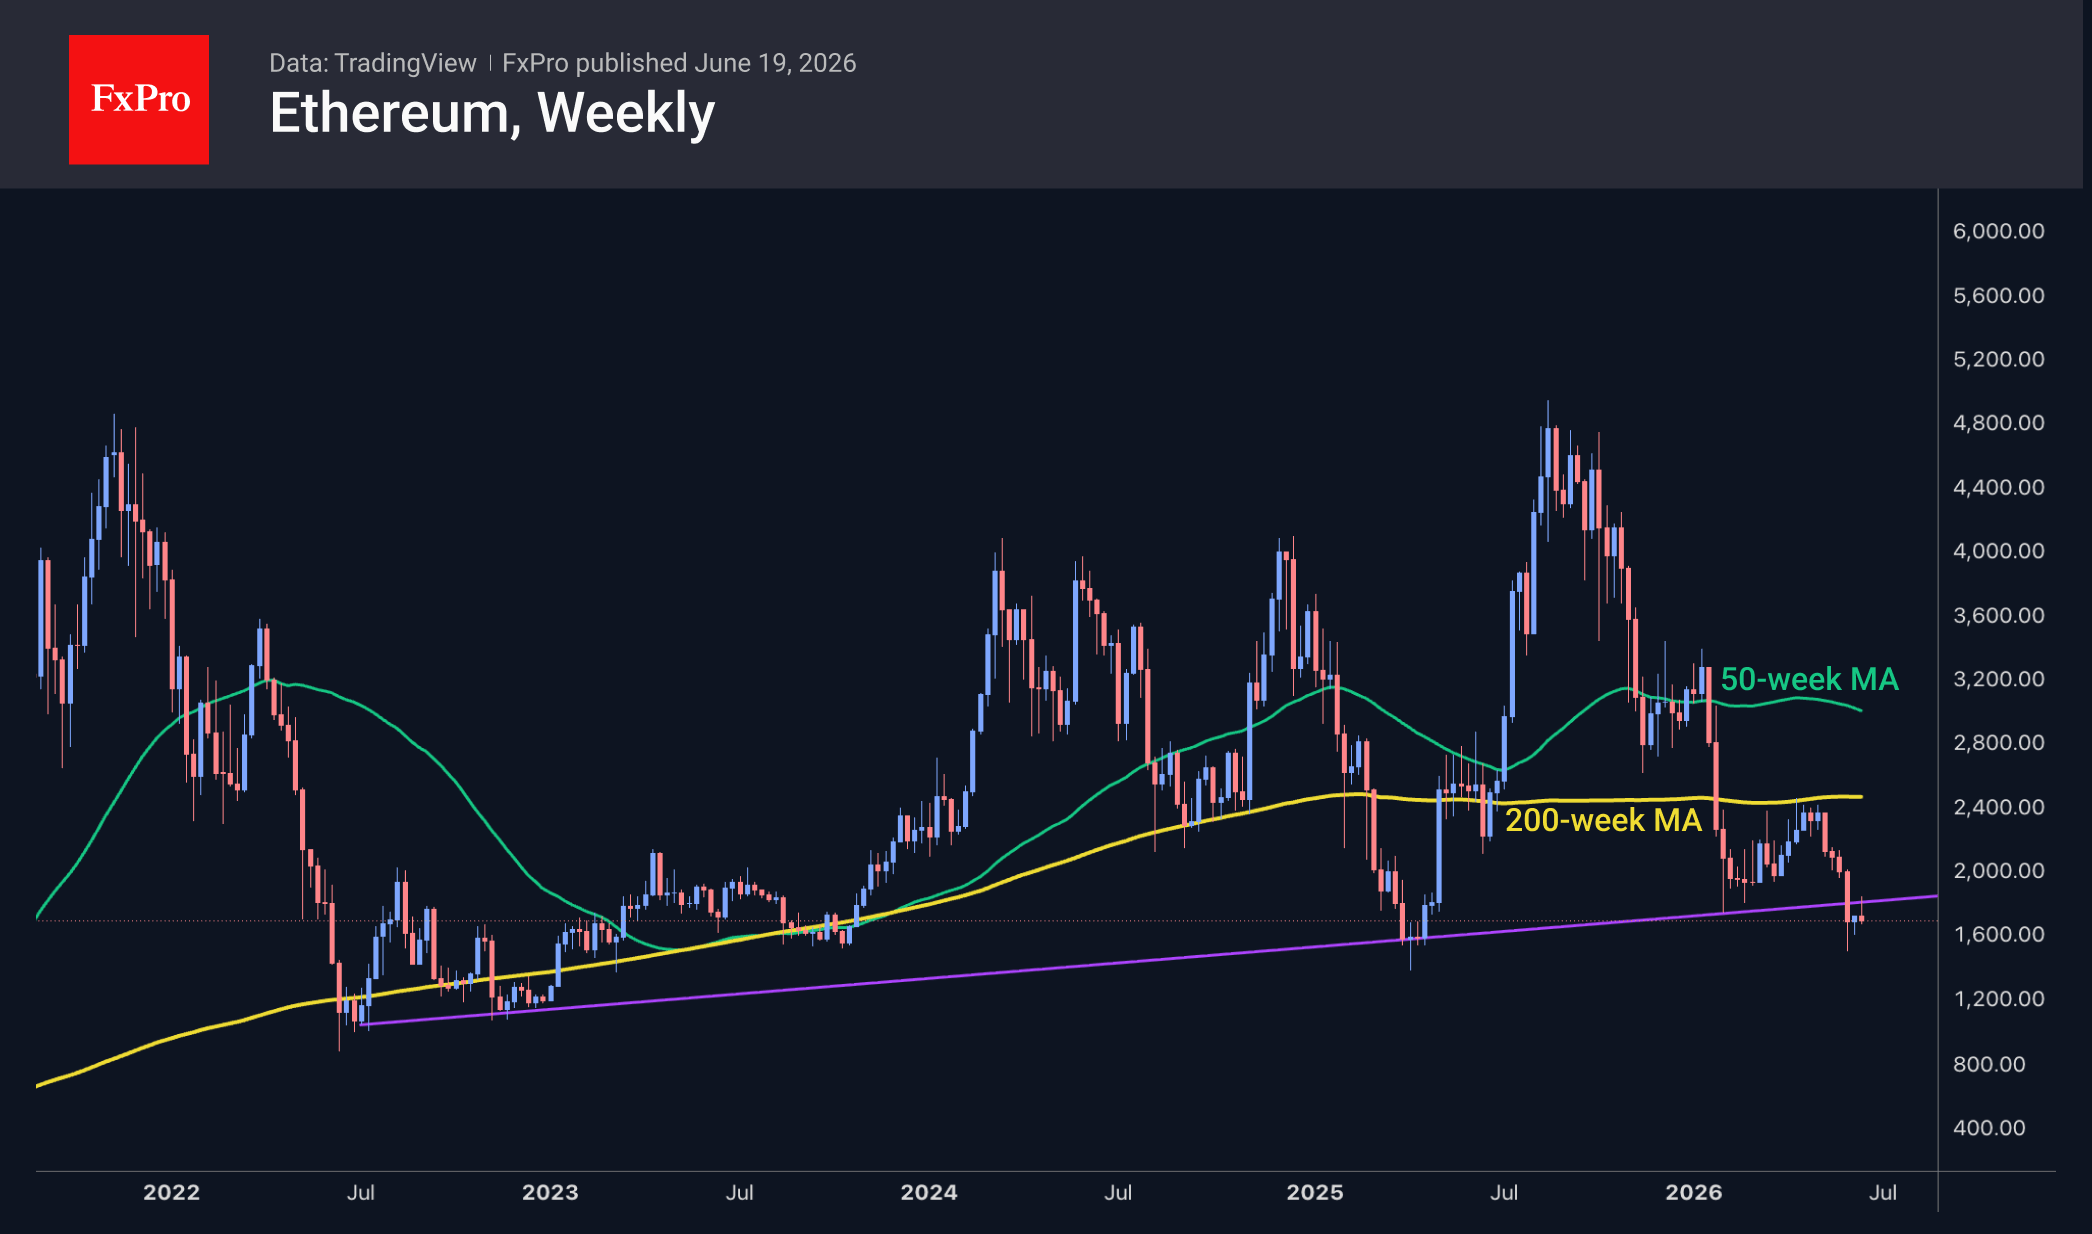
Ethereum is struggling, having failed to return to the area above the long-term support line from which it has been bought back over the past four years. The rebound in the first half of the month was modest, failing to push the price above the February–March support zone. Earlier, ETHUSD was actively sold off after a failed attempt to climb above the 200-week MA. The subsequent rebound proved short-lived. Going forward, we will be monitoring price action near the support levels at $1.5K, $1.2K, and $1.0K, where the most recent bullish reversals have occurred.
News Background
Bitcoin’s on-chain metrics indicate that the bearish trend is continuing, according to Glassnode. BTC is trading 19% below the true market price, currently $77.2K. Spot liquidity has improved, but the market remains fragile.
The crypto industry is experiencing the most severe downturn in its history, yet even in this crisis, there are positive factors, according to blockchain company StarkWare. The outflow of capital from major companies’ cryptocurrency holdings could reset and cleanse the crypto market.
According to Arkham Intelligence, Bhutan has transferred 533 bitcoins, worth around $34.5 million, to the Binance cryptocurrency exchange. The balance of the kingdom’s publicly tracked wallets has fallen from a peak of 13,000 in October 2024 to 1,750 BTC.
Monero developers have warned miners about a vulnerability affecting rewards in the decentralised mining pool P2Pool. Attackers are already exploiting this flaw, so network participants need to update their software urgently.
Changpeng Zhao, co-founder of the Binance cryptocurrency exchange, has called on all countries worldwide to migrate stock markets to the blockchain and issue their own state-backed stablecoins pegged to fiat currencies. In his view, tokenisation has the potential to make stock markets more accessible to investors.
The FxPro Analyst Team
The Fed Drove the Dollar to Its Previous Peaks
- Following the tariffs, investors were also expecting the US dollar to strengthen.
- The Bank of England has not ruled out a rise in the repo rate.
The US dollar has recorded its best two-day rally since the start of the armed conflict in the Middle East. At that time, it rose on strong demand for safe-haven assets and its role as the currency of a net energy exporter. The DXY briefly exceeded 101, touching its highest level in the past 13 months. This time, the market is not being driven by a shock but by a gradual reassessment of the outlook for monetary policy over the past month. This reassessment, stemming from a shift in market views on the future of the federal funds rate, has gained fresh momentum following hawkish comments from Fed chair Kevin Warsh.
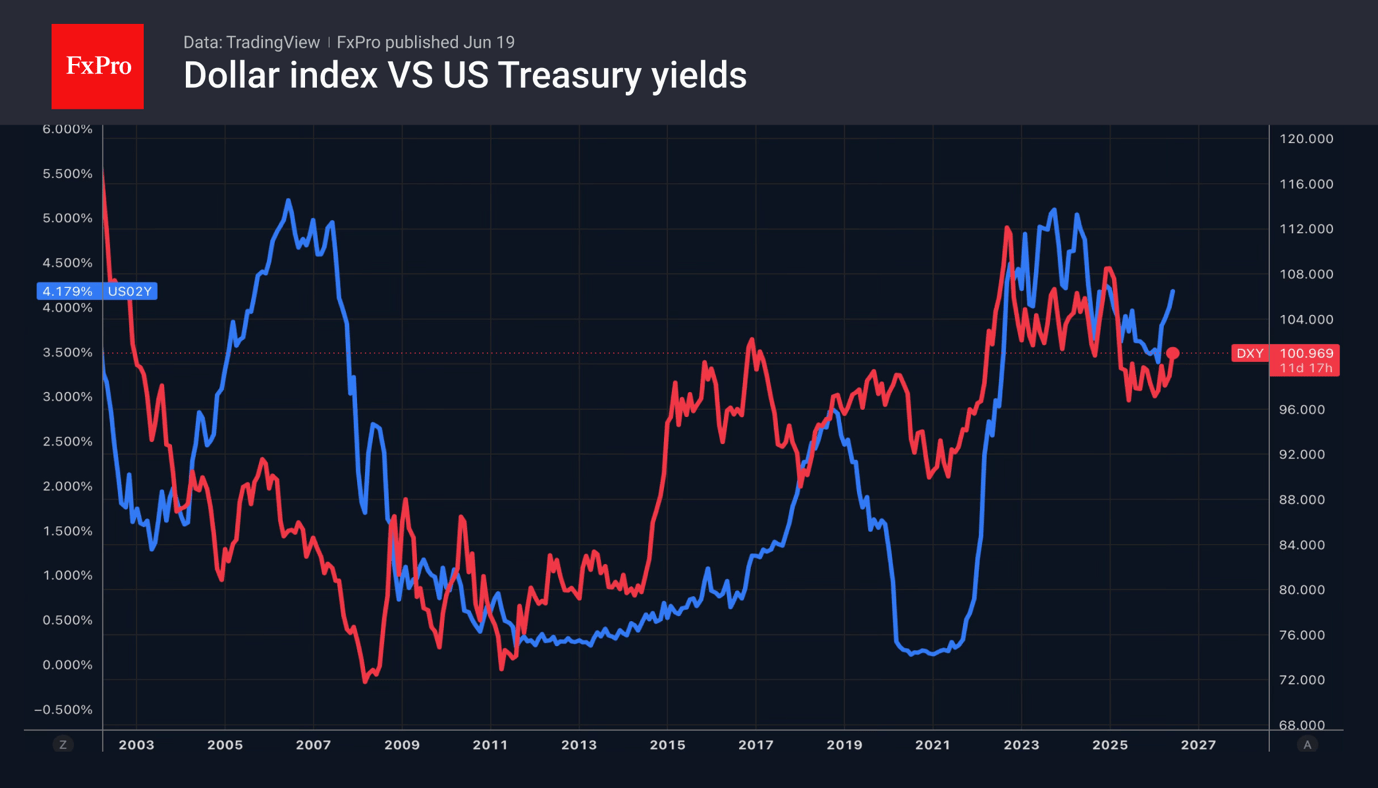
Just a week ago, the probability of at least two rate rises in 2026 stood at 17%; it has now risen to 53%. This has pushed yields on 2-year Treasuries to their highest levels since February 2025, lifting the dollar index to its highest level since May 2025.
At that time, a month after the tariffs were announced, it was believed they would have a significant pro-inflationary effect, forcing the Federal Reserve to raise rates. In fact, the central bank cut rates in September, October and December last year, triggering a decline in the dollar. Expectations that this cycle would continue this year triggered a sell-off in December and January.
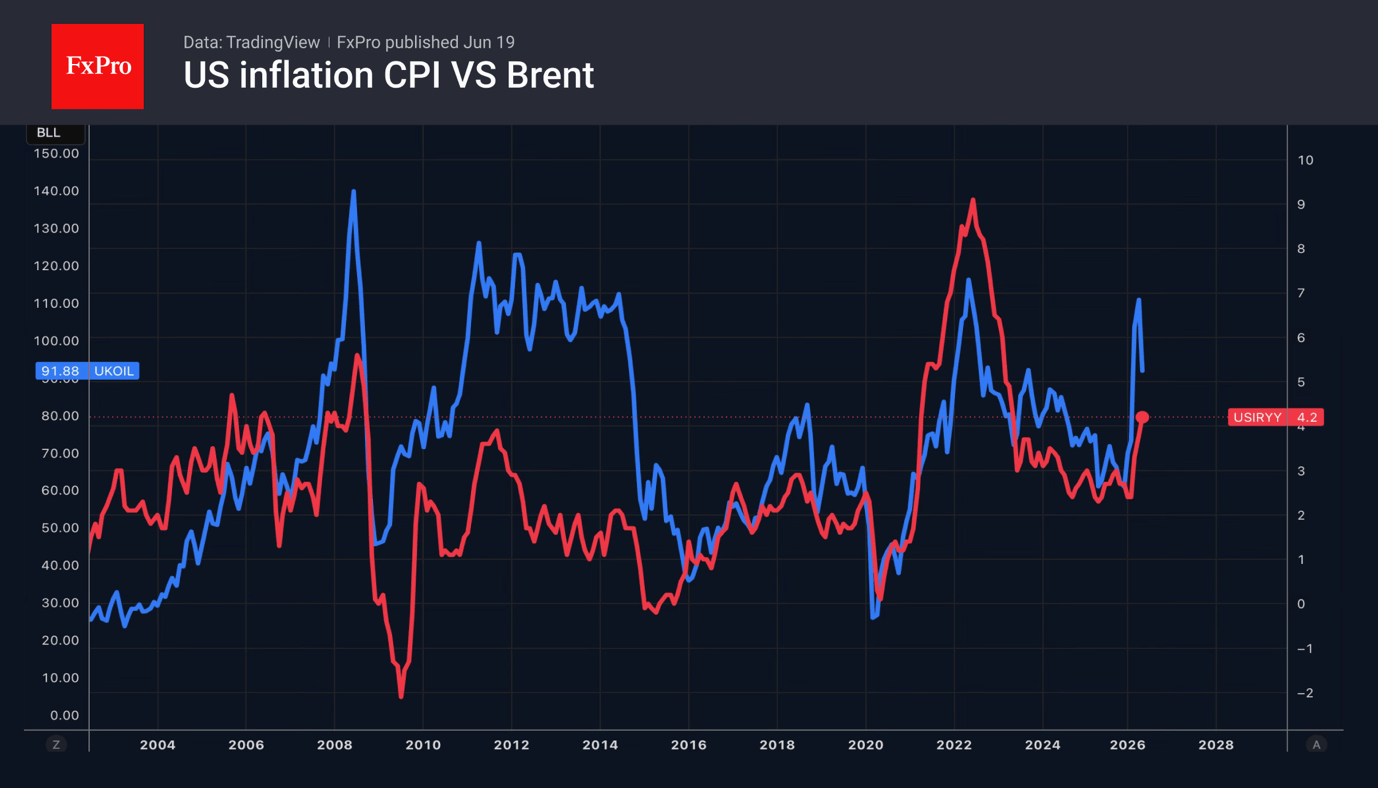
There is also a current narrative that the Fed’s intention to bring inflation back to its 2% target will force it to raise rates. However, Capital Economics believes that US consumer prices already peaked in May at 4.2% year-on-year. As oil and petrol prices fall, the CPI will slow. Therefore, the likelihood of monetary policy tightening is probably overestimated by the futures market, and a reversal of this assessment will weaken the US currency.
Meanwhile, as expected, the Bank of England kept the repo rate at 3.75%. Forecasts for peak inflation were revised down from 3.6% to 3.25%. For the BoE, the end of the conflict in the Middle East has reduced the risk of consumer price inflation accelerating but not eliminated it. This prevents the central bank from ruling out a tightening of monetary policy.
The US dollar’s strength has pushed USDJPY towards 40-year highs. The market has ignored comments by Japan’s Finance Minister Satsuki Katayama that the government is prepared to take bold and decisive action. It is clear that this is currently partly a story of a strong dollar rather than a weak yen, but USDJPY is trading near or above several of the last 40 years’ peaks. Interventions have occurred at these levels on numerous occasions. Will Japan intervene now?
The FxPro Analyst Team
ECB’s Lane Says Staying at 2% Was Not an Option, Wunsch Signals Hike Risk
The European Central Bank may have delivered its June rate hike, but its policymakers are already making the case for why the tightening cycle may not be over. Speaking in Paris today, Chief Economist Philip Lane dismissed suggestions that the ECB should have paused this month, arguing that "it would be very hard to make the case we should have stayed" at 2%. In his view, inflation remains too high, while the Eurozone's economy and financial system have shown enough resilience to absorb higher borrowing costs.
More importantly, Lane offered fresh insight into how the ECB's thinking on interest rates is evolving. Earlier this week, he revealed that the upper end of the Bank's estimate of the neutral interest rate has increased from 2.25% to 2.50%. While neutral rate estimates are inherently uncertain, the shift suggests policymakers see less risk that current policy settings are excessively restrictive. It also implies there may be additional room for tightening if inflation proves more stubborn than expected.
That concern is increasingly centered on services inflation. Belgian central bank governor Pierre Wunsch pointed directly to May's jump in Eurozone services inflation from 3.0% to 3.5%, describing it as a "not-so-nice reading." Wunsch warned that if similar data continue to emerge, another 25 basis point increase could be warranted. "Maybe you want to hike another 25 basis points to be on the safe side," he said, before cutting rates later once inflation pressures begin to recede.
The message from both officials is clear: the ECB is not preparing markets for another immediate move, but neither is it signaling that rates have peaked. Wunsch said he would be comfortable waiting until September only if incoming data remain inconclusive. Otherwise, "if the data is not going in the right direction, I would plead for a second hike and not for waiting." With services inflation and wage growth now replacing energy prices as the primary concern, the debate within the ECB appears to be shifting from whether rates are restrictive enough to whether inflation is proving persistent enough to justify another increase.
EUR/USD Loses Ground as Market Sentiment Favours the US Dollar
EUR/USD fell on Friday to its lowest level since 31 March 2026 and is holding near 1.1457. The US dollar is being supported by rapidly growing expectations of further Federal Reserve policy tightening following more hawkish-than-expected signals from the regulator.
This week, the Fed left interest rates unchanged. However, the updated forecasts showed that half of FOMC members still see at least one rate hike as possible in the future. At the same time, the regulator raised its inflation projections, taking into account the impact of the recent conflict in the Middle East.
New Fed Chair Kevin Warsh did not provide the market with clear guidance on the next interest rate decision. However, he confirmed that bringing inflation back to the target level remains the US central bank’s priority.
Meanwhile, the interim peace agreement between the US and Iran has officially come into force. This helped reduce geopolitical tensions and pushed oil prices lower.
However, the market continues to focus more on the outlook for the Fed’s monetary policy than on the improved foreign policy backdrop. This is providing strong support for demand for the US dollar.
EUR/USD Technical Analysis
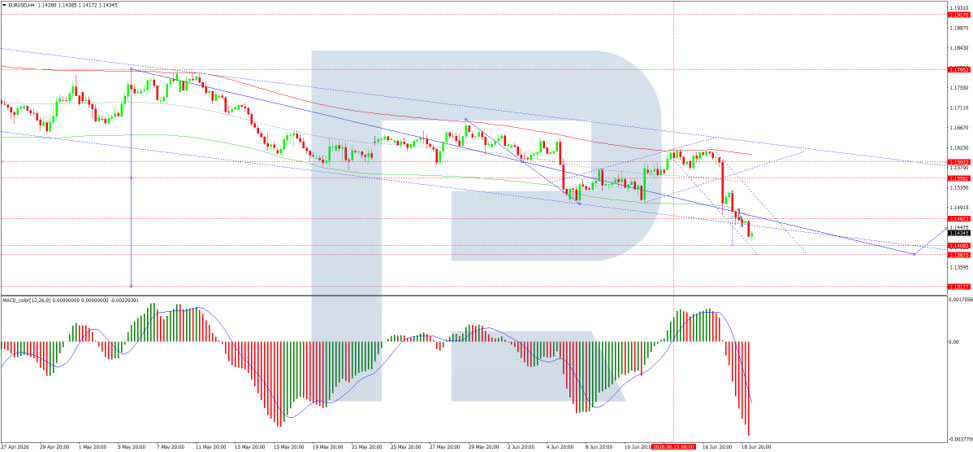
On the H4 chart of EUR/USD, the market formed a consolidation range around 1.1467 today. At the moment, the range has expanded downwards to 1.1417 and upwards to 1.1450. If the price breaks out of this range to the upside, a corrective wave towards 1.1590 is expected. After that, a decline to 1.1385 may follow. If the price breaks out directly to the downside, the potential will open for a downward wave towards 1.1313. Technically, this scenario is confirmed by the MACD indicator: its signal line is below zero and directed firmly downwards, reflecting the persisting bearish momentum and the potential for the downtrend to continue.
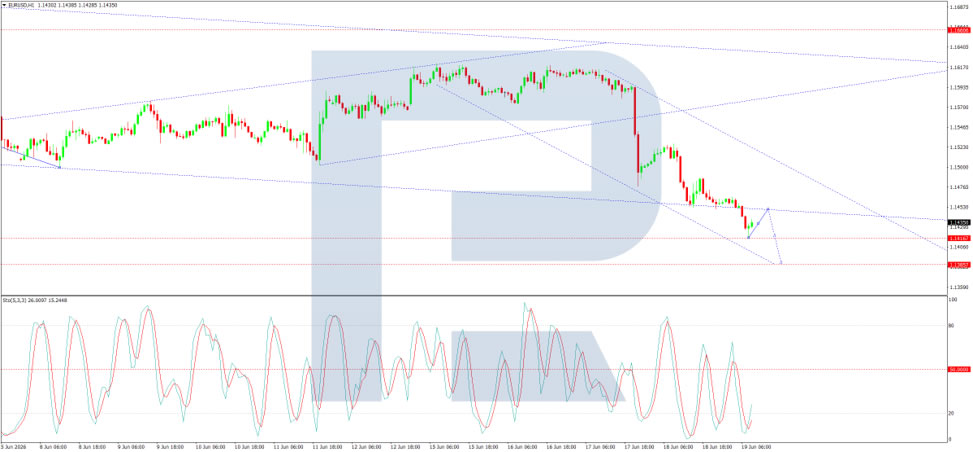
On the H1 chart, the market has completed the structure of another growth wave towards 1.1480. At the moment, a consolidation range is forming below this level. Today, the relevant scenario suggests a possible expansion of the range downwards to 1.1414 and upwards to 1.1444, followed by a decline to 1.1385. Technically, this scenario is confirmed by the Stochastic oscillator: its signal line is below 20. A rise towards 50 is expected, followed by a firm downward move back towards 20.
UK Retail Sales Surge 1.2% in May as Warm Weather and Promotions Boost Spending
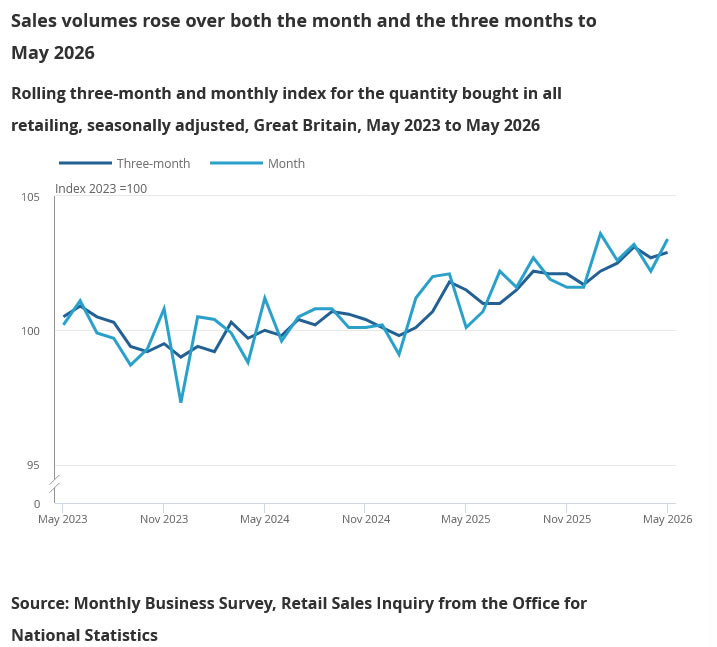
UK retail sales volumes rose 1.2% mom in May, comfortably beating expectations of 0.5% mom and providing fresh evidence that consumer spending remains resilient despite high interest rates and a slowing economy. Sales volumes were also up 3.2% from a year earlier. Retailers attributed much of the strength to promotional activity and unusually warm weather, which boosted demand across both physical stores and online channels.
The strongest gains came from non-store retailers, where sales volumes jumped 6.1% on the month, the largest increase since February 2025 and enough to lift volumes to their highest level since January 2022.
The broader trend in spending also improved. Retail sales volumes rose 0.4% in the three months to May compared with the preceding three-month period and were 1.4% higher than a year earlier.
UK Retail Sales (May)
| Indicator | Actual | Expected |
|---|---|---|
| Retail Sales M/M | 1.2% | 0.5% |
| Retail Sales Y/Y | 3.2% | - |
| 3-Month Retail Sales Change | 0.4% | - |
| 3-Month Retail Sales Y/Y | 1.4% | - |
Sunrise Market Commentary
Markets
Needless to say that new Fed chair Warsh made it clear that he wants to break with the Bernanke-Yellen-(Powell) era. Inflation has been running above target for five years and it’s time to fix that. The Fed will deliver on its price stability target and wants markets to take the lead. Less is more when it comes to communication. While a task force is responsible to figure out a new communication strategy by autumn, Fed members clearly got their in-between instructions. The amount of public comments following Wednesday’s FOMC meeting: zero. Up until last meeting, they tripped over each other to defend personal views and opinions. Next week, only four public appearances have been scheduled so far, with only one of them definitely focused on monetary policy (Chicago Fed Goolsbee on Friday). So far, Warsh gets what he wants from markets as well. On Tuesday, they fully discounted a rate hike by the January 2027 policy meeting. After the FOMC meeting, they repositioned towards October of this year. By yesterday’s close, a September rate hike is fully discounted with the market implied probability of July action rising to almost 40%! All it will take is one more inflation report to take this all the way to 100% given that the Summary of Economic Projections showed that half of the committee deems it necessary to hike the policy rate at least one time this year. May PCE deflators (published next Thursday) are the next key reference with June CPI numbers due on July 14. The prospect of Fed rate hikes backed by economic strength helps the US dollar take the lead on FX markets. EUR/USD fell from 1.16-levels on Wednesday to currently 1.1425 and prepares a test of the downside of the sideways range in place for almost a year now (1.1392). In case of break, we look at 1.1340 (38% retracement on 2025 rally) and 1.1111/1.1065 (50% retracement and May 2025 low). USD/JPY serves as catalyst for overall dollar strength. The pair tested the 2024 top at 161.95. A break higher is likely as the BoJ’s gradual normalization process is no match for the hawkish shift by the Fed. Japanese officials know that they won’t be able to make their verbal intervention treats hard as they fight an uphill battle against genuine USD strength. Prepare for highest USD/JPY levels since 1986. Today’s eco calendar is extremely thin with US markets closed (Juneteenth holiday). ECB chief economist Lane is scheduled to speak, but already did so yesterday. He indicated amongst other that the upper range of neutral has crept up to 2.5%, suggesting space for another ECB rate hike this Summer.
News & Views
Japanese inflation was close to expectations, holding near the April levels. Inflation ex fresh food rose 0.5% M/M and was unchanged at 1.4% M/M with government measures to temper the cost of energy prices/living still in play. The core measure ex-food and energy printed at 0.2% M/M and 1.8% Y/Y from 1.9% in April. Gasoline prices were 7% lower Y/Y. Education (-6.1% Y/Y) and utilities price (-1.1%) served as a drag on yearly inflation as well. Food prices increased by 0.2% M/M and 3.5% Y/Y. Underlying trends still support the BoJ’s normalization process. BoJ Himino warned for the risk of price trends rising above the 2% target. The weak yen also continues contributing to upward inflationary tendencies. Japan Finance Minister Katayama again warned that Japanese authorities can take bold action against excessive speculative moves.
The Czech National Bank (CNB) raised its policy rate yesterday by 25 bps to 3.75%. Six members supported the rate hike decision. One member voted to leave the policy rate unchanged. The CNB analyses that even as inflation has been close to target of late, there is a risk that it might temporary increase slightly end 2026/early 2027. More importantly, core inflation remained elevated for six months without showing a downward tendency. Yesterday’s rate hike aims to tighten monetary conditions sufficiently to lower this trend. In a broader macro perspective, the CNB also indicates that accelerating credit growth and debt financing of increased public expenditure are fostering a rise in the quantity of money. At the same time, the labour market remains tight and wages are rising at a rapid pace. Prices are increasing above all in the service sector, whose price dynamics are a substantial component of core inflation. Yesterday’s decision aims to maintain a low-inflation environment. At the press conference, governor Michl indicated that the board leaves future rate options open. The koruna yesterday lost some ground after the decision/press conference with EUR/CZK closing near 24.21 (from an open near 24.16).
US Stock Futures Retreated Ahead of Juneteenth Holiday, US Dollar Remains Firm
Key takeaways
- The reopening of the Strait of Hormuz has accelerated the unwinding of the geopolitical risk premium. Crude oil has fallen sharply, with WTI posting a 10% weekly decline as Gulf oil exports resume and supply concerns ease, supporting global risk sentiment and reducing near-term inflation pressures.
- The US dollar remains the dominant beneficiary of the Fed’s hawkish pivot. Following Chair Kevin Warsh’s shift toward a data-dependent, higher-for-longer policy framework, the US Dollar Index broke above a major resistance level, while the euro, pound, gold, and other rate-sensitive assets remained under pressure.
- Global equities are entering a consolidation phase despite improved geopolitical conditions. Wall Street rallied strongly on optimism over a peace deal, but profit-taking emerged in US futures and parts of Asia as traders navigate reduced liquidity ahead of the Juneteenth holiday and reassess the implications of restrictive monetary policy.
- Chart of the day: WTI crude has established a near-term floor at the 200-day moving average. Watch the $75.25/73.40/bbl key near-term support for a potential short-term rebound.
Chart of the day - WFT crude’s 10% plunge stabilised at 200-day moving average
Fig. 1: West Texas Oil CFD minor trend as of 19 Jun 2026 (Source: TradingView). The information presented is historical information, and past performance is not indicative of future performance.
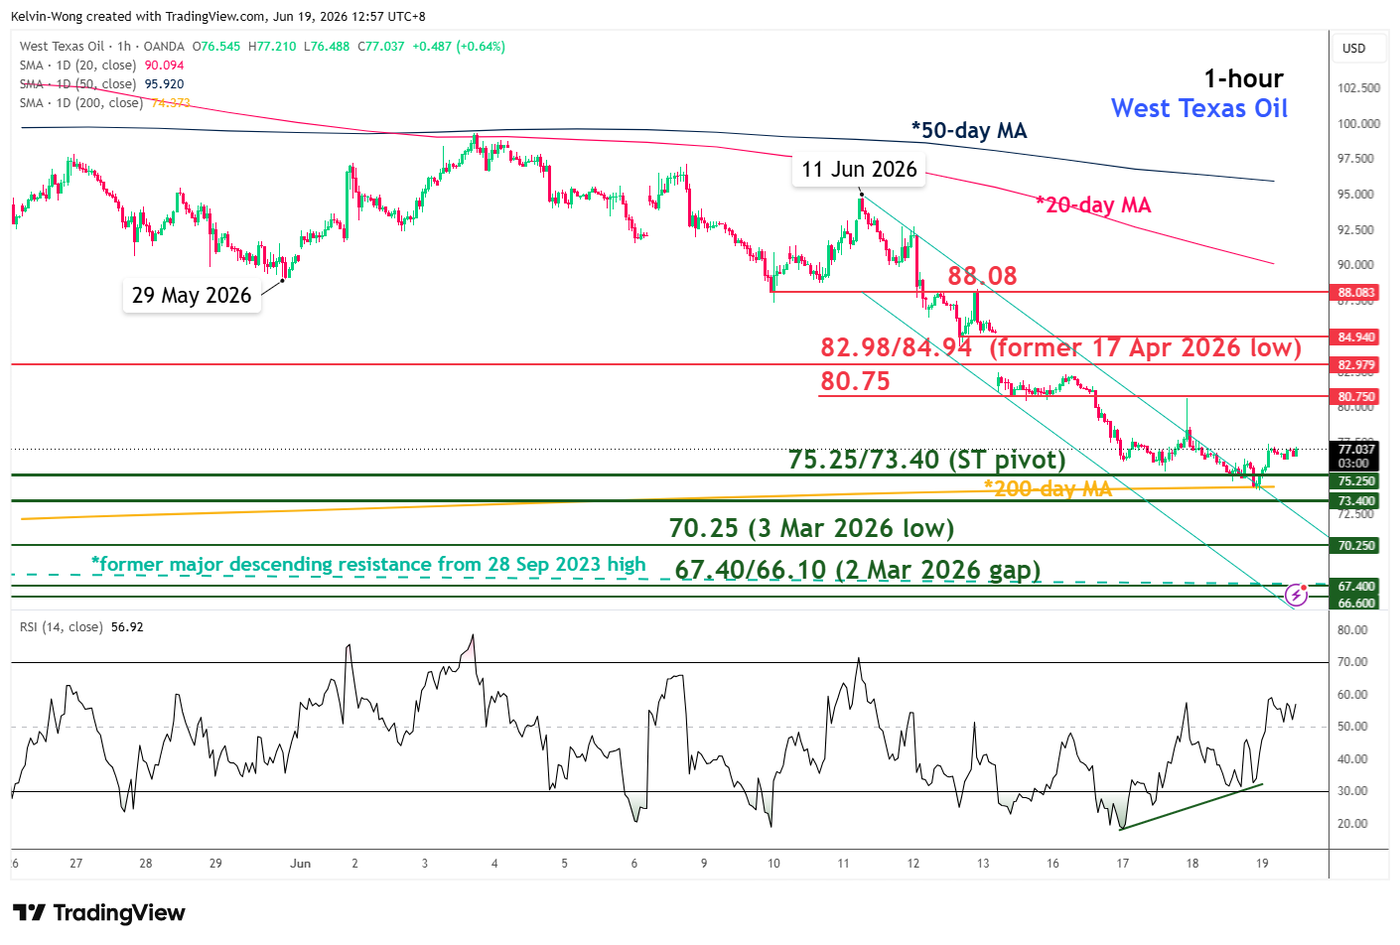
The 10% plunge in the price action of the West Texas Oil CFD (a proxy for WTI crude oil futures) since the start of this week has reached an inflexion point for a potential near-term rebound.
The decline has begun to stall at the key 200-day moving average, which price has traded above since early February 2026, before the start of the US-Iran war. In addition, the hourly RS momentum has flashed a bullish divergence in its oversold region, suggesting that bearish momentum is starting to wane (see Fig. 1).
Watch the 75.25/73.40 key short-term pivotal support for a potential short-term rebound scenario to unfold towards the next intermediate resistances at 80.75 and 82.98/84.94 (gap down area of Monday, 15 June 2026).
On the other hand, a break and an hourly close below 73.40 would invalidate the short-term bullish scenario, extending the bearish impulsive down-move sequence to expose the next support levels at 70.25 and 67.40/66.10.
Top macro headlines
- Strait of Hormuz reopens as U.S.-Iran peace deal takes effect: The historic U.S.-Iran peace agreement officially went into effect over the past 24 hours, bringing a definitive end to the highly disruptive maritime blockade. Shipping tracking data confirmed that tankers holding nearly 10 million barrels of crude are actively moving through the critical chokepoint, including the first Saudi-owned vessels since the conflict began. In tandem, Kuwait announced plans to swiftly ramp up crude production back toward 2 million barrels per day within the week, severely deflating the geopolitical risk premium.
- Wall Street stages massive 2.5% relief rally ahead of Juneteenth holiday: U.S. stock benchmarks surged on Thursday as geopolitical de-escalation sparked aggressive risk-on buying. The Nasdaq 100 led the charge, soaring 2.5% on secular tech tailwinds and mega-cap momentum. The S&P 500 advanced 1.1% to cap off trading before Friday’s full market closure in observance of the Juneteenth national holiday. In contrast, SpaceX tumbled for the second consecutive session, losing 3.6%, and ended Thursday at $185.00, still above last Friday’s debut closing price of $160.95.
- Crude oil suffers severe liquidation, crashing 10% for the week: Energy markets experienced a massive unwinding of long positions as supply anxieties evaporated. West Texas Intermediate (WTI) crude plunged below $75 before stabilising at $76.83/bbl, marking its lowest level since the earliest days of the Middle East conflict. Brent crude similarly succumbed to selling pressure, settling firmly under the key $80 threshold at $79.25/bbl as global supply channels normalised.
- Longer-term U.S. Treasury yields remained below last week’s highs: The benchmark 10-year US Treasury yield dropped by 3 basis points to settle at 4.45%. However, the short end of the curve remains highly inverted and elevated following the surprise “hawkish vibes” from newly appointed Fed Chair Kevin Warsh and the updated dot plot, keeping fixed-income participants structurally on edge. The 2-year US Treasury yield remained steady at 4.18% as it retested its 4-week range top.
- Gold dropped lower to $4,209 on the backdrop of a hawkish Fed: Spot gold prices fell 1.1% to settle near $4,209 an ounce. The precious metal faced a dual headwind from an appreciating U.S. dollar, buoyed by the Fed’s higher-for-longer baseline, and a sharp reduction in safe-haven demand as shipping corridors across the Middle East successfully reopened.
Key macro themes
- The reopening of the Strait of Hormuz and unwinding of the war premium: The formal implementation of the U.S.-Iran accord has triggered a rapid recalibration of global commodity supply curves. Front-month energy contracts had spent months pricing in a worst-case structural blockade scenario. With tracking data showing immediate, real-time flows of millions of barrels of crude out of the Gulf, the speculative war premium has completely dissolved. This influx of near-term physical supply shifts the energy narrative from structural deficits back to a projected supply expansion heading into the latter half of the year.
- Post-Fed yield Curve flattening under the “Warsh Era”: While the broader market celebrated geopolitical breakthroughs, fixed-income horizons continue to digest the monumental communication shift introduced by Fed Chair Kevin Warsh. By eradicating forward guidance and elevating the 2026 core PCE forecast to 3.3%, the Fed has locked in a highly restrictive near-term floor. Thursday’s bond activity reflected a pronounced flattening of the yield curve; long-end yields dipped on peace headlines, but short-term instruments (2-year US Treasury yield) remain rigidly anchored to the reality that rate cuts have been eradicated.
- Holiday liquidity drain and shifting global sessions: With U.S. cash equity and Treasury markets entirely closed today, Friday, June 19, for the Juneteenth holiday, global liquidity is experiencing an abrupt structural drop. Settlement cycles are paused, leaving international sessions in Europe and Asia to digest the massive macro shifts of the past 24 hours without the buffer of Wall Street’s active order book.
Global markets impact (last 24 hours)
Equities: The Nasdaq 100 rallied 2.5% to lead the session, driven by outperformance among mega-cap tech stocks. The S&P 500 gained 1.1% to close out the pre-holiday week on a positive note. Small caps followed the risk-on move, with the Russell 2000 closing up 2.1%, reversing a multi-session downward trend.
However, in today’s Asia opening session, the E-mini futures on the S&P 500 and Nasdaq 100 declined by 0.5% and 0.7% as US Vice President JP Vance delays trip for Iran talks as the 60-day countdown starts to reach a nuclear agreement and a permanent US-Iran peace deal.
Fixed Income: Sovereign bonds stabilised as long-term inflation risk premiums eased with lower oil prices. The 10-year U.S. Treasury yield fell 3 basis points to 4.45% but remains above its 50-day moving average at around 4.40%. Conversely, short-term yields hovered near multi-decade highs, locking the curve in a deep inversion following the FOMC’s hawkish dot plot shift.
FX: The U.S. Dollar Index remained firmly supported near recent highs, underpinned by the Fed’s upgraded economic projections, and broke above the 100.55 major range resistance level, which had been in place since May 2025.
The euro and the British pound extended their losses by 0.4% and 0.7%, respectively, for the second consecutive session on Thursday, trading at 3-month lows of 1.1458 and 1.3205 against the greenback.
Commodities: WTI crude plummeted below $74 before recovering slightly to settle near $75.50/bbl, holding right at the key 200-day moving average after a steep 10% decline on the week. Brent crude followed suit, closing under $80.00 at US$79.25/bbl on Thursday. Spot gold slid 1.4 % to close at $4,209 and extended its losses by 1.4% in today’s Asian session to hover close to the 11 June 2026 low of $4,024/oz.
Asia Pacific impact
- Profit-taking activities in South Korean stocks after Thursday’s rally towards record highs on semi-tailwinds: KOSPI dropped by 1.2 on Friday, in line with intraday weakness seen in Nasdaq 100 E-mini futures, but the South Korean benchmark index is still up 10% for the week.
- Yen remains wrapped in extreme intervention territory: The Japanese yen weakened towards the 161 handle, hitting an almost 2-year low of 161.81 on Thursday, just a whisker away from 161.95 per US dollar, which was printed on 10 July 2024 and triggered intervention by Japanese authorities. Wide interest-rate differentials, driven by Fed Chair Warsh’s hawkish policy stance, ensure that the Bank of Japan and the Ministry of Finance remain on high alert for immediate spot-market smoothing.
- Australian markets dragged down by BHP operational pressures: Defying the broader regional rally, Australia’s ASX 200 opened in negative territory on Friday (-1.1%). The index was dragged down by a sharp 4% drop in BHP shares following unexpected operational constraints at one of its major Canadian production facilities, offsetting regional macro optimism.
Top 3 events to watch today
- Germany PPI (May) - 2:00 PM SGT (consensus: 2.5% y/y, Apr: 1.7% y/y) Impact: EUR/USD, EUR crosses, DAX
- UK Retail Sales (May) - 2.00 PM SGT (consensus: 1.9% y/y, Apr: 0% y/y) Impact: GBP/USD, GBP crosses, FTSE 100
- ECB Chief Economist Philip Lane's Speech - 3.10 pm SGT Impact: EUR/USD, EUR crosses
EURUSD Wave Analysis
EURUSD: ⬇️ Sell
– EURUSD broke support zone
– Likely to fall to support level 1.1400
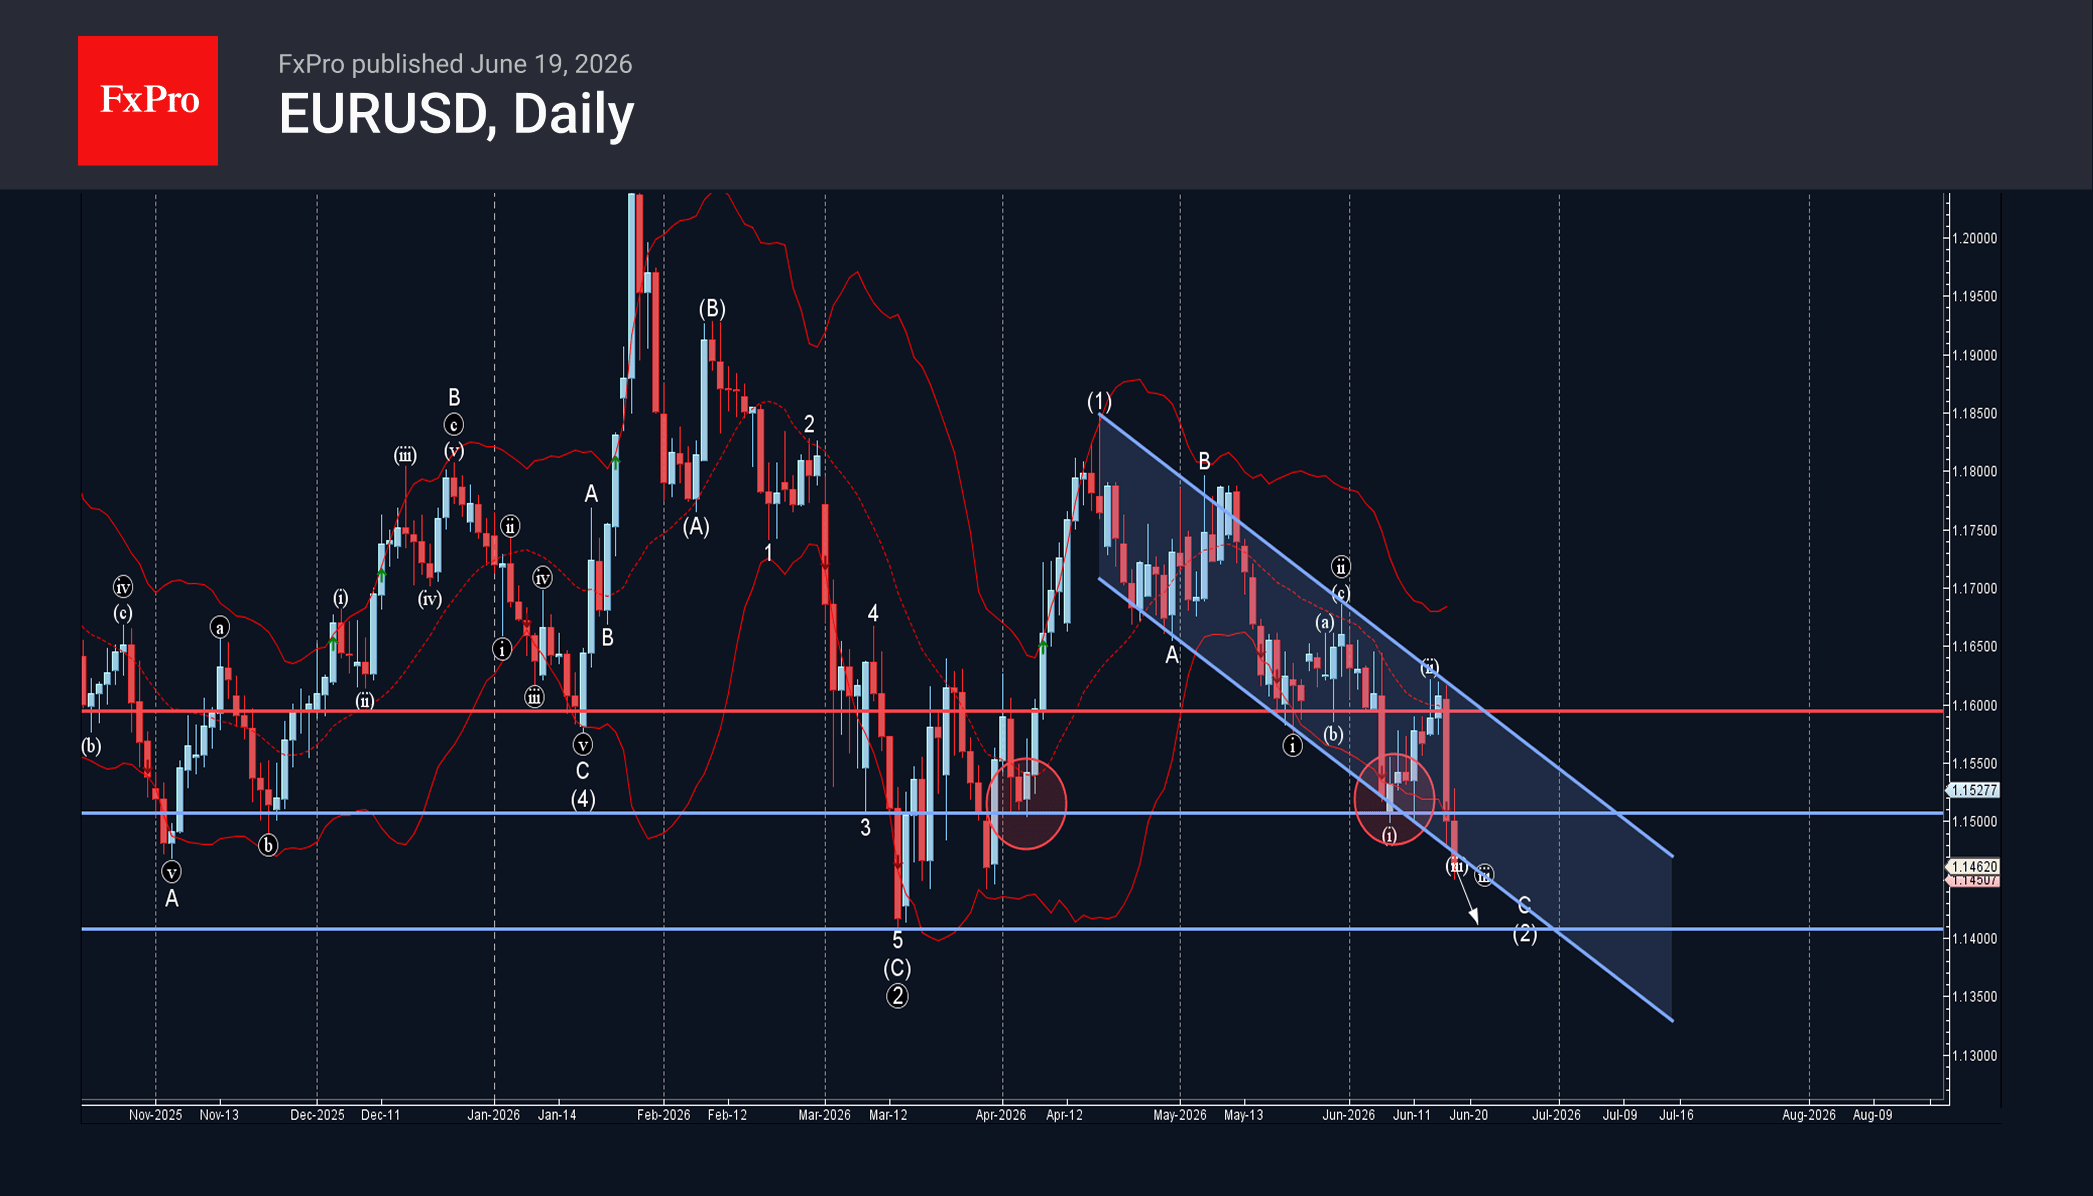
EURUSD currency pair recently broke the support zone between the strong support level 1.1500 (which has been reversing the price from April) and the support trendline of the daily down channel from April.
The breakout of this support zone accelerated the active short-term impulse wave C of the intermediate ABC correction (2) from April.
Given the strongly bullish US dollar sentiment seen today, EURUSD currency pair can be expected to fall to the next support level 1.1400 (former low of wave C from March).
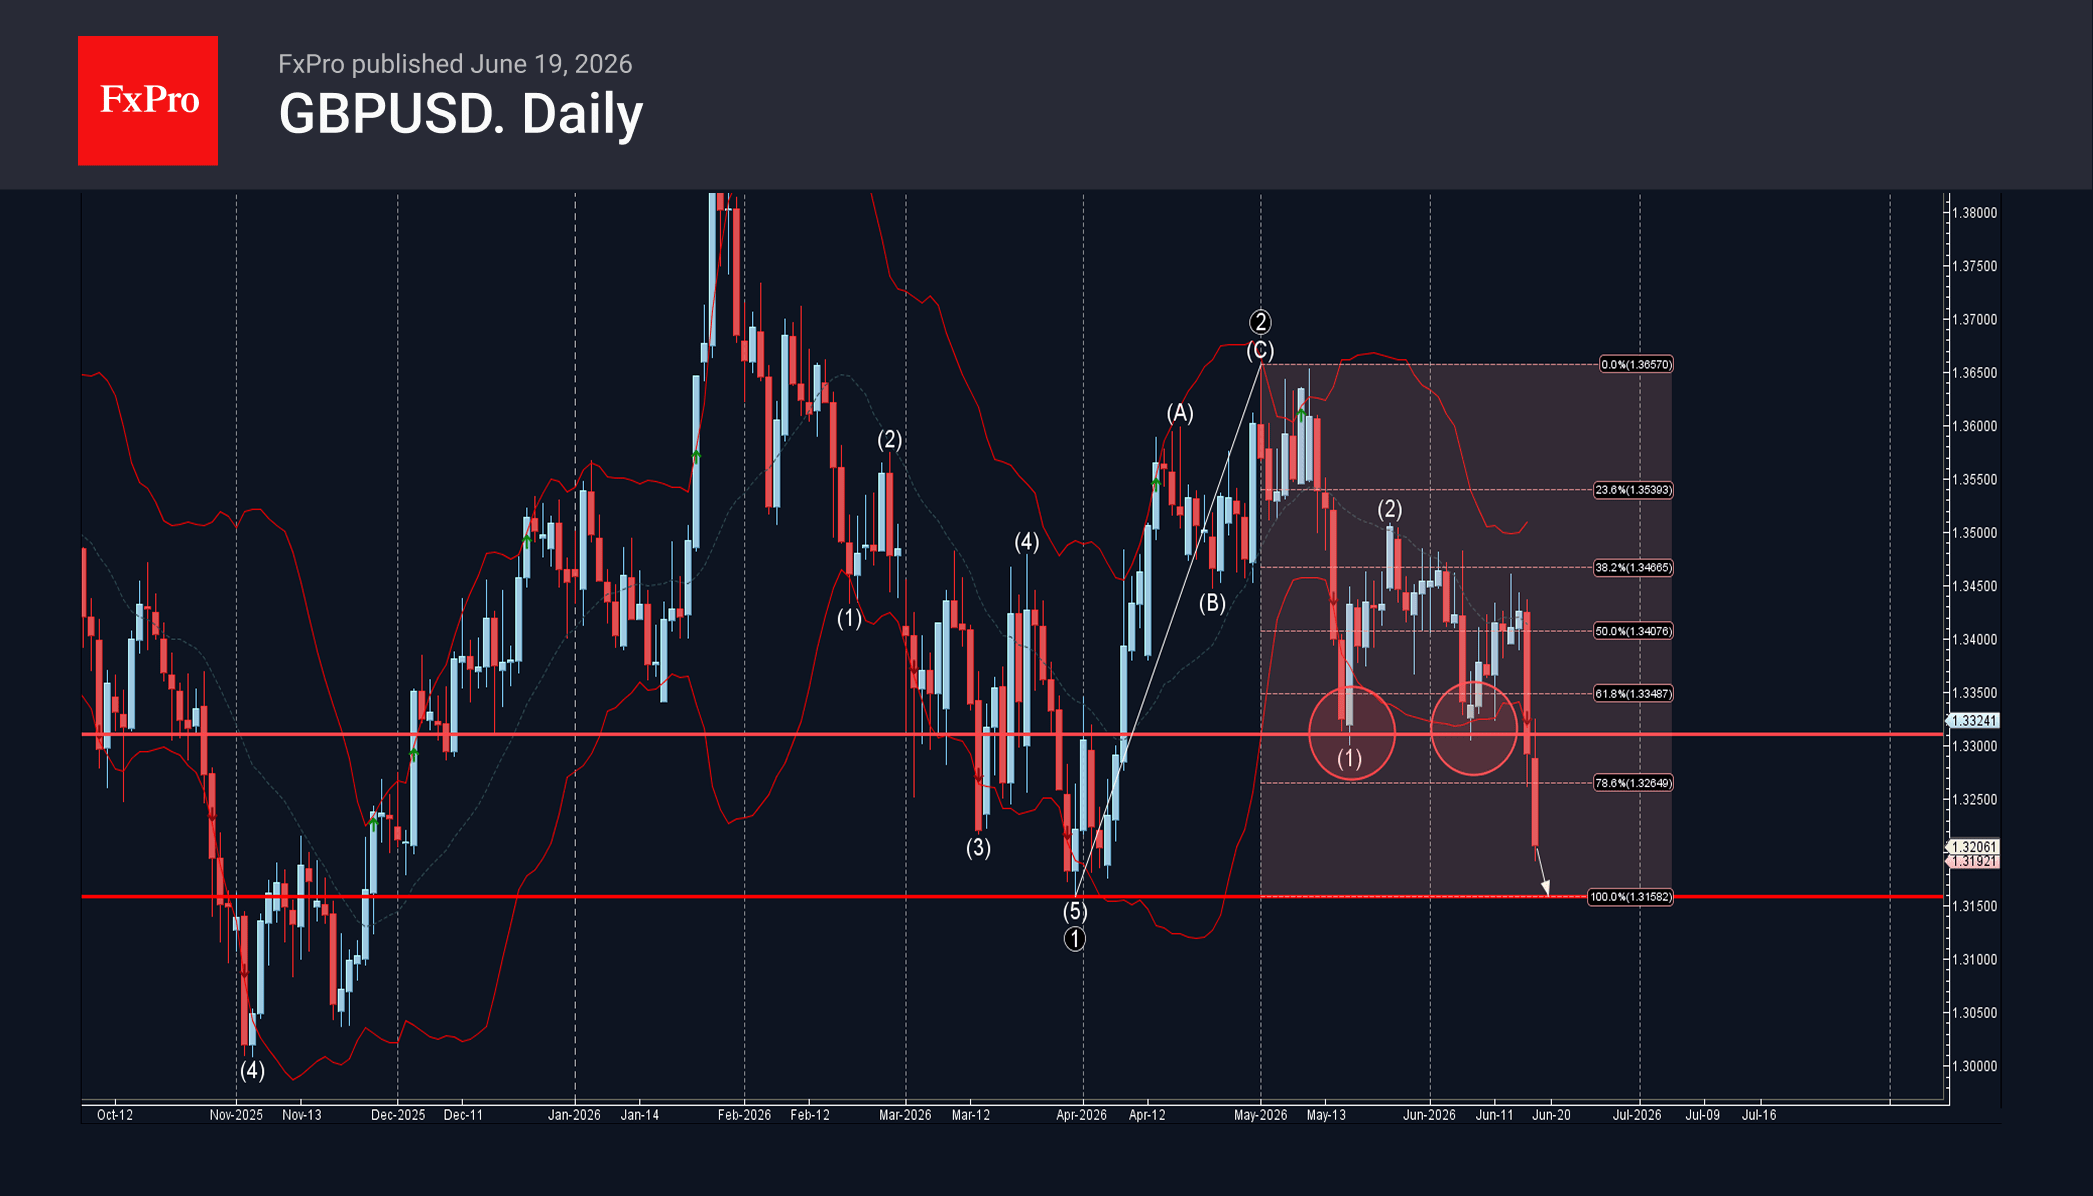
GBPUSD Wave Analysis
GBPUSD: ⬇️ Sell
– GBPUSD broke support zone
– Likely to fall to support level 1.3160
GBPUSD currency pair recently broke the support zone between the support level 1.3300 (which stopped the previous impulse wave (3)) and the 61.8% Fibonacci correction of the primary ABC correction 2 from the end of March.
The breakout of this support zone accelerated the active intermediate impulse wave (3) from March.
GBPUSD currency pair can be expected to fall further to the next support level 1.3160 (which started the aforementioned primary ABC correction 2).