Sample Category Title
Gold – Bears Regain Control After Short-Lived Correction and Look for Renewed Attack at Key Supports
Gold remains in red for the third straight day, on track for the third consecutive weekly loss, under renewed pressure from Fed’s hawkish steer.
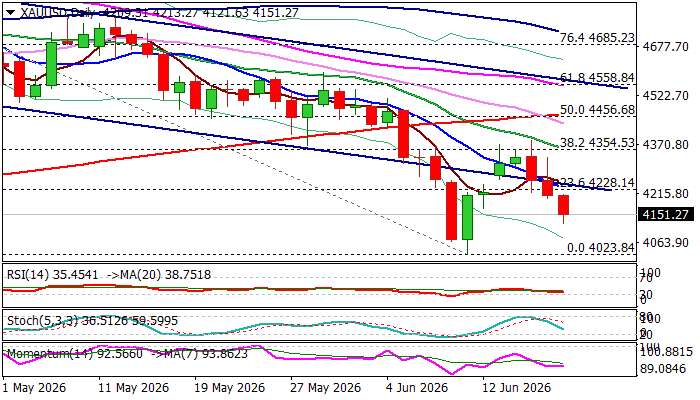
Recovery leg from $4000 support zone (metal hit new 2026 low at $4023 on June 11), repeatedly failed to register close above important Fibo resistance at $4354 (38.2% of $4889/$4023 descend) that resulted in formation of bull-trap.
Post-Fed acceleration lower confirmed an end of corrective phase and shifted near-term focus lower (fresh weakness has so far retraced over 61.8% of $4023/$4382 recovery leg), as the price is about to register second weekly close below the support line of bear-channel (following a short-lived return into channel).
Fully bearish daily techs (reinforced by the latest formation of 30/200DMA bear-cross) add to expectations for renewed probe through cracked Fibo support at $4077 (38.2% of $1616/$5598 uptrend) and attack at rising weekly cloud top ($4058) which guard psychological $4000 support.
Hawkish Fed rate outlook is likely to continue to keep metal’s price under pressure, though, significant supports within $4100 and $4000 need to be cleared to generate bearish continuation signal.
Res: 4213; 4251; 4354; 4382
Sup: 4077; 4058; 4023; 4000
Canada’s Headline Inflation to Edge Higher as Core Remains Near Target
Canada’s Consumer Price Index report for May on Monday will provide an updated reading on inflation trends following the Bank of Canada’s decision to leave interest rates unchanged earlier this month.
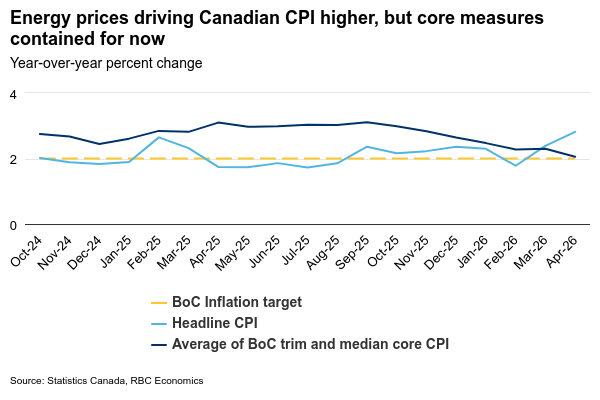
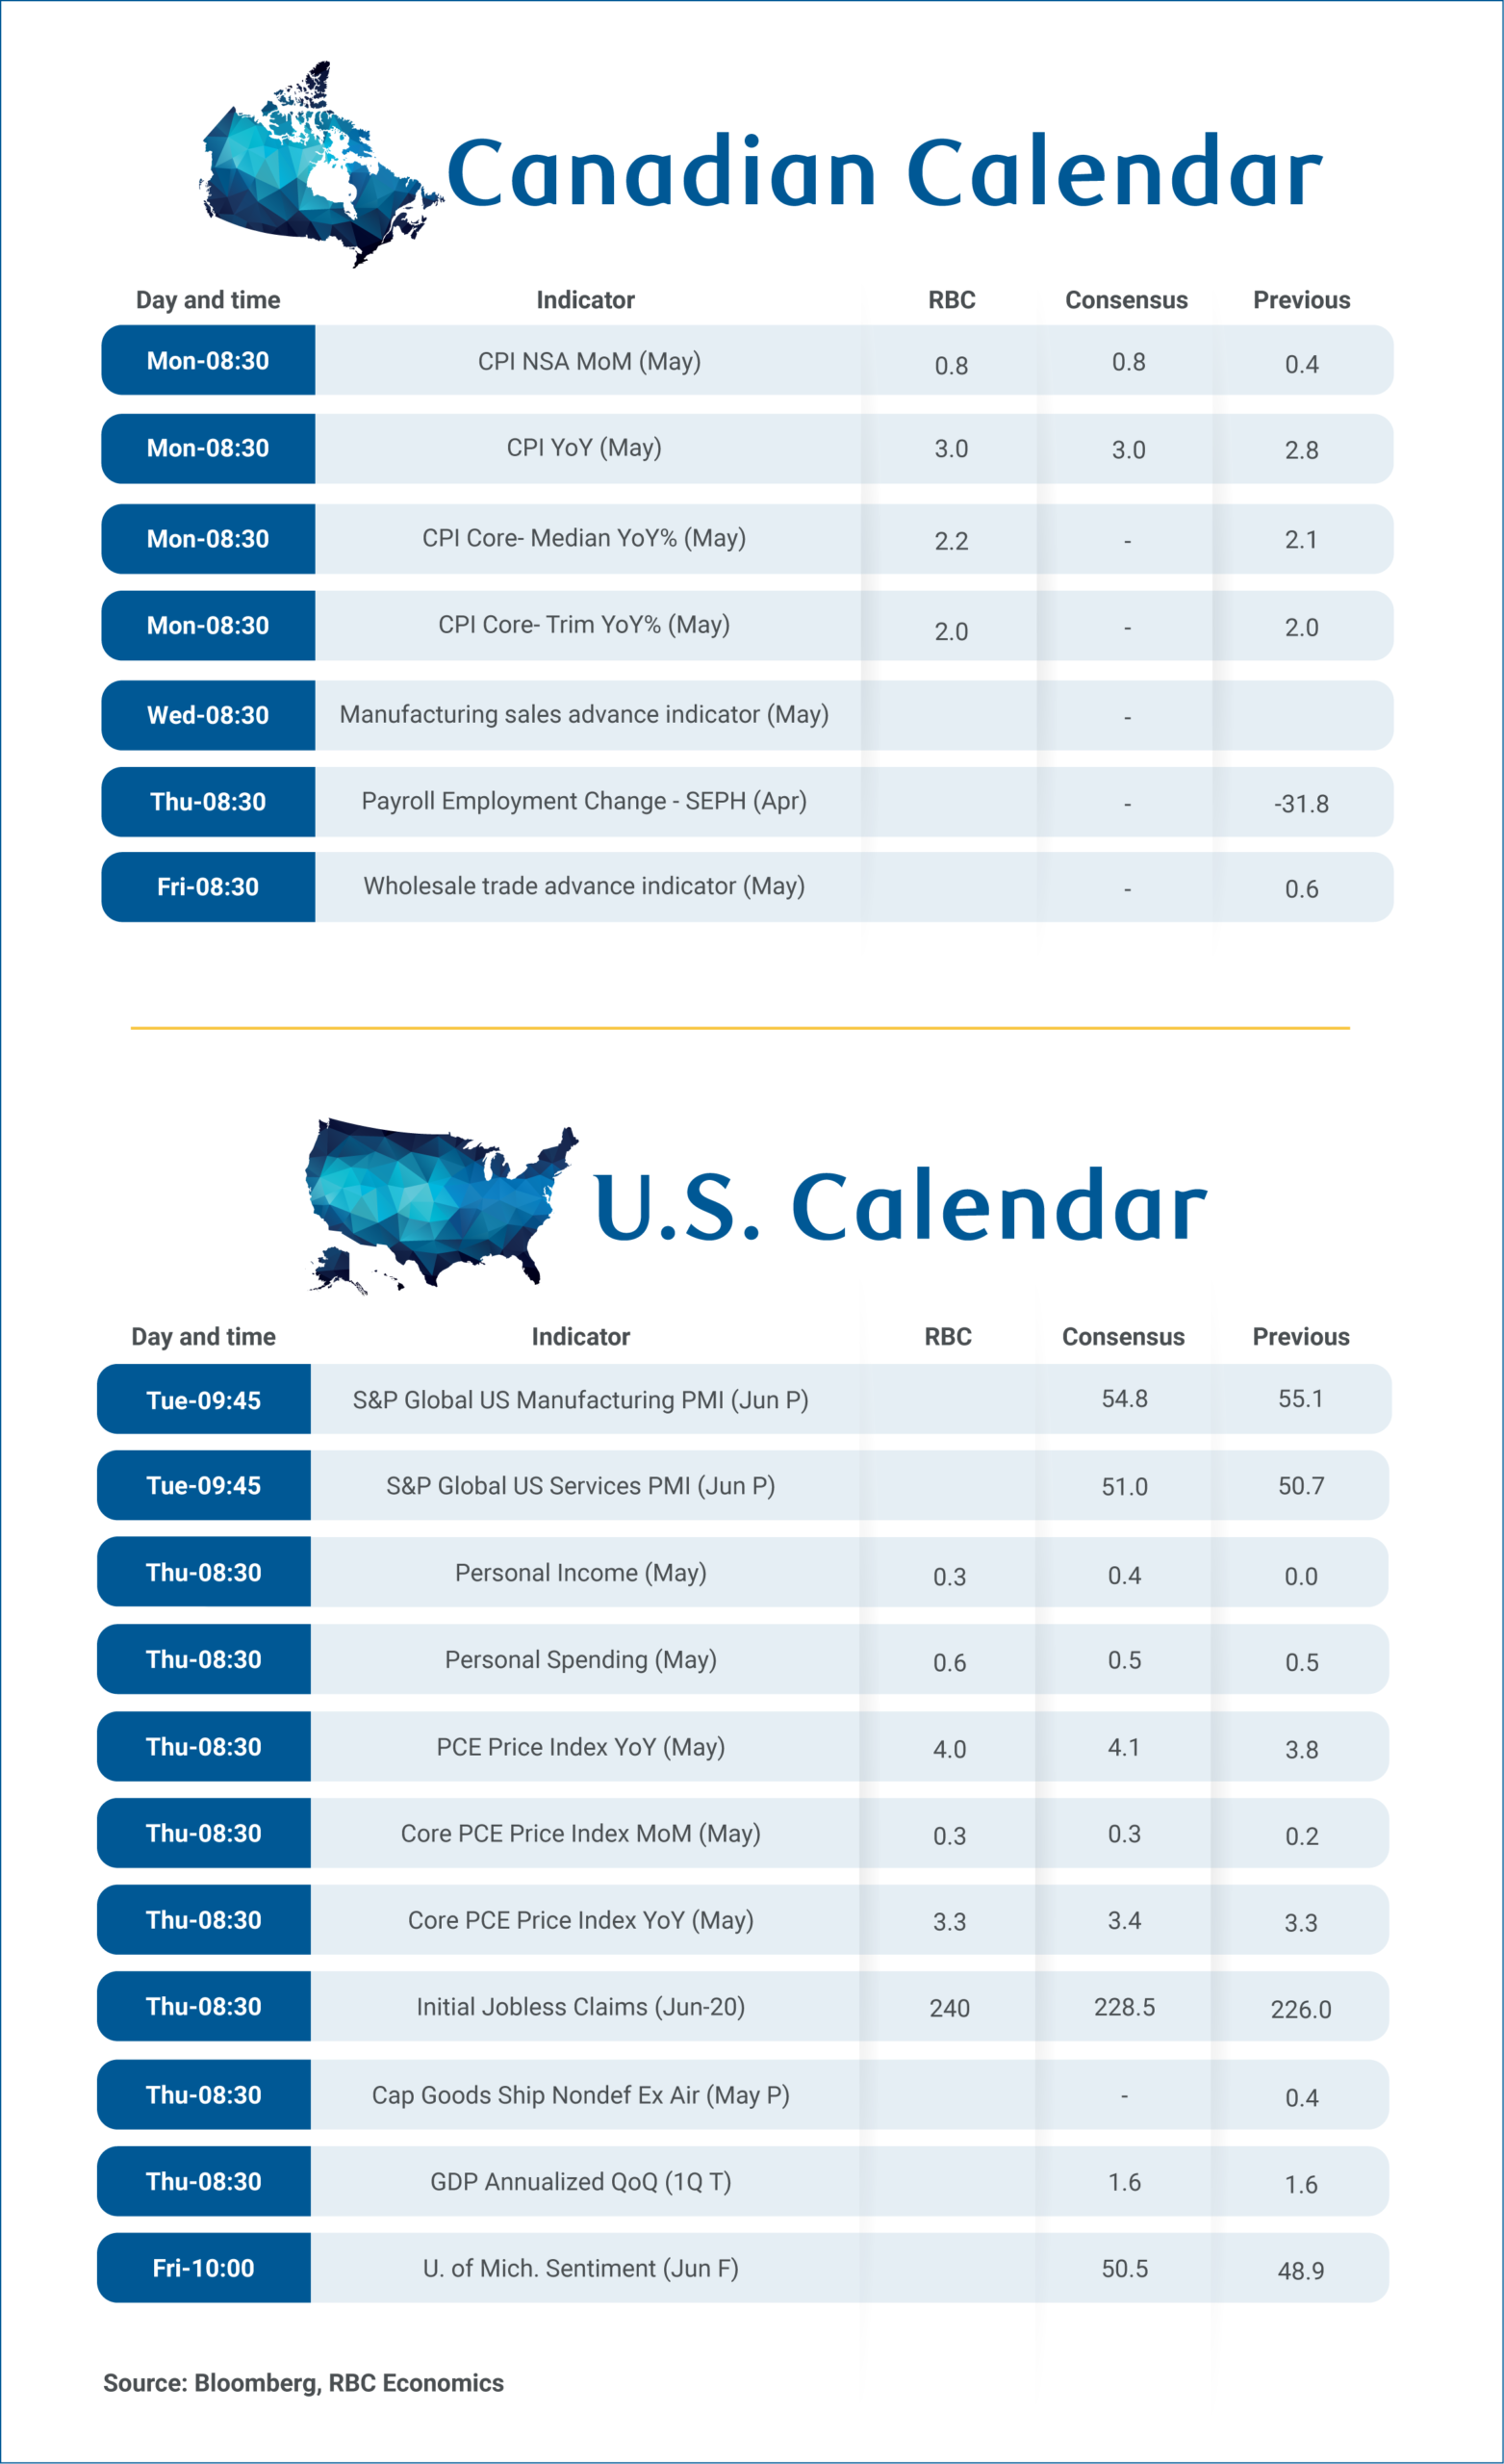
We expect headline inflation to rise to 3% year-over-year in May, up from 2.8% in April. Energy prices are expected to remain the largest contributor to price growth with the annual gain likely edging higher after jumping to 19% in April. But, food price inflation likely also increased. We look for a tick up to 3.8% after slowing to 3.5% in April from 4% in March.
Energy prices have continued to drive headline inflation higher, but there’s nothing the BoC can do about global oil prices.
The central bank would be far more concerned about a broadening of price pressures beyond directly impacted energy prices. But, recent reports have generally shown strength in headline CPI has been concentrated in a limited number of categories with underlying measures staying closer to the BoC’s 2% inflation target.
We look for core inflation measures to remain largely contained in May despite the increase in headline inflation. CPI growth excluding food and energy likely held at 1.5% y/y, while the BoC’s preferred median and trim CPI measures stayed close to the 2% target.
The May report will also incorporate updated CPI basket weights based on 2025 consumer spending patterns. The largest changes include higher weights for transportation, health and personal care expenditures, partially offset by a lower weight for shelter. While the revised basket may result in modest changes to the contribution of specific components, we expect little impact on total inflation measurements.
Canada’s April Survey of Employment, Payrolls and Hours (SEPH) will be watched closely after a larger-than-expected bounce back in jobs in the timelier Labour Force Survey (LFS) in May. Job vacancies in the SEPH (not available in LFS) will be key, and have been edging higher in a sign that labour demand is stabilizing. We expect SEPH wage growth will continue to underperform surprisingly firm LFS readings in April. But, May data showed LFS wage growth slowed to 3% y/y, more consistent with an edging lower but still elevated unemployment rate.
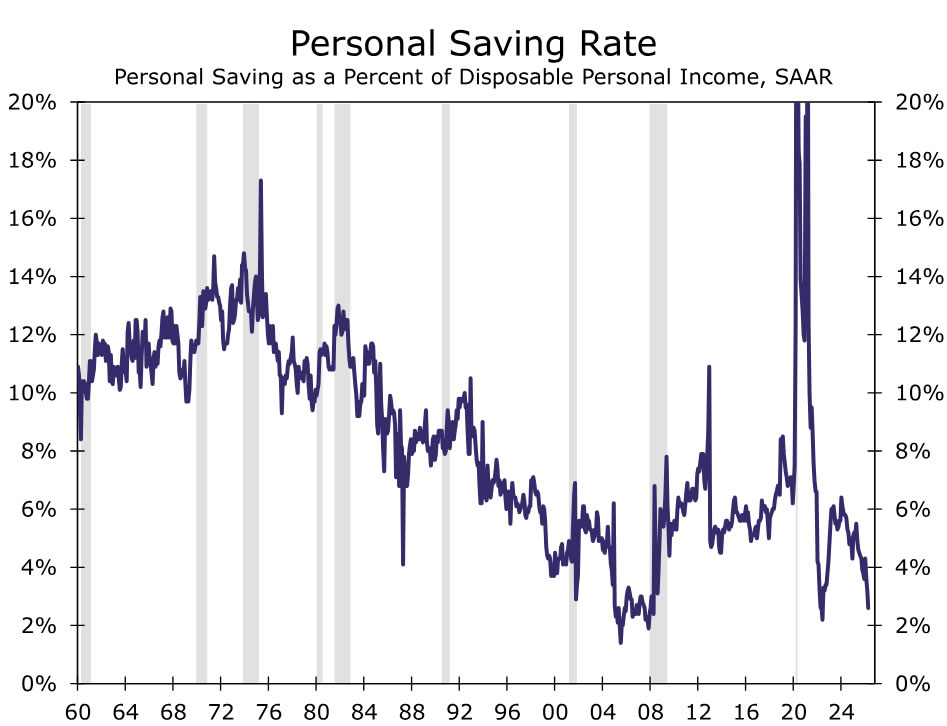
We expect U.S. personal income to rise 0.4% m/m in May, trailing the 0.6% m/m increase we anticipate for personal spending, indicating consumers are continuing to spend beyond their income growth. This spending is being funded by drawing down savings rather than higher incomes with the personal savings rate expected to potentially decline further from April’s 2.6%. The data should confirm that U.S. consumers are maintaining spending momentum at the expense of their savings buffer.
Weekly Focus – Reopening of Hormuz Amid Hawkish Fed
The main market mover this week was the signing of a memorandum of understanding to work towards a permanent peace deal between the US and Iran. The interim agreement ends all military actions and opens the Strait of Hormuz (SoH) while the two sides negotiate a final agreement in a "maximum" of 60 days. Traffic through the SoH show early signs of normalisation, but markets still watch how quickly supply returns and progress on the final deal, where especially the question of Iran's stockpile of nuclear material remains a sticking point. The spot price of Brent crude is down to around USD 80/bbl compared to USD 70/bbl before the war.
The US Federal Reserve remained on hold at 3.50-3.75%, as expected, with Warsh's first meeting delivering a much shorter statement without forward guidance but no surprises on the balance sheet policy. Warsh did not submit projections, but projections from the other members revealed a clear hawkish bias, with nine members pencilling in rate hikes this year and six of them seeing more than one, alongside higher inflation forecasts. The meeting marked a clear step away from traditional forward guidance, but Warsh emphasized a firm focus on bringing inflation back to target. Markets reacted hawkishly with significantly higher US Treasury yields and a weaker EUR/USD, now pricing in a more front-loaded probability of hikes.
The Bank of England (BoE) kept the Bank Rate unchanged at 3.75% as widely expected. The decision was taken with a 7-2 vote, with Pill and now also Greene voting for a hike to "insure against the possibility of larger second-round effects". We expect an unchanged Bank Rate for the coming year while markets are pricing in a full hike by year-end. In Japan, the Bank of Japan (BoJ) raised its policy rate by 25bp to 1.0%, the highest since 1995. The vote split was 7-1, and BoJ signalled further rate hikes and outlined a gradual reduction in JGB purchases, effectively pausing QT from 2027. Market reaction was modest, leaving USD/JPY just above 160.
In terms of data releases, the US retail sales figures rose more than expected, marking a fourth consecutive strong month as households stepped up car purchases despite higher petrol prices. In the euro area, the final May inflation data confirmed the surprisingly strong services inflation print of 3.6% y/y and the details revealed that it was indeed a strong print, not only driven by one-offs or seasonality that could be expected to reverse in June. China's latest monthly releases underscored a deepening two‑speed economy. Retail sales fell from 0.2% y/y in April to -0.6% y/y in May, while property investment slumped further and new home prices continued to decline, albeit sales appear to be stabilising. In contrast, industrial production accelerated to 4.5% y/y from 4.1% y/y fuelled by strong exports.
Next week, the key data releases to look out for are the June flash PMIs for the big economies. We also get the US PCE inflation for May and euro area consumer confidence as well as ECB's consumer expectations survey.
FX Forecast Update – USD Strength to Extend Aided by the Fed Re-pricing
Recent developments: more hawkish Fed and lower energy prices
- Since our last FX Forecast Update on 21 May, a resilient US labour market and signs of persistent underlying inflation have kept US monetary policy repricing at centre stage. At Kevin Warsh's first meeting as Fed Chair, rates were left unchanged, though the accompanying dot plot and communication revealed a shift toward a hiking bias, which in turn led to a repricing of USD rates. As expected, the ECB delivered a 25bp hike citing increased inflationary concerns, although economic data have surprised to the downside in the past months. The preliminary US-Iran agreement has pulled oil prices down to around USD80/bbl, though the otherwise muted market reaction extends the pattern of fading FX sensitivity to the Iran war. Against this backdrop, risk appetite has been mixed, caught between the headwinds of a hawkish Fed repricing and a resilient equity market, where a strong rebound in tech stocks has brought global indices back close to new highs.
FX implications: continued dollar strength and headwinds for Scandies
- Over the past month, the dollar has continued to strengthen against the backdrop of a Fed tightening bias, pushing EUR/USD down below the 1.15 mark. Overall FX market developments have remained relatively muted. The retreat in energy prices has turned into a headwind for energy-exporting economies, reversing the last months' tailwind, leaving NOK, CAD and AUD as the relative underperformers in G10. Noteworthy, the SEK has also had a bad month, despite the drop in energy prices, which reflects the general overperformance of Swedish fixed income. EUR/DKK has moved higher to new highs, returning focus to Danmark Nationalbank's reaction function on FX intervention. USD/JPY has been gravitating around the 160 level, with a strong USD supporting the cross despite the BoJ's 25bp hike to 1.00%.
Outlook: continue to be bearish on EUR/USD and bullish on EUR/Scandies
- Given the recent move lower in EUR/USD, we extend last month's forecast on the 1-6M horizon, expecting the cross at 1.13 in 6 months, while we keep our 12M expectations at 1.12. For EUR/SEK, we leave our forecast profile unchanged as the risk of heightened inflation continue to weigh, expecting the cross to trade around the 11.00 on the 6M and 11.20 on the 12M-horizon. For EUR/NOK we have outcome-adjusted our profile slightly upwards on the back of the recent NOK weakening, driven by a tightening of short-end rates spreads to EUR, and now target the cross at 11.80 in 12M.
Key risk to our forecasts: geopolitics and the US monetary policy outlook
- Near-term risks are closely tied to the war in Iran, while medium- to long-term risks continue to be tied to the US growth outlook and the US monetary policy outlook. A much firmer focus by the Warsh-led Fed on bringing down nominal pressures in the US economy, could result in a considerably stronger USD and weaker Scandies than what we pencil in. Additionally, should the US economy prove less resilient than what we forecast, fears of a US recession could weigh heavily on the USD, with CHF, JPY and EUR likely proving the biggest beneficiaries in such a scenario. For EUR, a more prolonged ECB hiking cycle, potentially driven by fiscal easing or a more resilient euro area economy, could also cap USD strength. Finally, we will closely monitor uncertainty related to AI and broader signs of a turning global cycle.
Economics Week Ahead
Consumer spending remains resilient, but underlying fundamentals continue to weaken. We expect nominal personal spending to rise at a solid pace in May, largely reflecting higher energy prices, with the PCE deflator accelerating and pushing year-over-year inflation back above 4%, leaving real consumption relatively subdued. At the same time, income dynamics remain soft, with real disposable income in negative territory and savings rates near historic lows, suggesting households are increasingly stretched even as Q2 consumption tracks a modest pace. In Canada, inflation is still being driven primarily by energy, and while we expect a firm headline CPI print, core measures should remain contained. In emerging markets, we expect Banxico to leave rates unchanged next week after policymakers indicated at the previous meeting that the easing cycle had likely concluded.
United States:
- Personal Income & Spending (Thursday)
G10 Economies:
- Canada CPI (Monday)
Emerging Markets:
- Banxico Policy Rate (Thursday)
U.S. Week Ahead
Personal Income & Spending Thursday
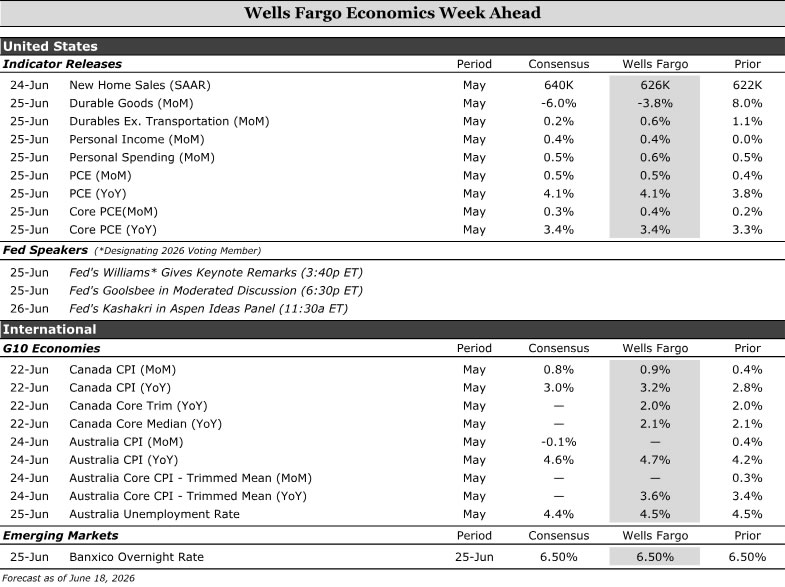
Consumer resilience is holding for now, but underlying fundamentals continue to erode. Incoming data—like control group retail sales and higher-frequency card data—point to a solid nominal consumption backdrop in May. We look for personal spending to rise at a 0.6% clip in May, though most of that gain will merely reflect higher prices stemming from gasoline rather than a broad pickup in sales volumes.
We expect the PCE deflator to increase 0.5% during the month as well, leading the year-ago rate to surpass 4%, with the acceleration still largely driven by energy-related costs. In other words, nominal spending is firm, but real consumption remains far less impressive.
Remember it's larger average tax refunds that have offset higher gasoline prices in recent months, but that tailwind is fading as refund flows slow. There may be a new near-term offset form World Cup-related spending—particularly at restaurants and related categories in broader PCE—in coming months, but that is unlikely to alter the broader trajectory amid weak consumer fundamentals.
The underlying income backdrop is weak. Real disposable income excluding transfer payments has slipped into negative territory on a year-ago basis, while saving rates are bumping up against historic lows, signaling consumers are increasingly spending more of their income to sustain spending. We expect broad nominal personal income advanced 0.4% in May, but was negative when accounting for inflation. Spending should hold up in Q2; it's on track to rise at a decent, yet unspectacular, ~2% annualized pace.
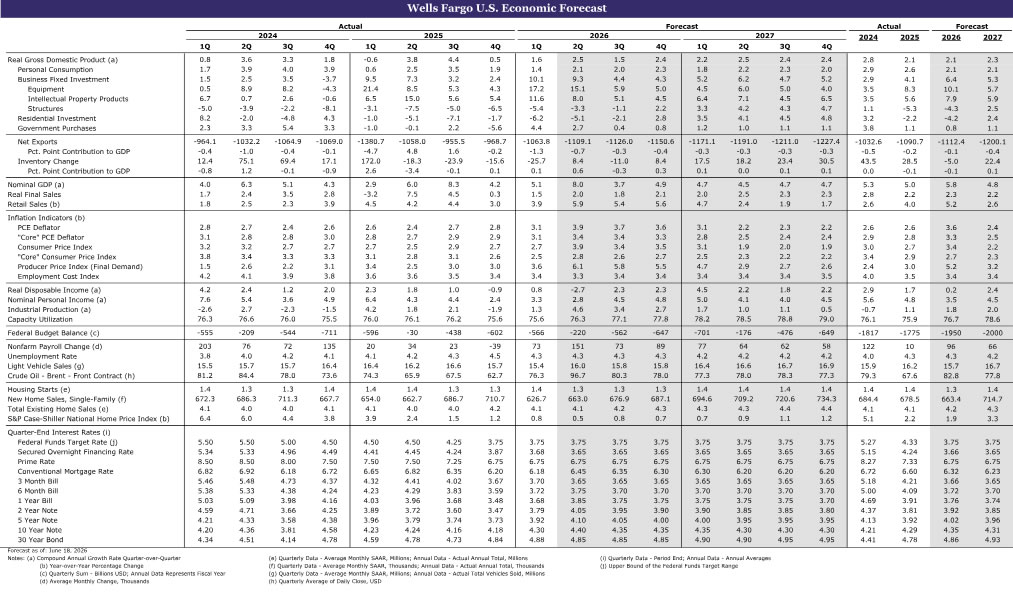
Updated Post-FOMC Meeting Forecast
G10 Week Ahead
Canada Consumer Price Index (CPI) Monday
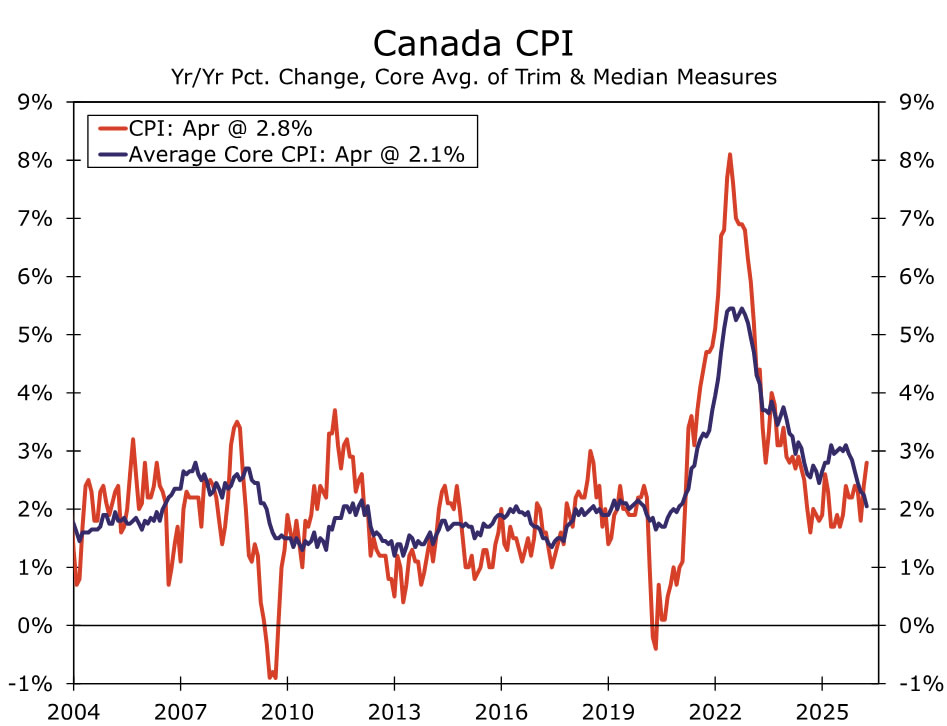
Consumer inflation remains energy-driven, with little evidence of broader price pressure building thus far. We look for headline CPI to rise 0.9% month-over-month in May, which would lift year-over-year inflation to 3.2%. But core measures are likely to hold near the previous month’s pace, with trimmed mean and weighted median inflation at 2.0% and 2.1%, respectively.
The composition matters. At its most recent monetary policy meeting, the Bank of Canada (BoC) signaled that it was willing to look through the current energy-driven inflation shock, absent clear evidence of broad-based pass-through to other consumer prices. This release is the last key inflation data ahead of the next mid-July BoC decision.
The broad outlook remains highly uncertain from the Middle East conflict to USMCA negotiations. From a monetary policy perspective, weaker activity and slowing wage growth could keep policymakers on hold for longer. While our baseline has been for two BoC rate hikes this year, if price pressures stay largely contained to energy and the U.S.–Iran interim peace deal holds, oil prices should gradually decline as supply improves. That would give the BoC greater scope to continue looking through the near-term energy shock and delay tightening, even in the face of a firm May print.
EM Week Ahead
Banxico Policy Rate Thursday
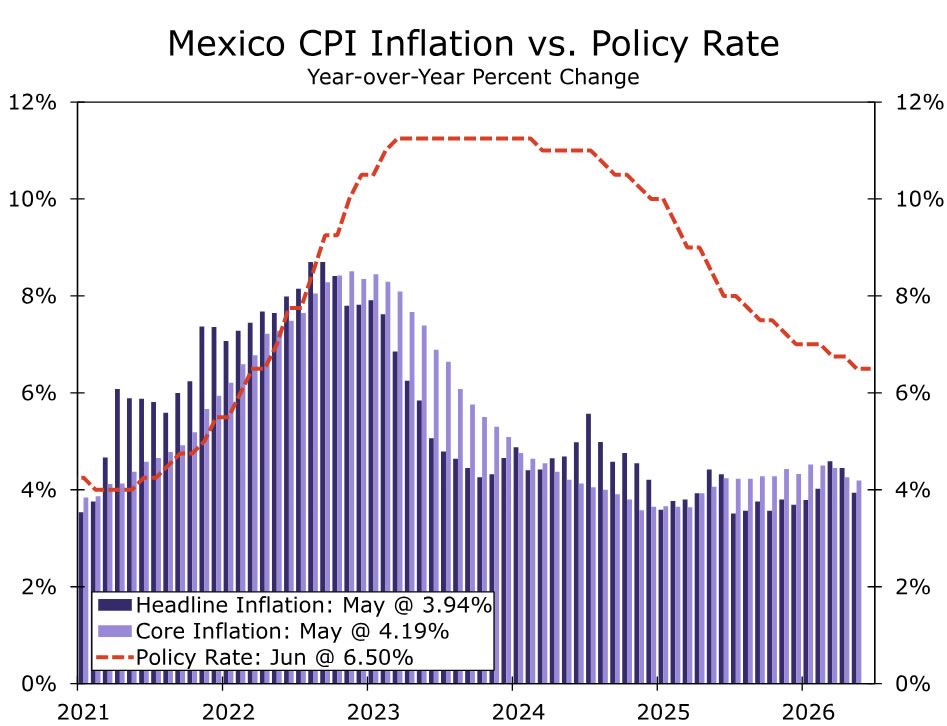
Next week, Mexico’s central bank, Banxico, will deliver its latest monetary policy decision, and we expect policymakers to keep the Overnight Rate unchanged at 6.50%.
At its previous meeting, Banxico cut rates by 25 bps and signaled that holding policy at current levels would likely be appropriate going forward, bringing the easing cycle that began in March 2024 to an end. Since then, the inflation backdrop has continued to improve. May headline inflation slowed to 3.9% year-over-year, while core inflation eased to 4.3%. Still, underlying inflation remains above target and price pressures have not fully disappeared. The growth backdrop also remains weak. Q1 GDP contracted 0.6% quarter-over-quarter, while year-over-year growth was barely positive at 0.2% (both modestly better than the initial estimates of -0.8% and 0.1%, respectively). Domestic demand remains soft, and restrictive financial conditions continue to weigh on activity. Recent business surveys also point to continued weakness in Q2, partly tied to uncertainty surrounding the Middle East conflict.
That said, some stabilization could emerge in the second half of the year if the current U.S.–Iran interim peace deal holds and external conditions improve. Additional support from World Cup-related activity could also help sentiment and demand. Against this backdrop, our view is that Banxico has likely reached a terminal rate of 6.50%, with risks favoring a prolonged pause rather than renewed cuts.
Week Ahead – Fed’s Hawkish Tilt and Iran Deal Turn Focus to PCE Inflation and PMIs
- US PCE inflation data eyed after Warsh’s surprise hawkish debut.
- June PMIs in the spotlight too as US-Iran deal eases energy crunch.
- CPI data for Australia, Canada and Tokyo also on tap.
Warsh Signals Change and Higher Rates
New Fed Chair Kevin Warsh didn’t waste any time in his first FOMC meeting in prioritizing the need for the central bank to bring inflation back within the Fed’s 2% objective, unsettling markets just as subsiding geopolitical risks had lifted the mood in the past week.
Far from living up to the belief that Trump’s appointee would have made the case for looser monetary policy, Warsh doubled down on the Fed’s price stability mandate. Moreover, the updated dot plot indicated a significant hawkish tilt compared to the March projections, with the board split on whether to keep rates on hold or to raise them by year-end.
Investors quickly responded by bringing forward their rate hike bets to October and pricing in a substantial probability for a second 25-bps increase in March 2027. The US yield curve flattened, with short-term yields jumping higher. But the 30-year yield plunged on expectations that tighter policy now will bring down inflation in the long run.
However, Wall Street didn’t appreciate Warsh’s unwavering commitment to the 2% target, although uncertainty about his reform agenda also weighed on stocks. Warsh has set up task forces to review the Fed’s communication, the size of the balance sheet, the methodologies for collecting data, and the inflation framework.
These changes are unlikely to take place before the end of the year, but markets are mostly upset about Warsh’s decision to ditch forward guidance, which had become a key policy tool in the post-financial crisis era.
Renewed Focus on Inflation
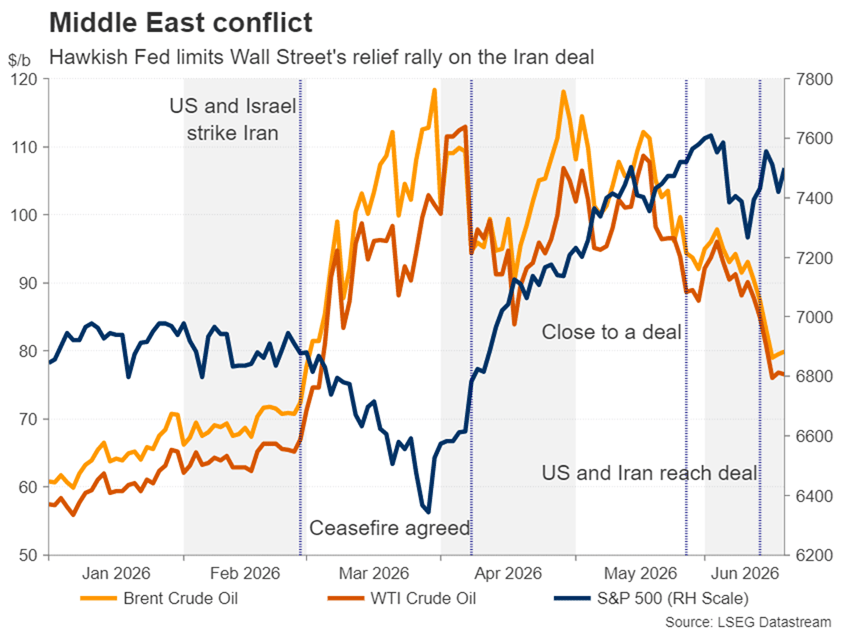
Investors have also been taken aback by the fact that this hawkish pivot has come even as the Middle East conflict appears to be nearing the end. With the US and Iran putting pen to paper to their framework deal that potentially paves the way for lasting peace if there is agreement on reigning in Tehran’s nuclear ambitions, traffic along the Strait of Hormuz is slowly returning to pre-war levels.
Subsequently, oil prices have crashed almost 11% in June, adding to May’s 17% slump. Central bank hawks would argue that the damage has already been done and it’s too early to dismiss the threat of second-round inflation effects. This is even more true for the Fed given that inflation in the US has been running above its 2% target for the past five years.
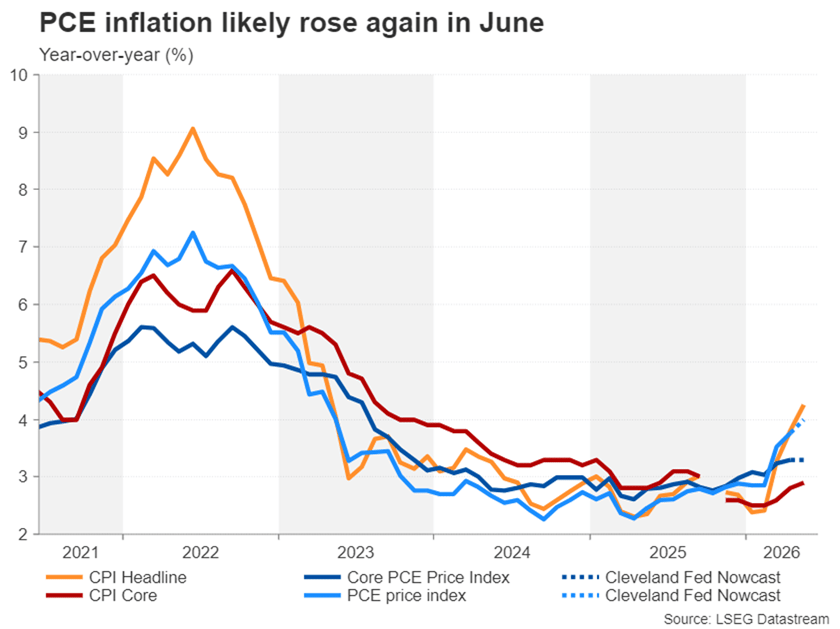
Markets were under the assumption that the Fed would be comfortable looking through the latest uptick in both CPI and PCE measures, but Warsh’s surprise determination to return inflation to 2% has shifted attention firmly back on the data.
The core PCE price index, which the Fed currently attaches the most weight to, is out on Thursday, along with the personal income and spending numbers for May. Core PCE is forecast to have stayed unchanged at 3.3% in May according to the Cleveland Fed’s inflation Nowcasting model, while headline PCE is projected to have edged up to 4.0% from 3.8%.
The final GDP readings for Q1 and durable goods orders for May are also due the same day, while ahead of Thursday’s data barrage, the S&P Global PMIs for June will be watched on Tuesday.
Aussie and Loonie Eye May CPI as Rate Hike Bets Fade
Inflation will also be on the agenda in Canada and Australia where the two countries are experiencing varying degrees of impact from the war in the Middle East. In Australia, there are some signs that the pickup in inflation is peaking, but the economy remains broadly solid. The RBA didn’t sound too concerned about the recent rise in the unemployment rate when it kept rates on hold last week and was more worried about inflation being so high, at 4.2% in April.
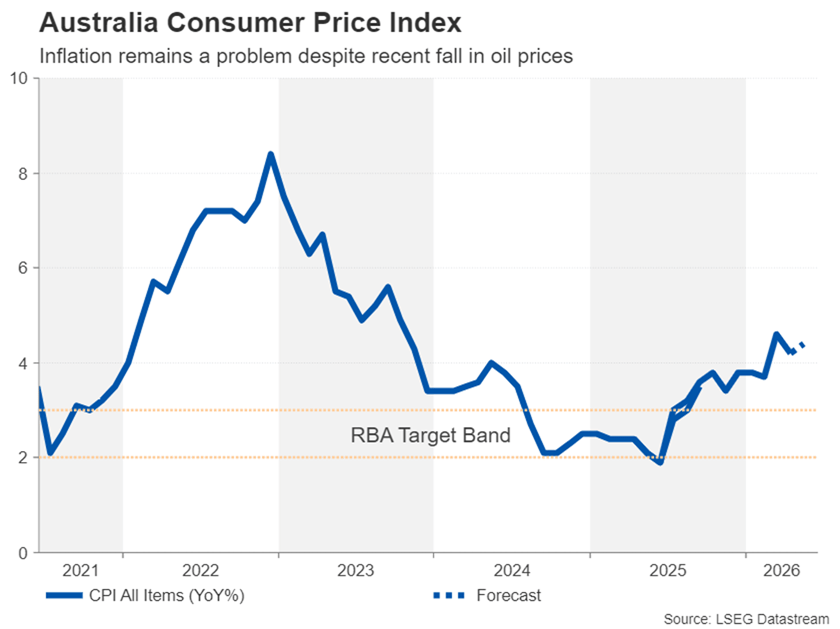
The May numbers are out on Wednesday, and the employment report will follow on Thursday. The risk is that inflation could head back up again after May’s encouraging decline, while the unemployment rate continues to climb. This would put the RBA in a real bind.
However, if oil supplies begin to flow again through the Strait of Hormuz and energy prices extend their drop, the RBA would probably ease up on inflation and prioritize its employment mandate. Investors have already scaled back their expectations of additional rate hikes by the RBA and are no longer fully pricing in a 25-bps increase.
Any further paring back of tightening bets next week could make it difficult for the Australian dollar to hold above $0.70.
In Canada, the US-Iran deal probably means that the Bank of Canada can avoid a rate hike altogether. A weak economy, sluggish jobs market and muted underlying inflation look set to keep the BoC on the sidelines during the energy price shock. Monday’s CPI numbers for May are unlikely to change the price outlook much, unless there’s a big overshoot from the forecasts. Hence, the Canadian dollar will continue to face pressure from a resurgent US dollar, which this week shot past C$1.41.
Euro and Pound on Backfoot Ahead of Flash PMIs
Eurozone manufacturing activity has maintained a steady recovery during the Iran conflict, but the services sector has been hit hard by the surge in energy prices. However, the services PMI likely recovered slightly in June when hopes of a deal began to rise and oil prices retreated further. If there’s no marked improvement in June, this would likely add pressure on the European Central Bank not to rush into hiking rates for a second time.
ECB policymakers have not shut the door to further hikes as there is still a huge degree of doubt about the full normalization of energy flows from the Gulf. Nevertheless, stronger-than-expected PMI readings could offer the euro some respite from the selling pressure as the dollar rallies on the back of the Fed’s hawkish shift.
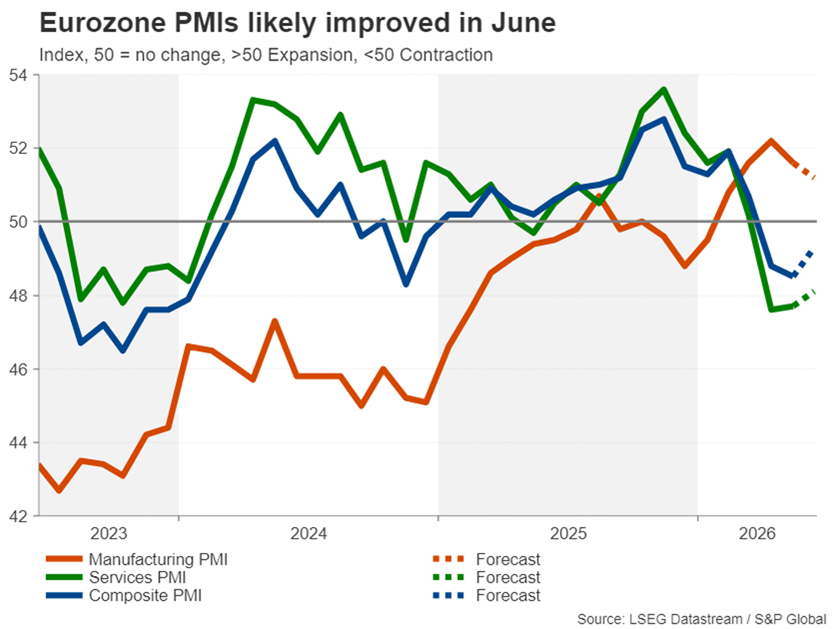
The UK’s services PMI has also taken a dive from the Mideast turmoil, while manufacturing has grown. Similarly, any rebound in June would signal that the worst of the economic impact of the war is over, potentially bolstering the pound. Though, with the Bank of England evidently reluctant to hike interest rates, any boost is likely to be limited.
Yen Flirts With Danger Again
The Bank of Japan lifted interest rates to a 31-year high this week, as the combination of the weak yen and higher fuel prices have raised the risk of second-round effects on inflation, while real wage growth has also accelerated.
Yet, despite policymakers’ increasing concerns about an inflationary buildup, the yen stabilized at best rather than attract any bullish traction. More to the point, the Fed’s unexpectedly hawkish hold on Wednesday has more than offset any temporary relief for the yen from Tuesday’s hike.
With the dollar once again flirting with the 161.00-yen level, the odds of intervention by Japanese authorities are very elevated. Friday’s preliminary CPI figures for the Tokyo region are unlikely to provide much of a boost to the yen, even if they show core CPI heading higher following six months of decline.
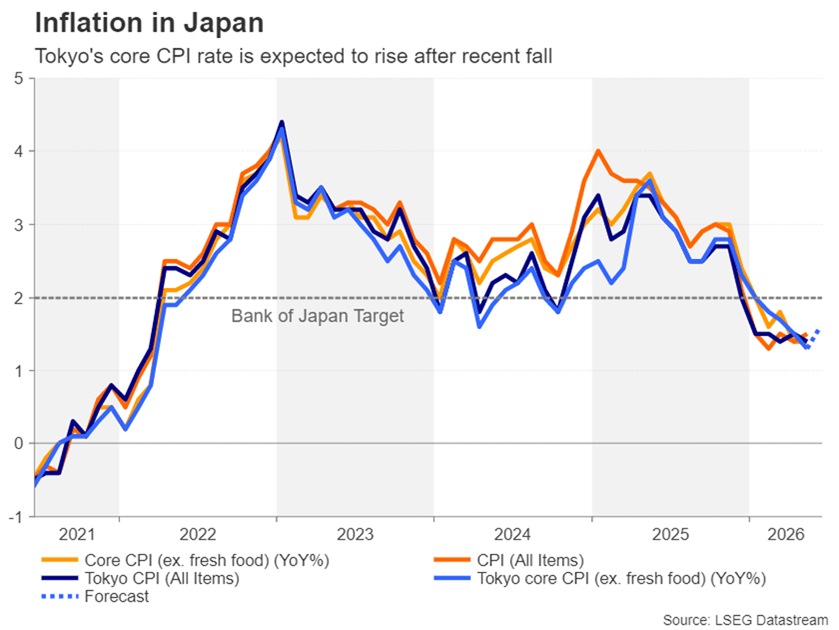
A better chance for the yen to halt its slide is if Wednesday’s Summary of Opinions of the BoJ’s June meeting reveals some previously undisclosed hawkish views, fuelling rate-hike expectations.
Dollar Dominates as Markets Ignore Japan Warnings and Look Past Iran Setback
Dollar strength remained the defining theme in currency markets on Friday, although gains slowed somewhat as US markets observed the Juneteenth holiday. Investors continued to digest the Federal Reserve's hawkish shift earlier this week, which revived expectations for another rate hike this year and left open the possibility of a second if inflation remains stubborn. With the market increasingly pricing a higher-for-longer Fed, the greenback has maintained broad support even as trading activity thinned.
The clearest expression of that theme was USD/JPY's surge above the 161 mark, extending its rally to fresh two-year highs. The move came despite renewed warnings from Japanese officials. Finance Minister Satsuki Katayama reportedly told G7 counterparts that Japan was "prepared to take decisive action on speculative moves" in foreign exchange markets. Bank of Japan Deputy Governor Ryozo Himino said the central bank was closely monitoring currency developments because of their implications for growth and inflation. So far, however, markets appear unconvinced that verbal intervention alone will be enough to counter a broad-based Dollar rally driven by widening rate differentials.
Elsewhere, Sterling staged a modest recovery following much stronger-than-expected UK retail sales data, which highlighted continued resilience in consumer spending. Nevertheless, the Pound remains among the week's weakest performers as investors continue to scale back expectations for aggressive Bank of England tightening. Strong retail activity may help stabilize sentiment in the near term, but it has done little to alter the broader view that the BoE is more likely to remain on hold than deliver another rate hike.
For the week so far, Dollar remains the strongest major currency, followed by Aussie and Yen, while Kiwi, Sterling and Swiss Franc sit at the bottom of the rankings.
On the geopolitical front, optimism surrounding the US-Iran peace framework was tempered after follow-up negotiations scheduled in Switzerland were unexpectedly called off. Switzerland's foreign ministry confirmed that talks planned at Bürgenstock would not proceed, while the White House said Vice President JD Vance would no longer travel to Switzerland due to unresolved logistical issues.
Yet the muted market reaction suggests investors still view the broader agreement as intact. Brent crude continues to trade around the USD 80 level rather than staging a renewed surge. Markets appear willing to give negotiators the benefit of the doubt for now, though a sustained return to pre-conflict oil prices will likely require tangible evidence that supply chains are normalizing, including a reopening of Strait of Hormuz shipping routes and a decline in elevated maritime insurance costs.
Canada Retail Sales Rise 0.6%, But Core Spending Remains Weak
The headline looked solid. The details were softer. Fuel-related spending lifted Canadian retail sales, but core purchases fell for a second consecutive month. Read More.
ECB's Lane Says Staying at 2% Was Not an Option, Wunsch Signals Hike Risk
The ECB isn't talking like a central bank that's finished hiking. Philip Lane defended June's rate increase, while Pierre Wunsch openly discussed the possibility of another move if inflation stays stubborn. Read More.
UK Retail Sales Surge 1.2% in May as Warm Weather and Promotions Boost Spending
Consumers ignored the gloom. UK retail sales more than doubled forecasts in May as warm weather, promotions and strong online demand drove the biggest upside surprise in months. Read More.
EUR/GBP Gains as Markets Scale Back BoE Tightening Expectations, More Upside Ahead
EUR/GBP gained as confidence in additional BoE rate hikes faded. Investors now see a higher hurdle for hawks to win support within the MPC, while the ECB has already delivered its latest rate increase. Read More.
Japan Core Inflation Holds at 1.4%, Fuel Subsidies Continue to Suppress Price Pressures
Japan's inflation slowdown may prove temporary. Core-core inflation fell to its weakest pace since 2022, but growing pipeline pressures continue to point toward future price increases. Read More.
New Zealand Exports Jump 18%, But Faster Import Growth Limits Trade Surplus
Exports were strong. Imports were even stronger. New Zealand's trade surplus narrowed despite an 18% surge in exports as domestic demand and petroleum imports drove a sharp rise in imports. Read More.
USD/JPY Daily Outlook
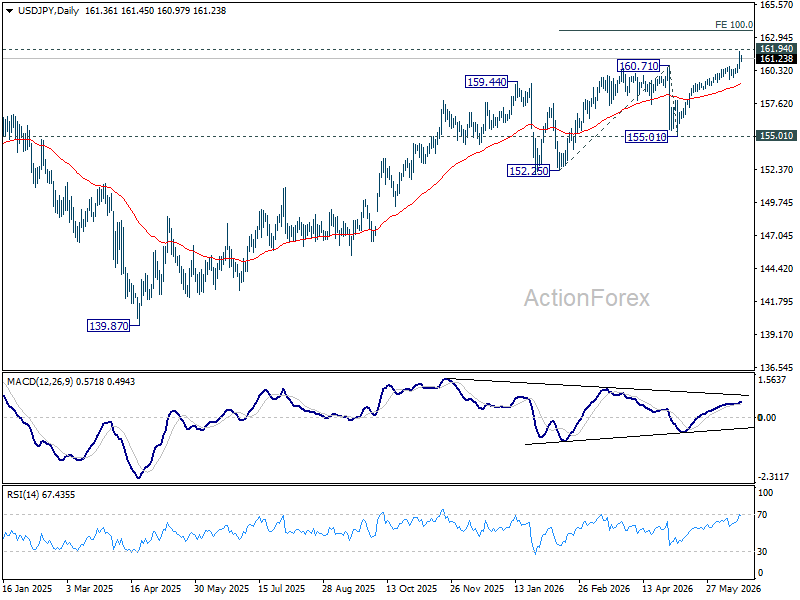
Intraday bias in USD/JPY remains on the upside for 161.94 high. Firm break there will resume larger up trend. Next near term target will be 100% projection of 152.25 to 160.71 from 155.01 at 163.47. On the downside, break of 160.58 minor support will turn intraday bias neutral first.
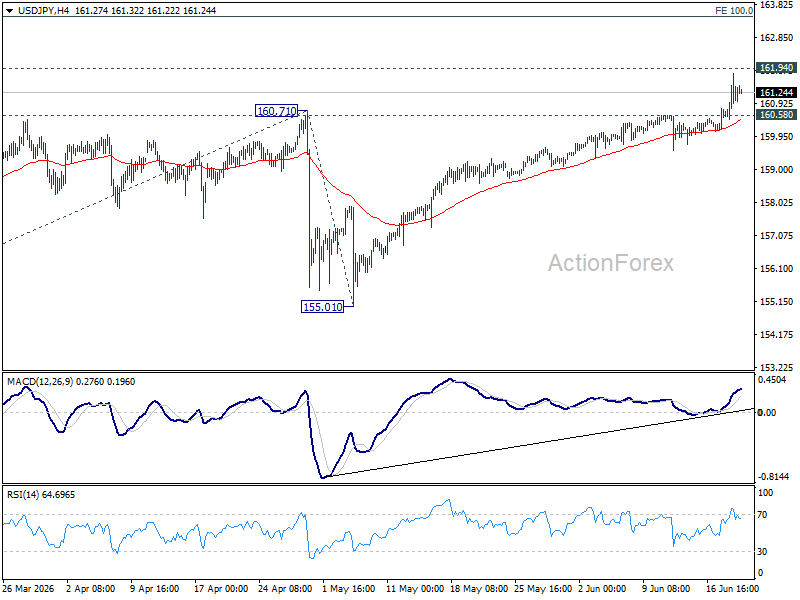
In the bigger picture, for now, corrective pattern from 161.94 (2024 high) is still seen as completed at 139.87. Rise from there is seen as resuming the long term up trend. So, break of 161.94 is expected at a later stage to resume the long term up trend. However, sustained break of 55 W EMA (now at 155.13) will dampen this view and bring deeper fall back towards 139.87 to extend the pattern from 161.94.
Canada Retail Sales Rise 0.6%, But Core Spending Remains Weak
Canada's retail sales rose 0.5% mom to CAD 73.0B in April, slightly below expectation of 0.6% mom, and marking a modest recovery in consumer spending. The increase was driven largely by higher sales at gasoline stations and fuel vendors, reflecting elevated fuel prices during the month. Sales increased in five of nine subsectors, suggesting spending gains were reasonably broad-based on the surface.
However, the underlying details painted a softer picture. The largest contribution came from gasoline stations and fuel vendors, where sales surged 5.1% mom. Excluding gasoline, motor vehicles and parts dealers, core retail sales fell -0.7% mom, marking a second consecutive monthly decline. The drop indicates that households were cautious about discretionary spending even as headline retail activity appears resilient.
Looking ahead, there are signs conditions may have improved in May. Statistics Canada’s advance estimate points to a further 1.0% increase in retail sales. If confirmed, that would suggest consumers are continuing to spend despite slowing economic momentum and higher borrowing costs.
Nevertheless, the divergence between headline and core sales remains noteworthy. While fuel-related spending boosted overall retail activity in April, underlying demand trends appear considerably weaker, reinforcing expectations that Canadian consumers remain under pressure.
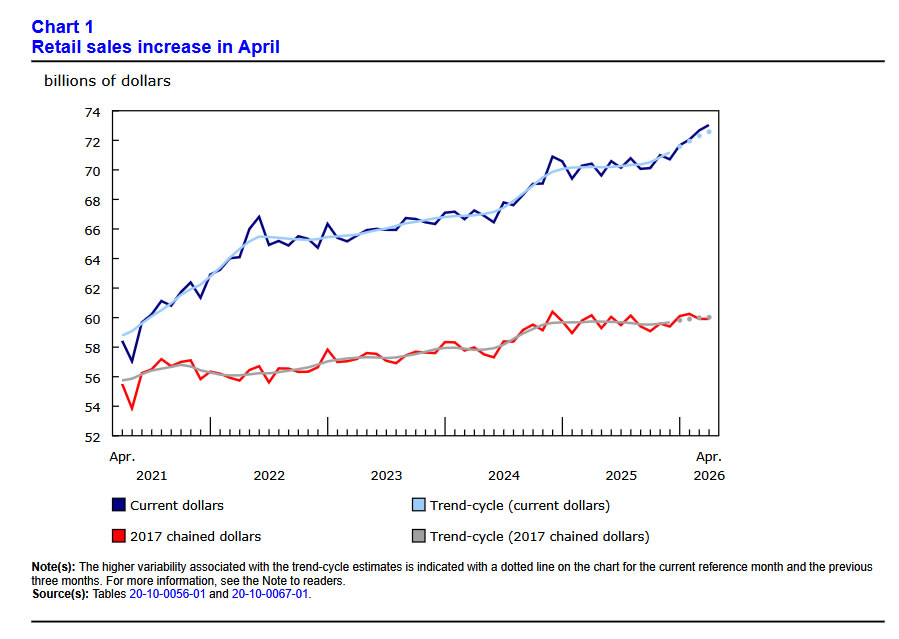
Canada Retail Sales (April 2026)
| Indicator | Actual | Expected |
|---|---|---|
| Retail Sales M/M | 0.6% | 0.6% |
| Core Retail Sales M/M | -0.7% | - |
| Advance Retail Sales Estimate (May) | 1.0% | - |
Sector Performance
| Category | M/M Change |
|---|---|
| Gasoline Stations & Fuel Vendors | 5.1% |
| Core Retail Sales | -0.7% |
| Retail Subsectors Rising | 5 of 9 |
| Retail Subsectors Falling | 4 of 9 |
USDJPY Trades Near a Multi-Decade High, Intervention Looms
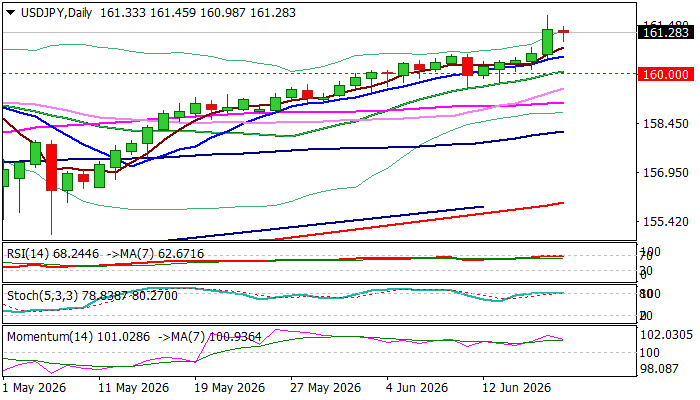
USDJPY is consolidating above 161 level on Friday after Thursday’s fresh acceleration higher hit 161.80, just ticks under a four-decade peak at 161.95, posted in June 2024.
The pair remains well supported and continued to trend higher after breaking the first threshold at 160, as dollar received fresh support from hawkish stance of the US central bank, which signaled a rate hike by the end of the year in the policy meeting earlier this week.
Friday’s action was so far shaped in a tight Doji candle, reflecting firm bullish structure, but overbought conditions, as well as tension in the market on looming intervention.
Japanese Financial Minister reiterated that authorities are prepared to take decisive action to arrest a slide in national currency.
However, another scenario in which Japanese authorities may keep their action on hold, remains on the table, with yen expected to surge well above 162 breakpoint zone in such case.
Res: 161.80; 161.95; 162.89; 163.57
Sup: 160.72; 160.51; 160.00; 159.11
EUR/USD Daily Outlook
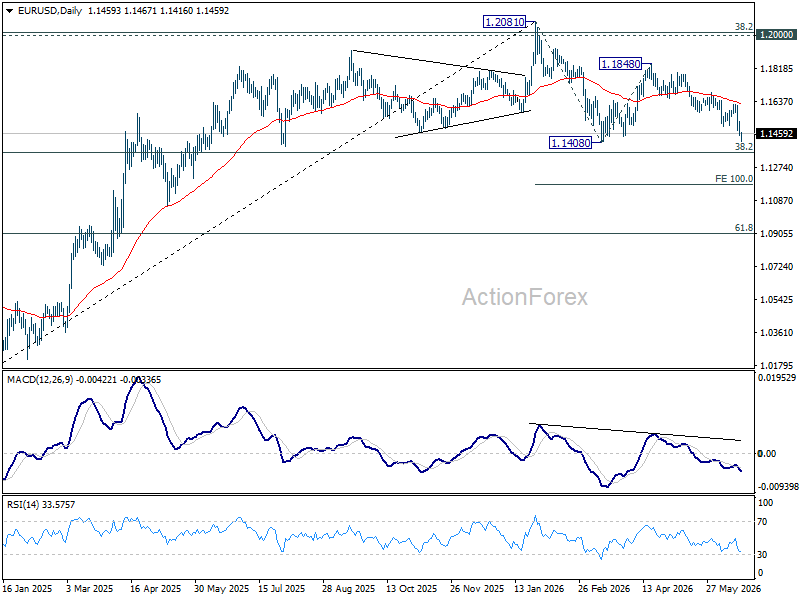
Intraday bias in EUR/USD remains on the downside. Firm break of 1.1408 support will resume whole decline form 1.1408 to 100% projection of 1.2081 to 1.1408 from 1.1848 at 1.1175. On the upside, above 1.1499 support turned resistance will turn intraday bias neutral again first. However, outlook will remain mildly bearish as long as 1.1621 resistance holds, in case of recovery.
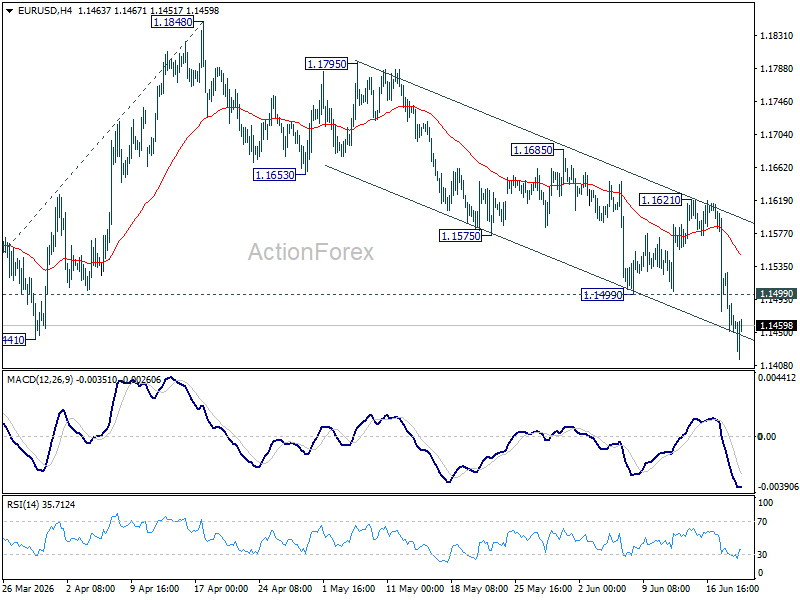
In the bigger picture, the strong support from 38.2% retracement of 1.0176 to 1.2081 at 1.1353 suggests that the pullback from 1.2081 is more likely a corrective move. Strong support was also found in 55 W EMA (now at 1.1547). Focus is back on 1.2 key cluster resistance level. Decisive break there will carry long term bullish implications. Nevertheless, break of 1.1408 support will revive the case of medium term bearish trend reversal.