

Sample Category Title
EUR/CHF Daily Outlook
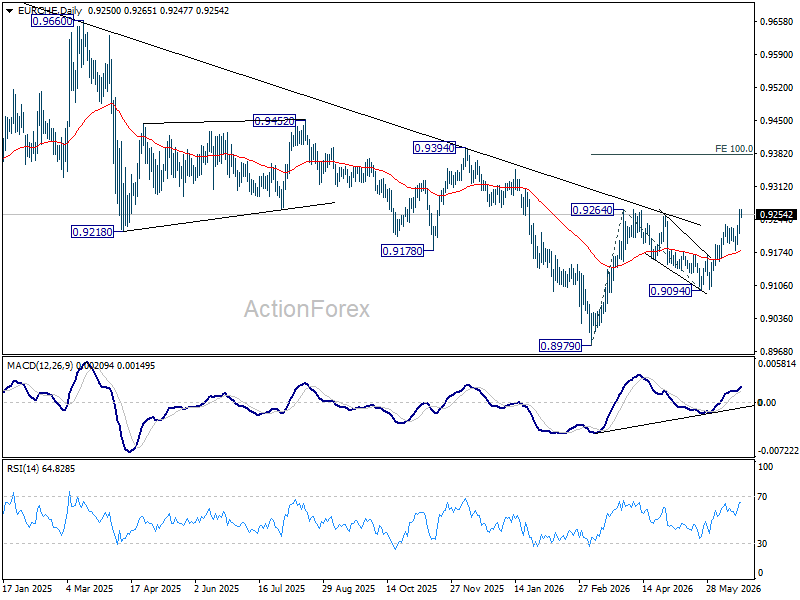
Intraday bias in EUR/CHF remains on the upside at this point. Decisive break of 0.9264 resistance will resume the rally from 0.8979 to 100% projection of 0.8979 to 0.9264 from 0.9094 at 0.9379. Outlook will now remain bullish as long as 0.9179 support holds, in case of retreat.
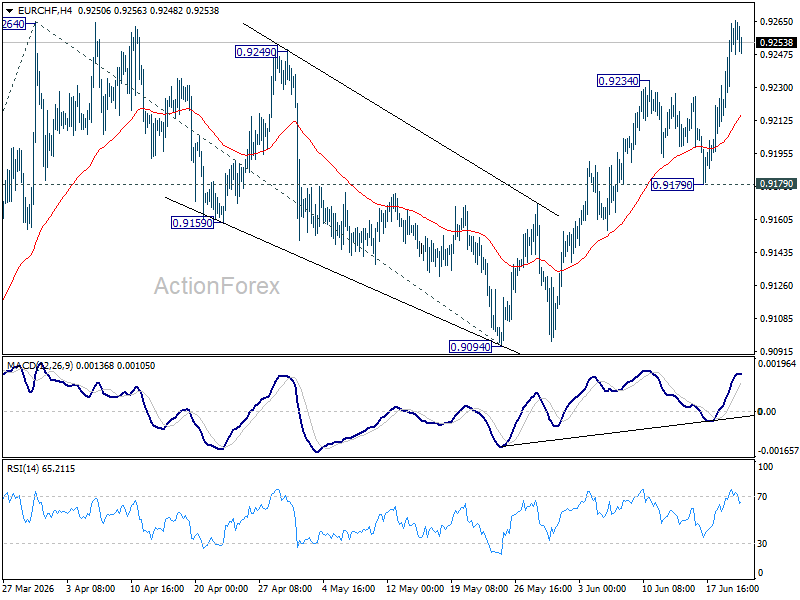
In the bigger picture, the break of medium term falling trend line resistance indicate that 0.8979 is already on medium term bottom. Considering bullish convergence condition in W MACD, rise from there should at least be reversing the fall from 0.9928, with prospect of developing into a medium term up trend. Firm break of 0.9394 resistance will add more credence to this case. For now rise will remain on the upside as long as 0.9094 support holds, in case of retreat.
GBPUSD – Bears Face Increased Headwinds from 2026 Low
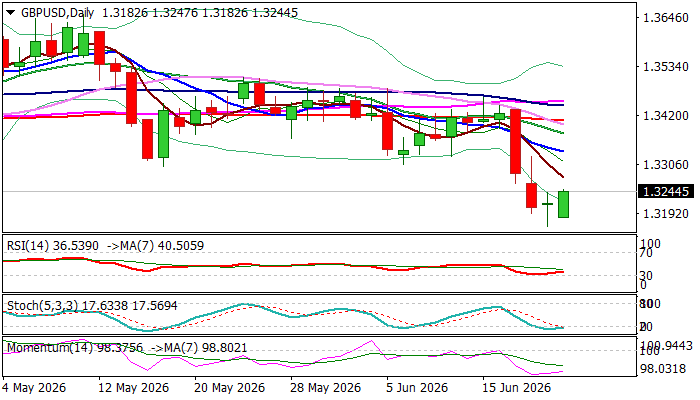
Cable continues to trade near 2026 low (1.3159, posted on March 31 and last Friday’s low / trendline support at 1.3163) following news of resignation of UK PM Starmer.
Growing uncertainty about how the new Prime Minister (likely to be in place in early September) will run the economy, burdened by prolonged weak economic growth, high debt and the highest borrowing cost in G7 group, with demands to cut spending and increase investments, particularly in defense sector.
All these factors continue to pressure pound, along with stronger dollar, underpinned by Fed’s hawkish steer.
Bearish daily studies contribute to negative short-term outlook, though oversold conditions suggest that near-term action may consolidate above strong supports at 1.3163/59 before larger bears regain control.
Solid resistances at 1.3300 zone (former range floor) and 1.3335 (falling 10DMA) should cap upticks, while potential break higher would put bears on hold and unmask next strong barriers at 1.3408 (daily cloud base / 200DMA).
Res: 1.3278; 1.3300; 1.3335; 1.3377
Sup: 1.3159; 1.3080; 1.3009; 1.2984
GBP/USD Shrugs Off Starmer’s Resignation as 1.3000 Matters More Than Downing Street
UK Prime Minister Keir Starmer's resignation marks a significant political development, but the muted reaction in Sterling suggests markets had largely anticipated the outcome. After weeks of speculation over his future, investors appear to view the announcement less as a shock and more as the formal conclusion of a process that had already been priced into UK assets.
In his resignation statement, Starmer acknowledged that his position had become untenable within the Labour Party. "The question my party is asking now is whether I am best placed to lead us into the next general election," he said. "I have heard the answer of my parliamentary party to that question, and I accept that answer with good grace." Starmer confirmed he had informed King Charles of his decision and said he would remain prime minister until a successor is chosen.
The timetable points to a relatively orderly transition. Nominations for the Labour leadership will open on July 9 and conclude before Parliament returns in September. If former Greater Manchester Mayor Andy Burnham emerges unopposed, as increasingly appears possible, he could become prime minister as early as mid-July. Otherwise, a contest would likely conclude by the end of August.
For financial markets, the identity of the likely successor matters more than Starmer's departure itself. Burnham has spent recent weeks reassuring investors that he intends to maintain Labour's existing fiscal framework and tax commitments. That has helped calm concerns that a leadership change could trigger a significant shift in economic policy. Unlike the turmoil triggered by the fiscal experiment of the 2022 Liz Truss government, investors currently see continuity rather than disruption.
The relatively subdued response in Sterling reflects this assessment. Markets dislike political uncertainty, but they dislike policy surprises even more. The emergence of a clear frontrunner with a reputation for fiscal pragmatism has reduced the risk premium that might otherwise have accompanied the resignation of a sitting prime minister.
More importantly, GBP/USD is currently being driven by forces beyond Westminster. The Federal Reserve's increasingly hawkish outlook has strengthened the Dollar broadly, while the Bank of England has shifted toward a more neutral stance as UK growth slows and inflation pressure appears to have peaked. As a result, yield differentials continue to move against Sterling regardless of domestic political developments.
From a market perspective, the resignation changes little about the fundamental drivers of the currency pair. If anything, Sterling's inability to rally on an orderly political transition highlights the dominance of monetary policy and interest-rate expectations in current FX pricing.
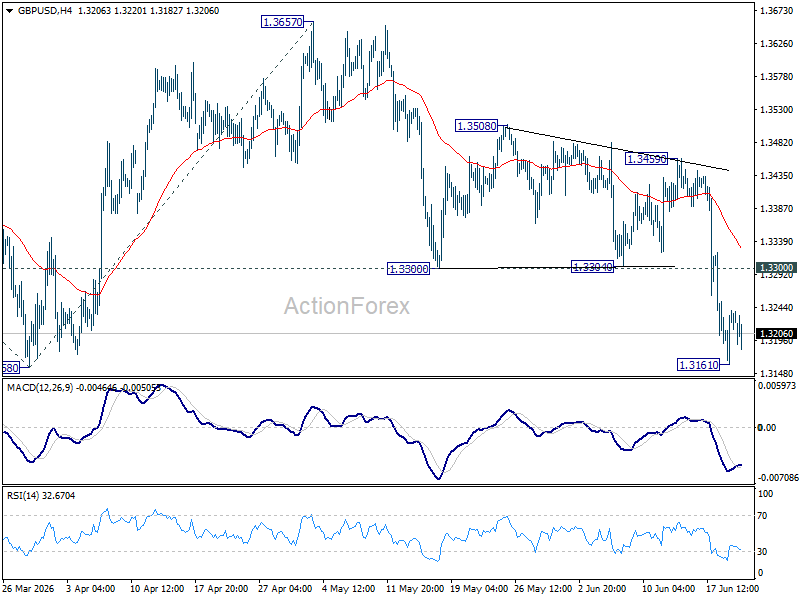
Technically, GBP/USD remains under pressure following repeated rejection by the falling 55 D EMA. That failure is a notable bearish signal and suggests the decline from May's 1.3867 high may still have further to run. Immediate attention is focused on 1.3158 support.
A firm break below 1.3158 would resume the broader decline from 1.3867 and target 100% projection of 1.3867 to 1.3158 from 1.3657 at 1.2948. Such a move would place GBP/USD directly into the strategically important 1.3000 zone.
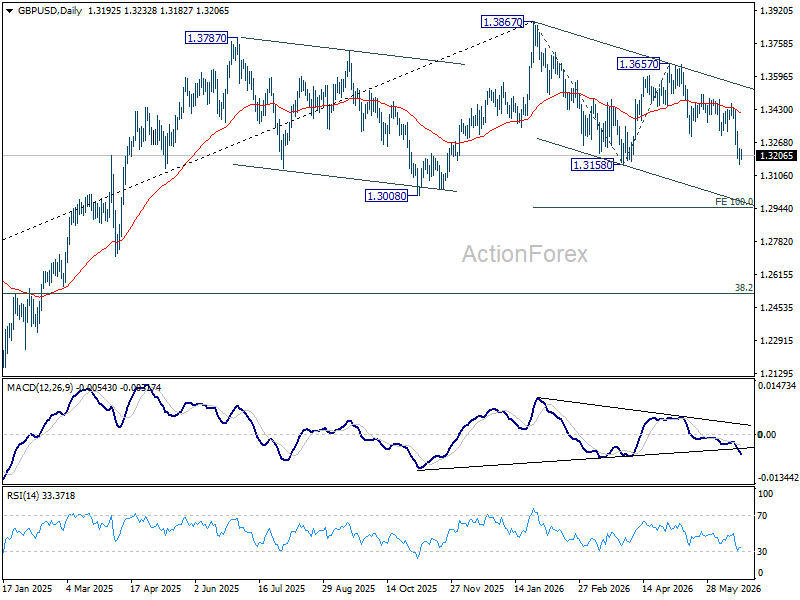
That area carries significance beyond simple psychology. Structural support lies at 1.3008. A decisive break below that level would suggest the decline from 1.3867 is at least correcting the entire rally from the 2022 low at 1.0351, with risk of a complete trend reversal. Under that scenario, the next medium-term target would be 38.2% retracement of 1.0351 to 1.3867 at 1.2524.
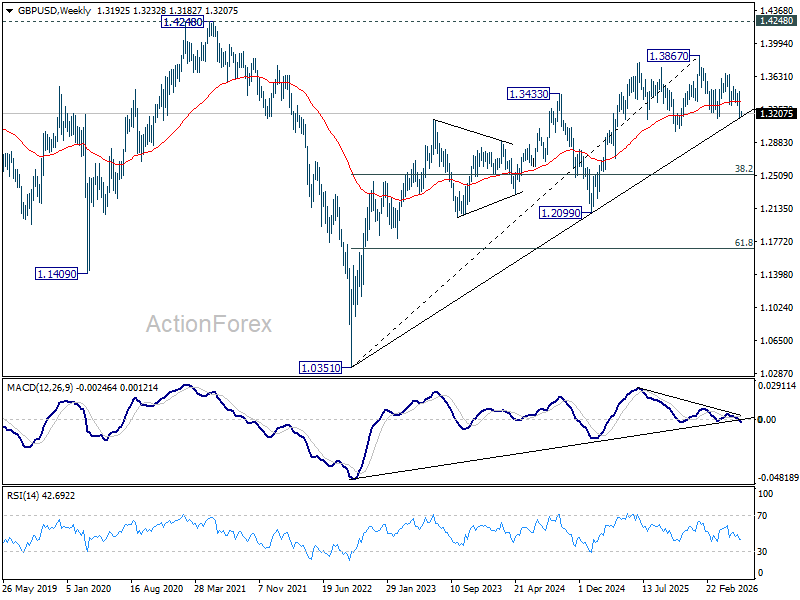
For now, Downing Street may be changing occupants, but currency markets remain focused elsewhere. The next major move in GBP/USD is more likely to be determined by Fed policy, BoE expectations, and the battle around 1.3000 than by the outcome of Labour's leadership contest.
Gold Falls for the Third Consecutive Week: Is There Still Upside Potential?
Gold starts the week near 4,150 USD per troy ounce, its lowest level since 11 June. The precious metal has recorded a third consecutive weekly decline amid a stronger US dollar and growing expectations that the Federal Reserve may continue tightening monetary policy.
The US currency refreshed its yearly high after the Federal Reserve’s June meeting. Although the regulator left the interest rate unchanged, the updated forecasts proved much more hawkish. Nine out of nineteen FOMC members now allow for a rate hike before the end of the year. The market itself is already pricing in the probability of such a move by September at around 70%.
Persistently high interest rates usually weigh on gold. This is because the appeal of dollar-denominated assets increases, as do the opportunity costs of holding the metal. The key point is that gold does not generate coupon income.
Investors are also monitoring the geopolitical situation. Additional uncertainty was triggered by reports that the planned talks between the US and Iran on a final settlement of the Middle East conflict had been postponed.
Another negative factor for the gold market was Goldman Sachs’ decision to lower its year-end forecast for the metal from 5,400 to 4,900 USD per ounce. This added further pressure to quotes.
XAU/USD Technical Analysis
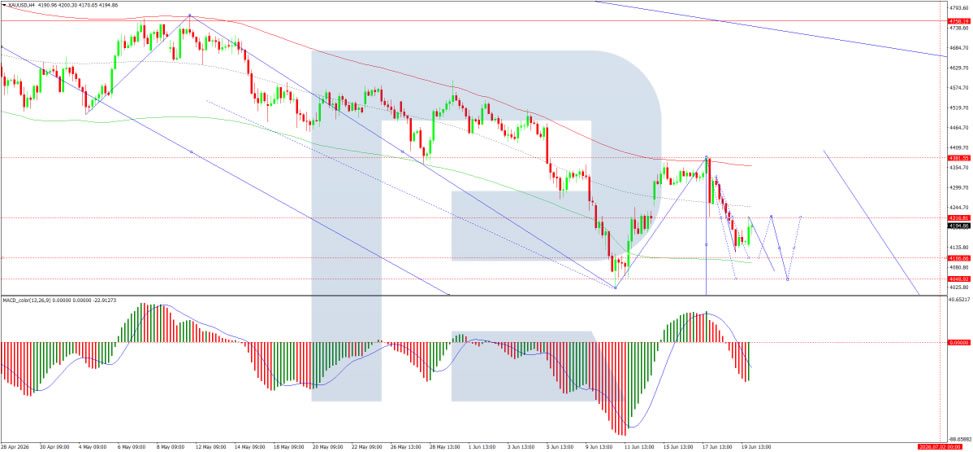
On the H4 chart of XAU/USD, the market formed a consolidation range around 4,216 and completed a downward wave to 4,121. We expect a corrective move towards 4,216. After that, the probability of a new decline towards 4,100 may be considered, with the potential for the wave to extend to 4,040.
The MACD indicator confirms the current downward impulse. The signal line is below the central line and is pointing firmly downwards.
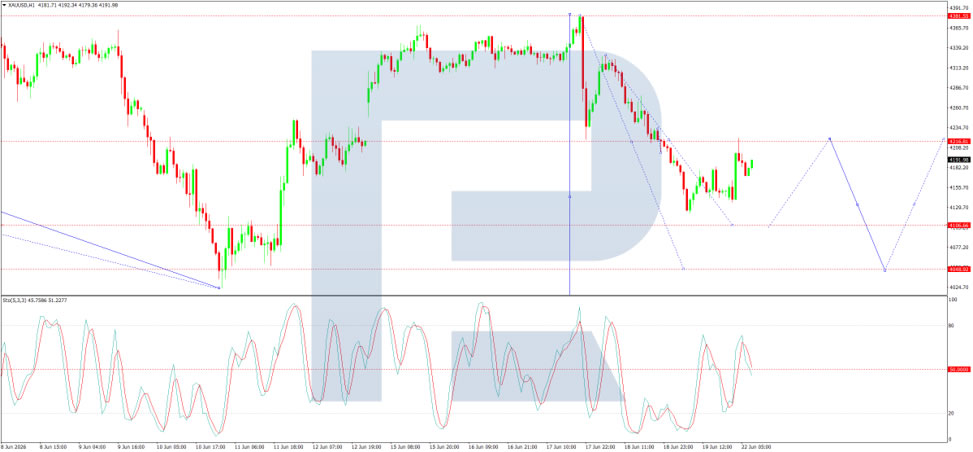
On the H1 chart, the market broke below 4,200 and completed a downward wave towards 4,168. Going forward, we consider the possibility of a correction towards 4,200, testing this level from below. After that, a decline towards 4,100 is expected, followed by a rebound towards 4,200.
The Stochastic oscillator confirms this scenario: the signal line remains below 50 and is under pressure to decline towards 20.
Ethereum: Market Assesses the Strength of the Corrective Recovery
Following a period of heightened volatility in early June, investor attention in Ethereum has once again shifted towards institutional demand and the development of the spot ETF market in the United States. The funds launched last year continue to serve as one of the key channels for capital inflows into digital assets, while their daily flow statistics remain an important indicator of sentiment among major market participants. Expectations regarding the future direction of Federal Reserve monetary policy may also influence Ethereum’s price dynamics. Changes in interest-rate projections traditionally affect investors’ appetite for risk assets, including the cryptocurrency market.
Technical Picture
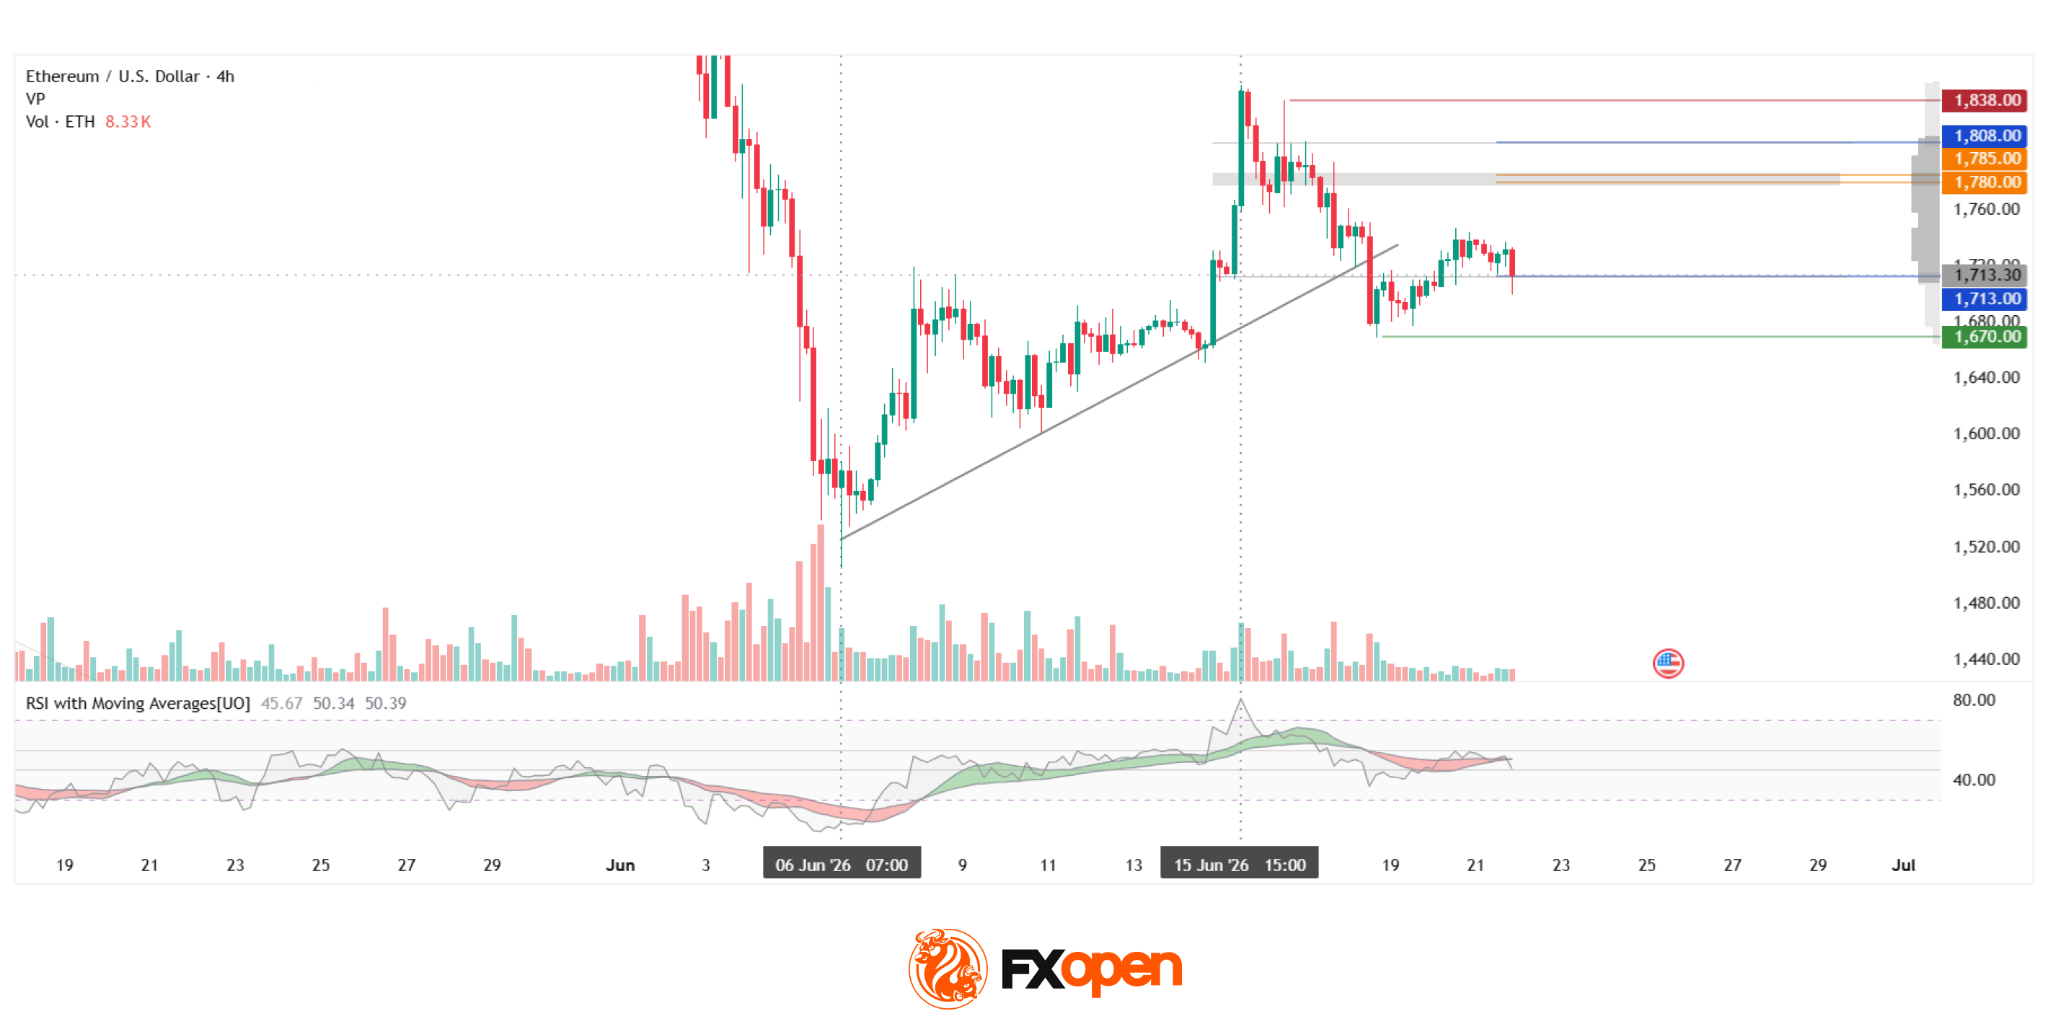
On the four-hour chart of ETH/USD, a corrective recovery can be observed from the June low, followed by the formation of a local high near the $1,838 resistance level. After reaching this area, buyers lost momentum and the price moved below the ascending trendline. The attempted trend break currently appears unconvincing and has so far been limited to a single bearish candle on 18 June, the impact of which was subsequently offset by the following candles.
Should selling pressure persist, the $1,670 area may come into focus for market participants. If the asset manages to establish itself above the lower boundary of the profile at $1,713 and continues its recovery within the current profile, the primary target could be the POC zone at $1,780–$1,785, followed by the upper boundary of the profile at $1,808. If the current profile density is overcome, the red resistance level may gain further significance. The RSI + MAs indicator shows readings of 46, 50 and 50. The main oscillator line and both moving averages remain in the middle of the neutrality zone, suggesting that the instrument currently has no clear directional bias.
Key Takeaways
Ethereum’s technical picture remains neutral, with RSI + MAs showing no signs of a clear directional impulse. In the coming weeks, additional volatility may be driven by capital flows into spot Ethereum ETFs and by changing expectations regarding the Federal Reserve’s next policy moves.
FXOpen offers the world's most popular cryptocurrency CFDs*, including Bitcoin and Ethereum. Floating spreads, 1:2 leverage — at your service (additional fees may apply). Open your trading account now or learn more about crypto CFD trading with FXOpen.
*Important: At FXOpen UK, Cryptocurrency trading via CFDs is only available to our Professional clients. They are not available for trading by Retail clients. To find out more information about how this may affect you, please get in touch with our team.
This article represents the opinion of the Companies operating under the FXOpen brand only. It is not to be construed as an offer, solicitation, or recommendation with respect to products and services provided by the Companies operating under the FXOpen brand, nor is it to be considered financial advice.
Sunrise Market Commentary
Markets
European bonds sold off in a Friday session stripped of US investors (Juneteenth). German bunds immediately opened weaker, responding at a $3 price rise in oil that happened after European closing hours the day before. While front end yields afterwards more or less traded sideways, the long end extended declines throughout the day. (Inflation) risk premia may have been the culprit here. US-Iran negotiations already hit a snag less than a day after the MoU signing over continued fighting between Israel and Lebanon-based Hezbollah. German rates eventually added between 3.9 and 7 bps in bear steepening. UK gilts underperformed, printing yield increases varying between 6.9 and 8.5 bps. Apart from oil, dire UK budget data drove the move. They underscored the challenging budgetary setting that the soon-to-be prime minister Burnham is to inherit from Starmer. The latter's inner circle are expecting he'll set out a timetable for his departure from office, potentially as soon as today, after Burnham won the Manchester by-election and secured his seat in parliament. Sterling keeps its cool for now. EUR/GBP finished lower on Friday around 0.8667. The couple gapped higher this morning with expectations for Starmer's imminent exit building but erased gains soon enough. It currently changes hands around 0.867. Political and budgetary uncertainty could nevertheless keep UK assets under pressure. EUR/USD rebounded from intraday lows of 1.1418 to around 1.146 going into the weekend. The technical picture looks weak still. The jury remains out since it's still early trading, but it is telling that the pair posts a small drop despite the relatively constructive Asian risk settings and a declining oil price. Brent oil eases to $78.8 this morning after opening to a high of $82.3. US-Iran negotiations produce the expected conflicting headlines but have, according to the Iranian foreign minister, Pakistani and Qatari mediators delivered progress, amongst others with respect to the fighting in Lebanon. The back-and-forth news flow is here to stay and in a sense does not differ that much from the situation before the MoU. The US dollar maintains the upper hand against JPY too. USD/JPY headed into the weekend little changed at 161.3 but is advancing in Asian dealings this morning towards 161.7. We'll be looking for FX intervention(s) (threats) with the pair since Thursday having pierced through the psychologically important 160 barrier. The US returns from an extended weekend today. US Treasuries in a catch-up move lose some ground, pushing yields between 1.7 and 4.5 bps higher. The eco calendar is all but empty today, setting the stage for some technically inspired trading. June PMIs on Tuesday and US May PCE inflation (Thursday) are among the key input to watch later this week. The latter could add fuel to lingering Fed hiking bets after the FOMC meeting of last week. A first one is fully discounted by September. ECB's Lagarde is scheduled for a double appearance today. Fed's Waller discusses the international role of the USD. In a broader perspective, the limited number of Fed appearances is noticeable and perhaps already the result of the new "less is more" Fed regime.
News & Views
Irish PM Martin said in an interview with the FT that he believes that an agreement on the EU's savings and investment union can be reached by year-end. Ireland takes control of the EU's rotating presidency for H2 2026 and hopes to play a role in achieving this. The EU's six biggest economies already created an informal group to fast-track capital markets integration. A proposal to centralize supervision of key financial entities is the centerpiece of the savings and investment union. The other pillars focus on increasing retail participation in capital markets, improving firms' access to capital and overcoming fragmentation.
Czech deputy governor Zamrazilova called last week's rate hike a "forward looking reaction" aimed to minimize any potential second-round effects. Risks include rapid wage growth, particularly in the service sector, rising rents, and the increase in consumer loans in recent months. She added that "at the moment, we don't see it as the start of a new cycle of monetary policy tightening". The CNB doesn't precommit and leaves all options open depending on incoming economic data.
Oil Eases as US and Iran Agree 60-Day Roadmap in Switzerland
In focus today
In the euro area, the flash consumer confidence for June is released. The survey period is likely 1-21 June so the US-Iran deal and subsequent drop in the oil price might not fully be reflected in the data.
In Denmark, focus will be on the June consumer confidence indicator. Like with euro area consumer confidence, the survey period likely only briefly included the US-Iran deal and drop in oil prices. Thus, the impact of the deal on the June data will be limited.
The rest of the week, focus will be on the June flash PMIs released for many of the big economies, with euro area, US and UK PMIs released on Tuesday. We also look out for US PCE inflation on Thursday and ECB's consumer expectations survey on Friday.
Economic and market news
What happened over the weekend
In geopolitics, US Vice President JD Vance and senior Iranian officials concluded a first round of talks in Switzerland early on Monday, agreeing via Qatari and Pakistani mediators on a 60-day roadmap towards a final deal based on last week's memorandum of understanding. The parties settled on a mechanism to end the fighting in Lebanon and opened a communications line to safeguard commercial shipping through the Strait of Hormuz, according to Reuters. Following the joint statement, Brent crude futures declined, trading around 79.4 USD/bbl at the time of writing.
In the UK, Greater Manchester mayor Andy Burnham comfortably won the Makerfield by-election on Friday, securing a seat in parliament and paving the way for a potential leadership challenge to Prime Minister Starmer. Burnham would need the backing of 81 Labour MPs (a fifth of the parliamentary party) to launch a formal contest, and recent polling of party members suggests he would be a strong contender. While Burnham has pledged to adhere to existing fiscal rules, the prospect of renewed leadership turbulence is likely to keep concerns in Gilt markets very much alive.
In China, the People's Bank of China left its key Loan Prime Rates unchanged, keeping the one-year LPR at 3.0% and the five-year LPR at 3.5% for a 13th consecutive month, in line with expectations. The decision reflects caution amid the fallout from the Middle East conflict and associated upward pressure on energy prices, even as domestic growth momentum has softened on weak consumer data and continued falling home prices.
Equities: Equity markets moved lower on Friday, although with the US closed and a few European markets also shut, the price action was primarily driven by Europe. The setback was dominated by renewed concerns around Iran, not least as Vice President Vance did not travel to Switzerland to continue talks with Iran aimed at securing a final peace agreement and an end to the conflict around Iran and the Strait of Hormuz. Oil moved higher, and we saw a broader defensive rotation.
This should be seen in the context of last week's massive rotation in the opposite direction, out of energy and into cyclicals, not least IT stocks. That raises the key question for investors: should one position for the micro-timing of every positive or negative headline around geopolitics, or should the focus remain on the underlying strong economy and the extreme earnings growth in the IT sector?
We lean towards the latter. Looking ahead, will there be more bumps on the road in relation to Iran? Yes, very likely. That is part of Trump's built-in strategy in what he calls The Art of the Deal. The relevant question for investors is therefore whether the focus should be on the end goal, or on trying to micro-time whether markets move up or down on any given day.
This morning, Asian markets are mixed, but Japan, South Korea and Taiwan are all higher. In other words, the three large, tech-heavy Asian equity markets are trading higher this morning. European and US futures are lower.
FI and FX: It was a rather uneventful day in terms of data releases Friday with US and large parts of Scandinavia out. European yields rose across the curve in a bearish steepening of the curve as developments in the Middle East and subsequent expected talks between US-Iran over the weekend were digested alongside the prospect of incoming tightening from the Fed. EUR/USD extended its latest decline during Friday's session breaking firmly below the 1.15 mark. EUR/CHF has continued its climb higher following the dovish tunes on the SNB meeting Thursday while EUR/GBP has tracked higher on political developments in the UK. Friday, we published our latest FX Forecast Update, where we stay positive on USD and negative on SEK, NOK, GBP vis-à-vis EUR.
Markets Whipsawed as Fresh Geopolitical Friction Jolts Switzerland Peace Talks
Key takeaways
- US-Iran peace negotiations remain fragile despite progress on reopening the Strait of Hormuz. While crude oil continues to flow through the waterway and a 60-day roadmap remains intact, fresh geopolitical threats and proxy-conflict risks highlight that energy markets are likely to remain highly sensitive to headline-driven volatility.
- The US dollar remains the dominant macro trade. Supported by the Fed's higher-for-longer stance and ongoing geopolitical uncertainty, the US Dollar Index continues to strengthen while the Japanese yen trades dangerously close to intervention territory and other Asian currencies remain under pressure.
- Markets are entering a period of divergence across regions and asset classes. Japanese and South Korean equities continue to outperform, while Hong Kong equities struggle amid growth concerns in China. At the same time, investors are increasingly balancing geopolitical developments against rising protectionism, elevated bond yields, and slowing global growth expectations.
- Chart of the day: GBP/USD may face further weakness below 1.3262/3280 key short-term resistance as the pair probes the 1.3160 key support amid UK Prime Minister Starmer’s potential imminent resignation.
Chart of the day - GBP/USD is looking vulnerable for a major bearish breakdown
Fig. 1: GBP/USD minor trend as of 22 Jun 2026 (Source: TradingView). The information presented is historical information, and past performance is not indicative of future performance.
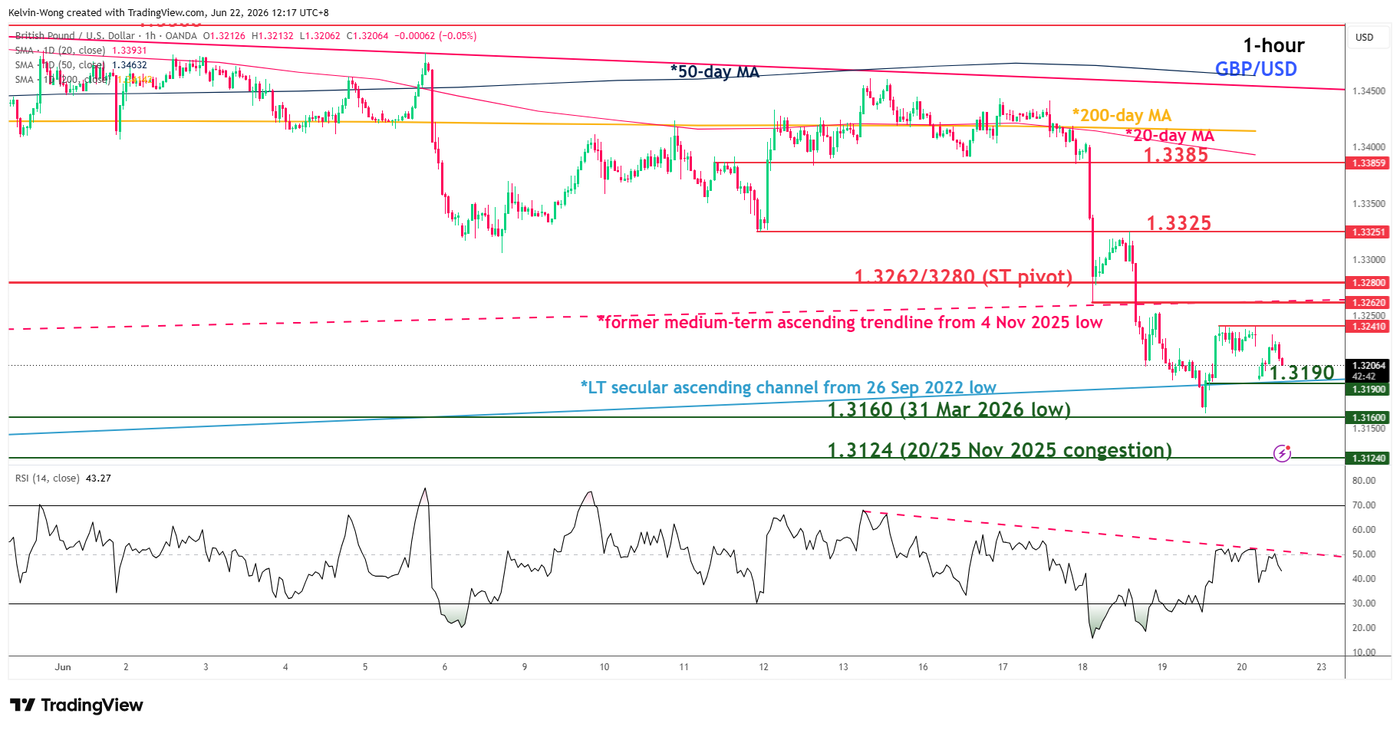
The recent plunge in GBP/USD managed to survive after a retest of the long-term secular ascending channel support from the 26 September 2022 low on last Friday, 19 June 2026 (printing an intraday low of 1.3163) (see Fig. 1).
However, short-term bullish momentum is absent, as suggested by the hourly RSI, which remains capped below a key descending trendline at 50.
Watch the 1.3262/3280 key short-term pivotal resistance for a bearish bias outlook to expose the next intermediate supports at 1.3190 and 1.3160.
However, a clearance and an hourly close above 1.3280 would invalidate the bearish bias, opening the door to a potential squeeze up towards the medium-term resistance at 1.3325.
Top macro headlines
- Fresh threats stoke tensions at Switzerland peace talks: High-level diplomatic negotiations in the Swiss resort of Bürgenstock got off to a rocky start over the weekend. A fresh warning of retaliatory military strikes should regional proxies advance (hostilities between Hezbollah and Israel) disrupted the early sessions, briefly prompting Iranian media to report a temporary halt in negotiations before sources confirmed meetings continued under a highly volatile 60-day de-escalation window between the US and Iran.
- Strait of Hormuz reopening holds despite rhetoric: Despite Iranian localised claims of operational blockades over the weekend, real-time maritime tracking verified that millions of barrels of crude oil continued to move systematically through the Strait of Hormuz. Insurance syndicates and shipping fleets are maintaining transits while keeping a sharp eye on structural security guarantees.
- S&P 500 futures dipped amid uncertainty over US-Iran peace talks: Coming off the Friday Juneteenth cash market close, the E-mini futures of the S&P 500 and Nasdaq 100 shed by 0.4% and 0.5% in today’s Asia opening session as media outlets reported that US-Iran talks on a peace deal to settle the issue of Tehrans nuclear program and permanently reopen the Strait of Hormuz are still continuing into Monday. The talks had a confusing start on Sunday as Iranian media reported that Iran halted talks over US President Trump’s latest threat of a Hezbollah offensive towards Israel.
- G7 summit in Evian wraps up amid looming trade friction: The three-day G7 economic summit concluded in France with a spotlight on structural trade policies. Significant friction emerged over prospective 100% tariffs targeting specific digital and consumer luxury sectors, alongside a unified initiative to address systemic industrial imbalances and diversify clean-tech supply chains outside primary APAC manufacturing corridors.
- Political headwinds in the UK: Allies of UK Prime Minister Keir Starmer to set out a timetable for his departure imminently, paving the way for party rival, Andy Burnham, to replace him. A statement from Starmer ceding power could come as soon as Monday, and The Guardian newspaper reported on Sunday evening that Starmer would set out his intentions in a statement outside Downing Street on Monday morning. The British pound extends its losses by 0.2% against the US dollar in today’s Asian opening session to trade at 1.3205 after last week’s steep loss of 1.3% against the greenback.
Key macro themes
- The geopolitical premium recalibration in energy complexes: The fragile reality of the Bürgenstock peace framework underscores that removing the Middle Eastern war premium will not occur in a straight line. Front-month energy futures spent the weekend instantly reacting to the delicate diplomatic landscape, proving that headline risk remains the dominant driver of intraday crude volatility. While physical barrels are currently transiting the Strait of Hormuz normally, the constant threat of localised proxy escalation continues to hold a structural floor underneath back-month global supply curves.
- Broad G7 protectionism and global supply chain friction: The rhetoric following the G7 summit confirms that Western economies are adopting more defensive economic postures. The looming deployment of targeted 100% tariffs indicates that cross-border trade friction is expanding beyond raw automotive electric vehicles into upstream supply networks. For global macro allocators, this structural shift toward "friend-shoring" means structural input costs are likely to remain sticky, introducing secondary complications for central banks attempting to coordinate an easing cycle.
- Institutional capital rotations in the crypto winter core: The disconnect between resilient benchmark equity indices and the collapse of valuations in digital assets highlights an ongoing liquidity drain in highly speculative alternative asset classes. Record-breaking outflows from spot digital vehicles indicate that institutional capital is prioritising sovereign nominal yields and traditional large-cap corporate cash flows over crypto-risk premiums. As a result, structural regulatory milestones like MiCA adoption are acting as survival baselines rather than immediate bullish catalysts.
Global markets impact
Equities: S&P 500 E-mini futures is trading down by 0.25% in today’s Asian session, paring its earlier intraday loss of 0.6%, maintaining a 9.6% year-to-date advance. European cash bourses experienced muted trade at the close of the week, with the DAX digesting broader macro stagnation projections of 0.8% for the Eurozone block heading into the summer quarter.
Fixed Income: Sovereign yields globally adjusted to sticky energy pricing baselines. With consumer price indexes expected to show upward pressure due to past distribution disruptions, the 2-year US Treasury yield gapped up by 32 bps on Monday’s Asian session to trade at 4.21%, a 16-month high.
FX: The U.S. Dollar Index (DXY) maintained its structural uptrend, drawing safety flows amid volatile Swiss headlines surrounding the US-Iran talks, and rose marginally by 0.05% to 100.80 in today’s Asian session. The euro remained flat against the greenback amid stagnant growth figures from the Eurozone forums, while the Japanese yen weakened by 0.1% to trade at 161.49 per US dollar, near a 2-year low as speculators probe the intervention level of 161.95.
Commodities: Intraday volatile movement for WTI and Brent crude over conflicting headlines of US-Iran peace deal talk in Switzerland. WTI and Brent crude are now trading down by almost 1% at $76.85-$79.44/bbl, erasing earlier intraday gains of 1.9% and 2.4% but still holding above their respective key 200-day moving averages after news that mediators Qatar and Pakistan have announced a formal 60-day roadmap toward a final US-Iran peace deal.
Asia Pacific impact
- Regional currencies under pressure: Asian currencies began the week on the defensive, heavily weighed down by the renewed weekend surge in dollar-denominated energy input costs. Exporters across Taiwan and South Korea are monitoring local currency baselines as wide interest rate differentials continue to favour the greenback. The USD/KRW rose by 0.4% in today’s Asian session to trade at 1,535, holding firmly above the 20-day moving average at 1,520. Meanwhile, mixed performances are seen in the Asia Pacific bourses: Japan’s Nikkei 225 (+1.8%), South Korea’s KOSPI (+1.9%), China’s CSI 300 (+0.16%), Australia’s ASX 200 (unchanged), Hong Kong’s Hang Seng Index (-1.9%), and Singapore’s STI (-0.2%)
- Supply chain rediversification forces tactical multiples compression: Decisions at the G7 summit targeting clean-tech and industrial manufacturing capacity inside Asia are forcing an immediate re-evaluation of long-term corporate guidance. Regional tech and industrial equities are preparing for narrower valuation margins as Western supply policies favour regional redundancy over cost optimisation.
Top 4 events to watch today
- Canada Core Inflation Rate (May) - 8.30 pm SGT (consensus: 2.2% y/y, Apr: 2.1%) Impact: USD/CAD, CAD crosses
- ECB Consumer Confidence Flash (Jun) - 10:00 pm SGT (consensus: -18%, May: -19) Impact: EUR/USD, EUR crosses, DAX
- Potential announcement of UK Prime Minister Starmer’s resignation Impact: GBP/USD, GBP crosses, FTSE 100
- US-Iran peace talks roadmap discussions Impact: All asset classes.
Inflation, Jobs and 0.7000: A Defining Week for RBA and AUD/USD
Two reports. Forty-eight hours. One question. Is the RBA done hiking, or is one final move still waiting in August? Australia's inflation report on Wednesday and employment data on Thursday could provide the clearest answer yet. After three consecutive rate hikes earlier this year, the RBA hit pause in June at 4.35%. But that pause solved nothing. Inflation is still too high, policymakers remain uneasy, and markets are deeply divided over whether the tightening cycle has truly ended.
Wednesday's CPI release will be the first battleground. Headline inflation is expected to tick up from 4.2% yoy to 4.3% yoy, but the real story lies beneath the surface. Oil prices have collapsed since the US-Iran ceasefire, reducing pressure on headline measures ahead. If trimmed mean inflation still accelerates from 3.4% yoy to 3.6% yoy, it would send an uncomfortable message to the RBA: domestic inflation is proving more stubborn than hoped.
That is exactly the scenario policymakers fear. A rise in underlying inflation would suggest that services prices and broader domestic cost pressures are offsetting relief from lower oil prices. Instead of validating the June pause, it could strengthen the argument for another rate increase before inflation expectations become more deeply embedded.
Then comes Thursday's jobs report. Markets expect employment growth of 30k after April's unexpected loss of -18.6k jobs, while unemployment is forecast to fall from 4.5% to 4.4%. If the labor market rebounds as expected, the message becomes difficult to ignore: inflation is heating up again while employment remains resilient despite interest rates sitting at their highest levels in years.
That combination—sticky inflation and strong jobs—is exactly what would keep August hike expectations alive. It may not be enough to launch AUD/USD into a sustained rally against a broadly stronger US Dollar, but it could be enough to keep the pair comfortably above 0.7000 and force traders to price in one more RBA move.
The opposite outcome would be far more dramatic. If employment contracts again or unemployment climbs beyond 4.5%, markets may start treating the June pause as the end of the tightening cycle. The RBA would not necessarily be finished, but traders would likely front-run a prolonged pause. In that scenario, AUD/USD could quickly lose its grip on 0.7000.
The technical picture suggests the market is already leaning cautiously bearish.
- AUD/USD has been rejected by 61.8% retracement of 0.8006 (2021 high) to 0.5913 (2024 low) at 0.7206.
- Daily MACD bearish divergence remains firmly in place.
- Repeated failures below the falling 55 D EMA, currently at 0.7093.
They reinforce the view that May's peak at 0.7277 may have marked an important medium-term top.
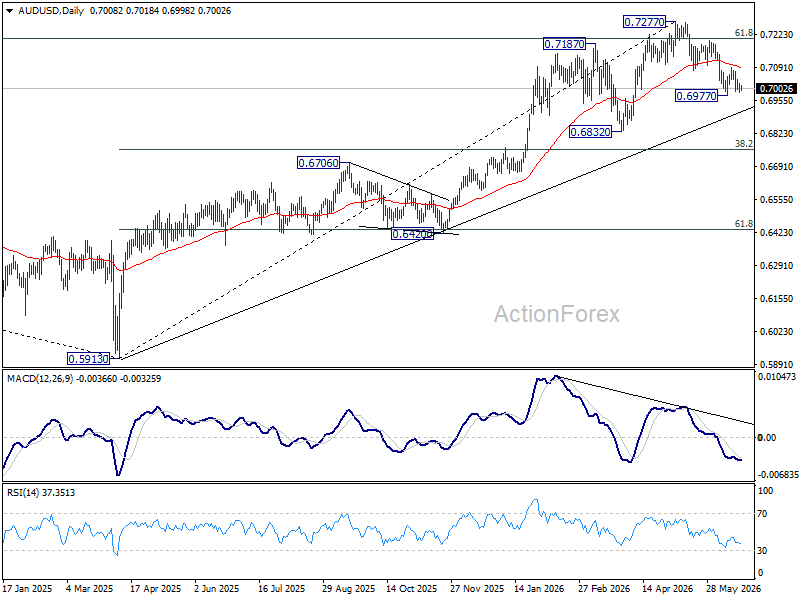
A hotter-than-expected CPI report could trigger a bounce. But unless buyers can force a sustained break above the 55 D EMA, the burden of proof remains on the bulls. The bigger move may not come on Wednesday at all. It may come 24 hours later when the labor market verdict arrives.
On the downside, firm break of 0.6977 will extend the decline from 0.7277 to 0.6832 support or further to 38.2% retracement of 0.5913 to 0.7277 at 0.6756. If the pair breaks decisively above the 55 D EMA, the correction from 0.7277 may already be over, opening the door for a return toward the highs.
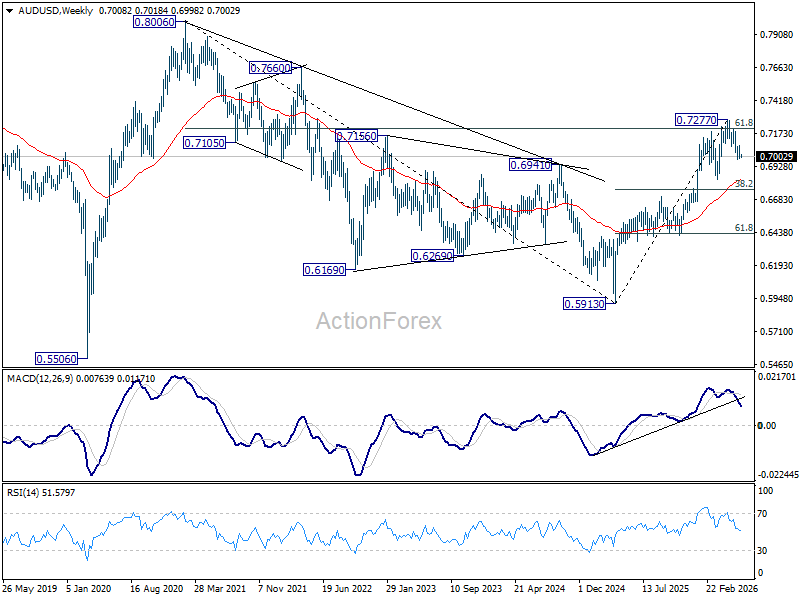
This week's CPI and employment reports could determine whether August brings one final hike—or confirms that the battle against inflation has entered a new phase. And for AUD/USD, the answer may decide the fate of 0.7000.
BoJ’s Himino Warns Against Delay as Inflation Risks Strengthen Rate Hike Case
BoJ Deputy Governor Ryozo Himino reinforced the central bank's hawkish stance on Monday, warning that delaying policy normalization could allow inflation risks to intensify. Speaking in parliament, Himino said that "delaying the necessary adjustment in the degree of monetary accommodation" could allow underlying inflation to rise above the Bank's 2% target, which "could weigh on economic activity later on." His comments suggest policymakers are concerned about the costs of acting too late rather than tightening too soon.
The remarks come just days after the BoJ raised interest rates to 1.00% and revised up its inflation assessment. Policymakers now expect elevated energy prices linked to the Middle East conflict to exert significant upward pressure on consumer prices. That outlook has led many economists to anticipate another rate increase before the end of the year, with September emerging as a plausible timing for the next move.
Political resistance to tighter policy also appears limited. Prime Minister Sanae Takaichi reiterated that the government expects the BoJ to "conduct appropriate monetary policy" while working closely with authorities to achieve the 2% inflation target in a sustainable manner. The comments were interpreted as an endorsement of last week's rate hike. Adding to the hawkish narrative, former BoJ board member Makoto Sakurai said on Friday that the central bank could raise rates twice more by the end of the current fiscal year as inflation risks continue to build.