Sample Category Title
China Holds Loan Prime Rates Steady as Weak Credit Demand Limits Case for Easing
China kept its benchmark lending rates unchanged for a 13th consecutive month in June, reinforcing expectations that policymakers are not yet prepared to deliver another round of monetary easing. The one-year loan prime rate (LPR) was held at 3.00%, while the five-year LPR, the reference rate for mortgages, remained at 3.50%.
The decision reflects Beijing's view that the economy's main challenge is not a lack of liquidity but weak borrowing appetite among households and businesses. Despite an accommodative monetary stance, credit demand has struggled to gain sustained momentum, limiting the effectiveness of additional rate cuts as a tool to stimulate activity.
Looking ahead, the policy focus is likely to shift increasingly toward fiscal support rather than further monetary easing. Unless incoming data point to growth slipping meaningfully below the government's 4.5%-5.0% target range, authorities are expected to favor targeted and incremental measures. Under this scenario, the PBOC is likely to maintain ample liquidity conditions while keeping benchmark rates unchanged through the second half of the year.
EUR/USD Finds Relief, but Gains May Be Narrow
Key Highlights
- EUR/USD extended losses and tested the 1.1420 support.
- A few hurdles are forming near 1.1500 and 1.1525 on the 4-hour chart.
- GBP/USD moved into a negative zone below 1.3300.
- Gold prices struggled near $4,380 and trimmed most gains.
EUR/USD Technical Analysis
The Euro faced an increase in selling below 1.1550 against the US Dollar. EUR/USD dived below 1.1520 and 1.1500 before the bulls appeared.
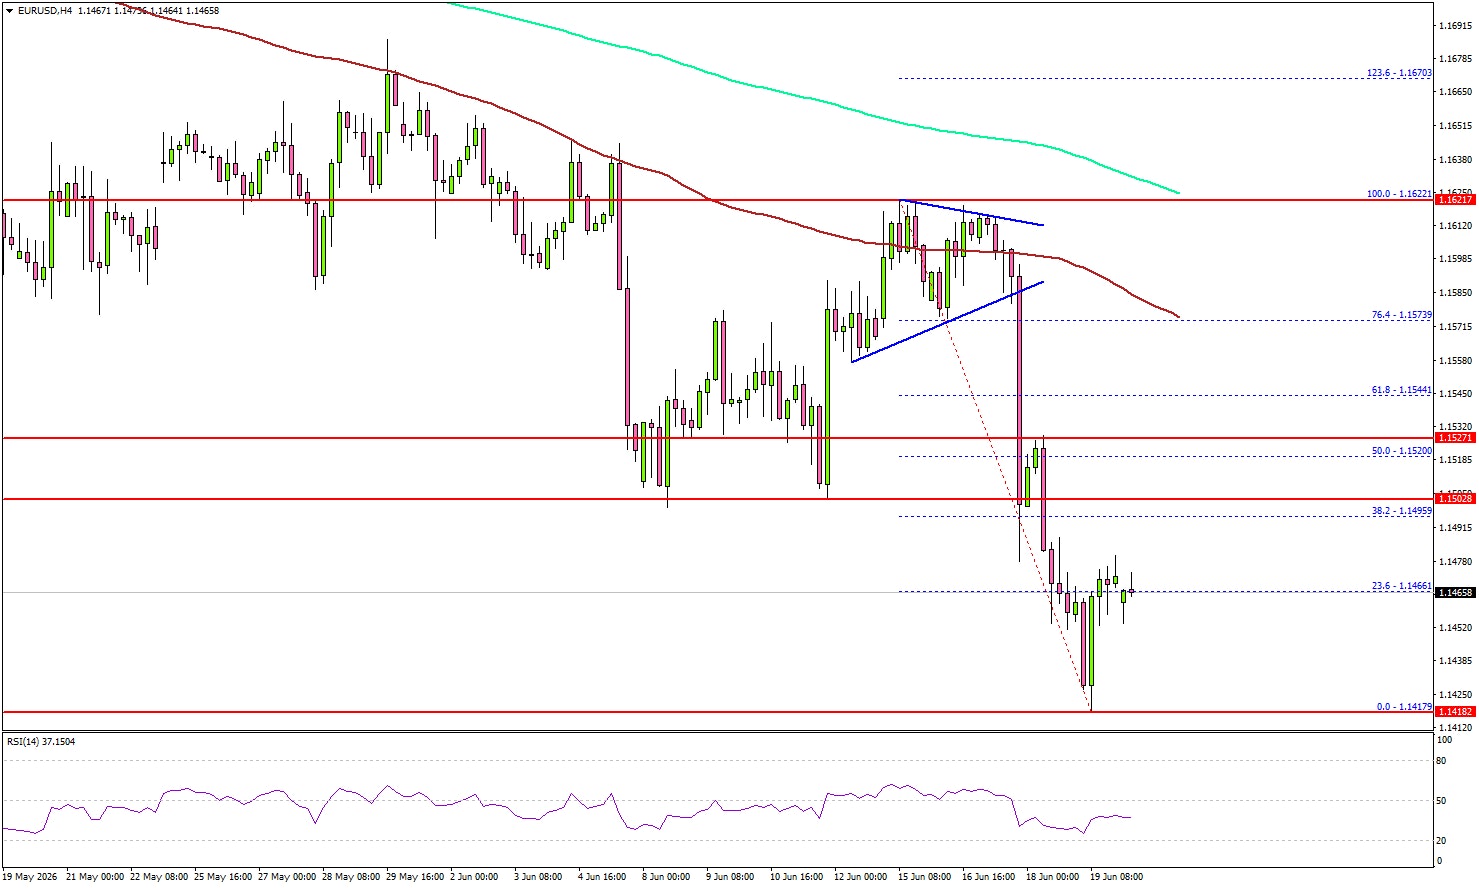
Looking at the 4-hour chart, the pair settled below 1.1500, the 100 simple moving average (red, 4-hour), and the 200 simple moving average (green, 4-hour). A low was formed at 1.1471, and the pair started a minor recovery wave.
The pair surpassed the 23.6% Fib retracement level of the downward move from the 1.1622 swing high to the 1.1417 low. If the pair continues to recover, it could face resistance near the 1.1500 handle.
The next major resistance could be 1.1525 or the 50% Fib retracement level of the downward move from the 1.1622 swing high to the 1.1417 low. A close above 1.1525 could open the doors for a larger increase. In the stated case, EUR/USD might aim for a test of 1.1580.
If there is a fresh decline, the pair might find support near 1.1420. The first major support could be near 1.1400. A downside break and close below 1.1400 might spark bearish moves. The main support could be near 1.1365, below which the bears could aim for a test of 1.1250.
Looking at Gold, the price failed to surpass $4,380, reacted to the downside, and might soon revisit the $4,000 support.
Upcoming Key Economic Events:
- Euro Zone Consumer Confidence for June 2026 (Preliminary) – Forecast -18.0, versus -19.0 previous.
- ECB's President Lagarde speech.
- Fed's Waller speech.
USD/JPY Breaks Above 161 After FOMC While Wti Crude Oil Falls
Before weekly trading began, markets reacted to the announcement that the U.S. and Iran had reached a framework deal to end the conflict. The reopening of the Strait of Hormuz and the easing of sanctions, allowing Iran to resume oil exports, pushed WTI sharply lower at the start of the week and helped lift equity markets.
The most important event of the week was the first FOMC meeting chaired by new Fed Chairman Kevin Warsh. His comments were seen as leaning toward the possibility of raising interest rates faster than previously expected. This pressured U.S. stocks and pushed USD/JPY above 161, with the pair closing at its highest weekly level since 1986. U.S. economic data also remained strong, with retail sales beating expectations.
In Japan, the Bank of Japan raised its policy rate to 1%, as expected, marking the highest level since 1995. Because the move was already priced in, it had limited impact on USD/JPY. Japanese equities performed strongly, with the Nikkei gaining nearly 7% for the week. Elsewhere, the Bank of England kept its base rate unchanged at 3.75%, while the Reserve Bank of Australia also left rates on hold.
Markets This Week
U.S. Stocks
The Dow reached a new record high as lower WTI crude prices supported risk sentiment, but it finished the week with only modest gains after the FOMC comments suggested U.S. interest rates may rise faster than markets had expected. With the U.S.-Iran conflict moving closer to a resolution, the market may now need fresh positive news to keep the uptrend going. This week, looking for selling opportunities may be the better approach if the Dow rises well above the 10-day moving average or breaks below it. Resistance levels are at 52,000 and 52,500. Support is seen at 51,000, 50,000, 49,500, 49,000 and 48,500.
Japanese Stocks
It was a very positive week for Japanese stocks, with the Nikkei surging to a new record high. The initial rally was supported by the sharp fall in WTI crude prices at the start of the week, while USD/JPY moving above 161 after the FOMC meeting, with no sign of intervention, helped push the index above 70,000. The Bank of Japan’s rate hike to 1% was widely expected and had limited market impact. In the short term, the market looks overbought, so weakness could create short-term selling opportunities. However, for medium-term traders, buying on pullbacks may remain the better approach while the uptrend stays intact. Resistance is seen at 72,000, 73,000, 74,000 and 75,000, while support is at 70,000, 68,750, 68,000, 66,500 and 65,000.
USD/JPY
USD/JPY rose to new highs for the year and moved close to the highs from 2024. The Bank of Japan raised interest rates to 1% as expected, but this had little impact on the yen. After the FOMC meeting, comments from the new Fed Chairman suggested U.S. interest rates could rise faster than expected, pushing USD/JPY sharply higher. This week, traders will be watching for possible intervention from Japan. For now, the uptrend remains strong, but trading may stay nervous at these high levels. Resistance is at 162.00 and 165.00, while support is seen at 160.50, 160.00, 159.00, 158.00, 157.00, 156.00, 155.50 and 155.00.
Gold
Gold started the week higher as the drop in WTI crude oil was seen as reducing inflation pressure and weakening U.S. interest rate expectations. However, the move did not last, and sellers returned after the FOMC meeting as traders raised expectations for higher U.S. interest rates. Gold closed back below the 10-day moving average, keeping both the technical and fundamental outlook negative. A test of the $4,000 support area could be possible in the coming weeks. Resistance is at $4,300, $4,400, $4,500, $4,600 and $4,665, while support is at $4,100, $4,000, and $3,900.
Crude Oil
WTI crude oil started the week sharply lower after the weekend announcement that Middle East crude supplies would resume. Prices remained under pressure throughout the week as news around the negotiations stayed broadly positive. With supply concerns easing and the short-term trend still weak, selling into strength remains the preferred strategy for now. Resistance is at $85, $90, $95 and $100, while support is at $75, $70, and $67.50.
Bitcoin
Bitcoin moved higher at the start of the week as lower crude oil prices improved risk sentiment. However, resistance held, and sellers returned after the FOMC meeting as expectations for higher U.S. interest rates increased. Traders continue to prefer other markets for speculative opportunities, leaving Bitcoin under pressure. With technical indicators now turning more sideways, range trading between $60,000 and $67,500 may be the better approach this week. Resistance is at $67,500, $75,000, $80,000, $85,000, and $90,000, while support is at $60,000, $55,000 and $50,000.
This Week’s Focus
- Monday: E.U. ECB President Lagarde Speaks
- Tuesday: Japan S&P Global Services PMI and BoJ Core CPI, E.U. HCOB Eurozone Manufacturing PMI, U.K. S&P Global Manufacturing PMI, U.S. S&P Global Manufacturing PMI
- Wednesday: Australia Trimmed Mean CPI, U.S. Current Account, Building Permits and New Home Sales
- Thursday: Australia Unemployment Rate, U.S. Core PCE Price Index, GDP and Durable Goods
- Friday: Japan Tokyo Core CPI, U.S. Michigan Consumer Sentiment
Global interest rate expectations are likely to remain the main focus this week as markets adjust to the possibility that inflation may stay higher for longer. With the yen still under heavy pressure, traders will also be watching closely for any signs of possible intervention from Japanese authorities. The key economic releases will come on Thursday, with U.S. Core PCE Price Index, GDP and Durable Goods data all likely to influence expectations for the Fed’s next move.
EURUSD Wave Analysis
EURUSD: ⬆️ Buy
– EURUSD reversed from support zone
– Likely to rise to resistance level 1.1500
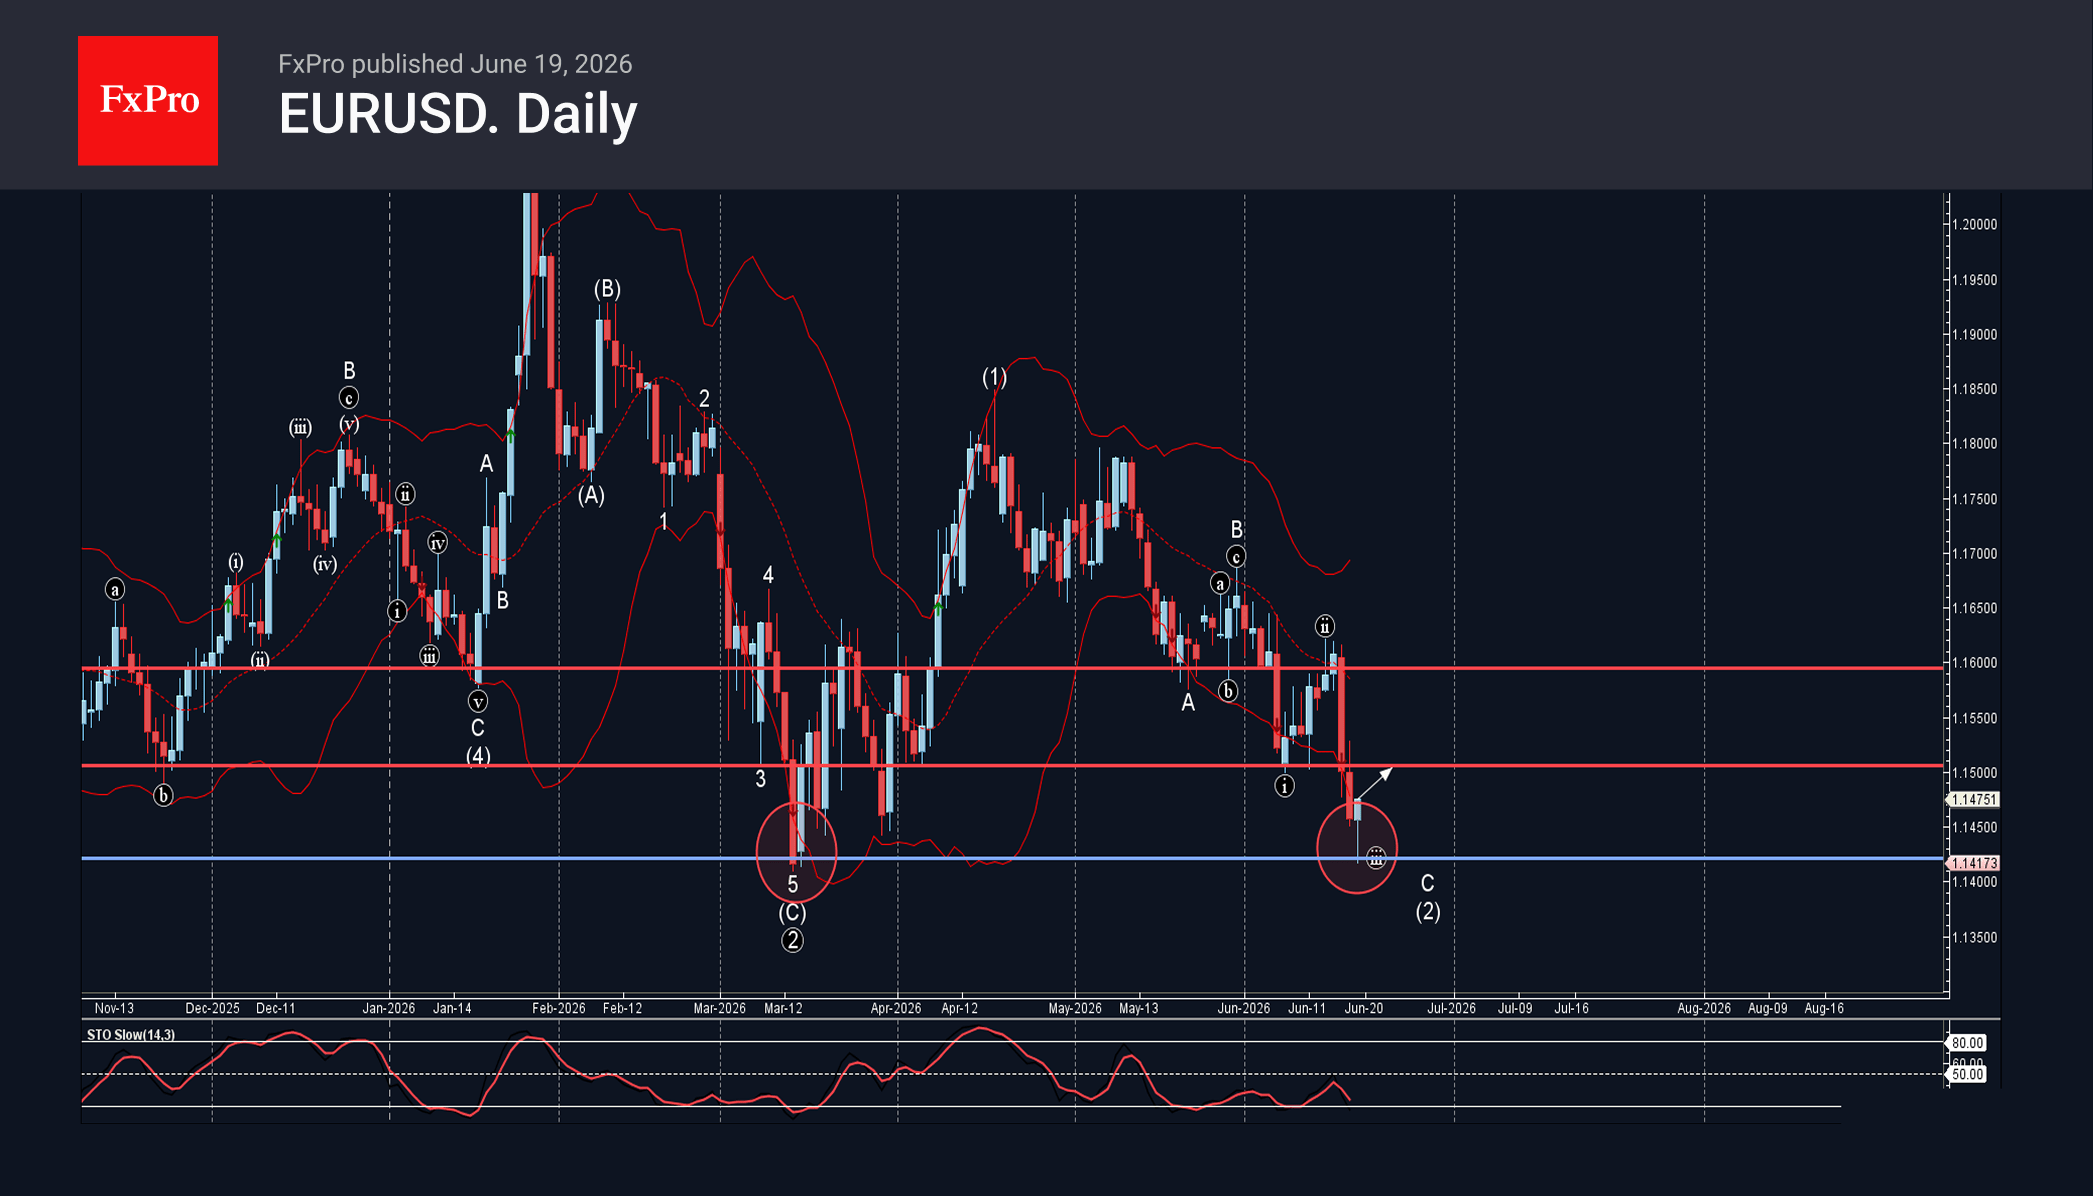
EURUSD currency pair recently reversed from the support zone between the strong support level 1.1420 (former strong support from March) and the lower daily Bollinger Band.
The upward reversal from the support level 1.1420 stopped the C-wave of the previous ABC correction (2) from April.
Given the strength of the support level 1.1420, EURUSD can be expected to rise to the next resistance level 1.1500 (former support which stopped the previous impulse wave i).
Eco Data 6/22/26
| GMT | Ccy | Events | Act | Cons | Prev | Rev |
|---|---|---|---|---|---|---|
| 01:15 | CNY | 1-Y Loan Prime Rate | 3.00% | 3.00% | 3.00% | |
| 01:15 | CNY | 5-Y Loan Prime Rate | 3.50% | 3.50% | 3.50% | |
| 12:30 | CAD | CPI M/M May | 1.00% | 0.70% | 0.40% | |
| 12:30 | CAD | CPI Y/Y May | 3.20% | 3.00% | 2.80% | |
| 12:30 | CAD | CPI Median Y/Y May | 2.10% | 2.10% | 2.10% | |
| 12:30 | CAD | CPI Trimmed Y/Y May | 2.00% | 2.00% | 2.00% | |
| 12:30 | CAD | CPI Common Y/Y May | 2.70% | 2.50% | 2.50% | |
| 14:00 | EUR | Eurozone Consumer Confidence Jun P | -18 | -18 | -19 |
| 01:15 | CNY |
| 1-Y Loan Prime Rate | |
| Actual | 3.00% |
| Consensus | 3.00% |
| Previous | 3.00% |
| 01:15 | CNY |
| 5-Y Loan Prime Rate | |
| Actual | 3.50% |
| Consensus | 3.50% |
| Previous | 3.50% |
| 12:30 | CAD |
| CPI M/M May | |
| Actual | 1.00% |
| Consensus | 0.70% |
| Previous | 0.40% |
| 12:30 | CAD |
| CPI Y/Y May | |
| Actual | 3.20% |
| Consensus | 3.00% |
| Previous | 2.80% |
| 12:30 | CAD |
| CPI Median Y/Y May | |
| Actual | 2.10% |
| Consensus | 2.10% |
| Previous | 2.10% |
| 12:30 | CAD |
| CPI Trimmed Y/Y May | |
| Actual | 2.00% |
| Consensus | 2.00% |
| Previous | 2.00% |
| 12:30 | CAD |
| CPI Common Y/Y May | |
| Actual | 2.70% |
| Consensus | 2.50% |
| Previous | 2.50% |
| 14:00 | EUR |
| Eurozone Consumer Confidence Jun P | |
| Actual | -18 |
| Consensus | -18 |
| Previous | -19 |
Dollar Rally Faces Defining Technical Test as Fed Repricing Reshapes Markets
A week that began with optimism over falling oil prices ended with markets fixated on the prospect of renewed Federal Reserve tightening. The peace dividend from the US-Iran agreement continued to push energy prices lower and helped support risk sentiment. But the bigger story was the Fed's abrupt shift toward a more hawkish outlook, which triggered a broad repricing across currencies, rates and equities.
The Fed's updated projections fundamentally altered market expectations. Policymakers now see interest rates ending the year above current levels, effectively signaling one additional hike as the baseline. More importantly, the distribution of projections revealed that a sizable minority of officials already favor two or more hikes. Investors quickly adjusted, pushing the probability of a September increase sharply higher and reviving discussions about whether the tightening cycle is truly over.
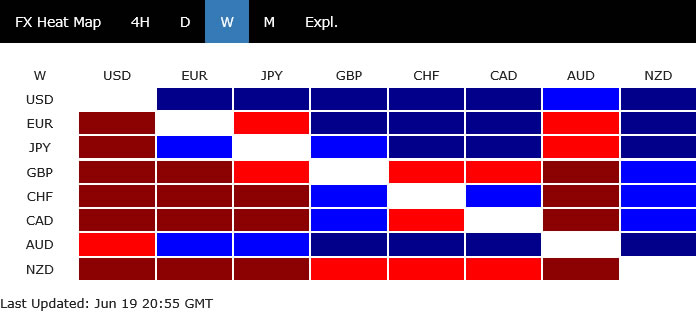
The consequences were visible across asset classes. Dollar strengthened broadly and now approaches a major long-term technical barrier that could determine its direction for the rest of the year. Treasury markets priced in higher short-term rates, while equity performance diverged. Dow Jones Industrial Average surged to fresh records as falling oil prices boosted traditional sectors, but NASDAQ and S&P 500 remained trapped in consolidation as technology stocks grappled with the prospect of tighter monetary policy. For the week, Dollar led all major currencies, while Kiwi and Sterling lagged as investors reassessed their respective central bank outlooks.
Fed Moves From Higher-for-Longer to Higher-Again
The defining market event of the week was not the Fed's decision to hold rates steady. It was the realization that the central bank is no longer merely arguing for higher-for-longer policy. Instead, it is increasingly preparing markets for the possibility of higher-again. Under Kevin Warsh's first meeting as Chair, the Federal Reserve delivered one of the most hawkish projection updates since the inflation shock began earlier this year.
The catalyst was a significant reassessment of inflation risks. Policymakers raised their 2026 core PCE inflation forecast to 3.6% from 2.7% previously, acknowledging that the energy shock triggered by the Middle East conflict would leave a more lasting imprint on prices than previously assumed. While growth projections were revised only modestly, inflation forecasts were pushed higher throughout the projection horizon, signaling growing concern that price pressures may prove more persistent than anticipated.
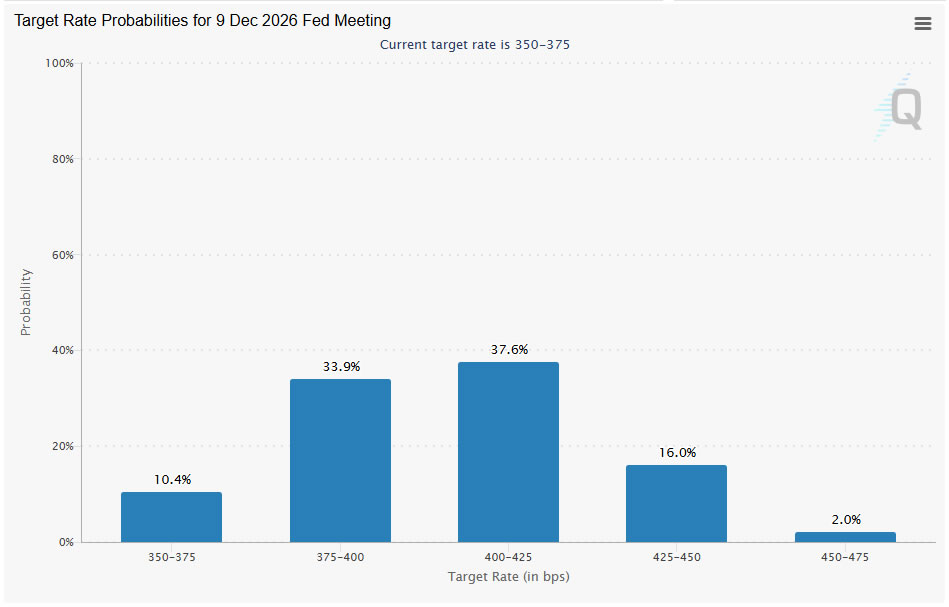
The headline takeaway was that the median federal funds rate projection now stands at 3.8% by year-end, implying one additional rate hike. Yet the more revealing story lies beneath the median. Nine officials now expect at least one increase this year, while six policymakers already see two or more hikes as appropriate. One official even projected three hikes. Meanwhile, Warsh refused to provide his dots. That distribution matters because it would take only a modest shift in the coming months for the median outlook to move from one hike to two, particularly if core CPI and PCE inflation remain elevated through the summer.
Markets have responded by aggressively repricing the path of US rates. Futures markets now see September as the most likely timing for the next move (74% chance), while expectations for a second hike have increased sharply. By December, investors assign nearly a 90% probability that rates are at least 25 basis points higher than today and more than a 55% probability of two hikes. The debate has shifted dramatically. Only a week ago, investors were still questioning whether the Fed would tighten again. Today, the question is whether one hike will be enough.
Two-Year Yield Says the Fed Isn't Done Yet
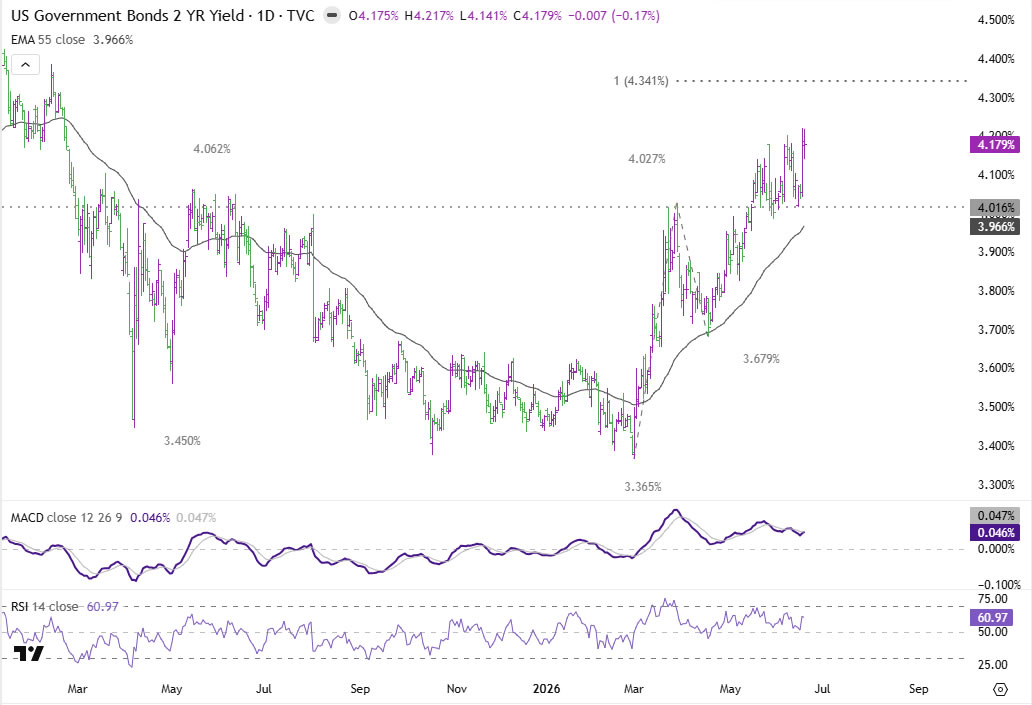
If the clearest message from the Federal Reserve came through the dot plot, the clearest confirmation came from the Treasury market. Investors wasted little time adjusting to the Fed's more hawkish outlook, driving two-year Treasury yields to their highest levels since February 2025. The move reflected a complete reversal of expectations that had dominated markets only months ago, when investors were still debating how many rate cuts might be delivered this year.
What makes the move particularly noteworthy is that it was concentrated at the front end of the curve. While two-year yields surged, the benchmark 10-year yield ended the week little changed around 4.45%. That divergence suggests markets are not pricing a loss of inflation control. Rather, investors are pricing a Federal Reserve that will keep rates elevated for longer and potentially raise them again if inflation remains stubborn. The message is straightforward: tighter policy, not runaway inflation.
The two-year yield is often viewed as the purest market expression of Fed expectations over the next several quarters. Its rise reflects the reality that traders have had to completely abandon hopes for near-term easing and aggressively price the possibility of multiple hikes. The shift mirrors developments in futures markets, where September has become the favored timing for the next move and the probability of two hikes by year-end has risen sharply.
Technically, near term outlook in 2-year yield outlook remains firmly bullish as long as 4.016 support holds. The next target comes at 100% projection of 3.365 to 4.027 from 3.679 at 4.341. There are two aspects to monitor closely. First is whether the current rally accelerates as yields approach fresh highs. Second is the market's reaction at the 4.341 projection target. Strong momentum into and through that level would indicate growing confidence that the Fed may ultimately need to tighten more aggressively than currently projected.
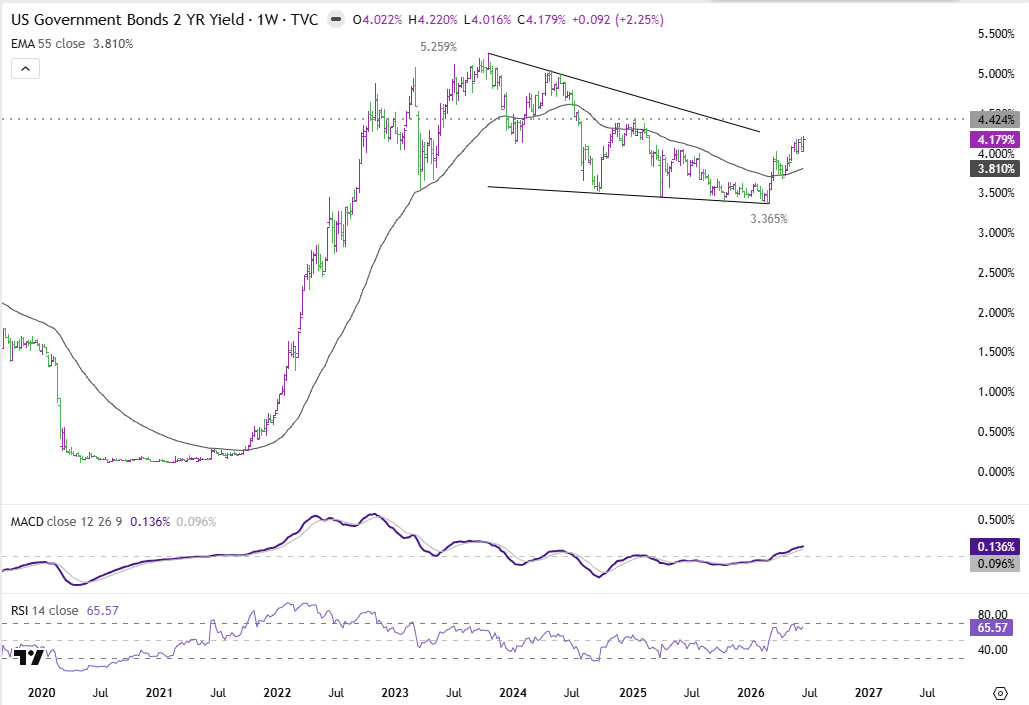
The bigger picture may be even more important. The corrective pattern from 5.259 (2023 high) may have already completed as a triangle at 3.365. The catalyst for the reversal was arguably the March oil shock triggered by the US-Iran conflict, which forced investors to reassess the inflation outlook and ultimately set the stage for the Fed's hawkish pivot.
Structurally, the key level to watch is 4.424, the January 2025 high. If that resistance caps the current rally, the market would effectively be signaling that the Fed is merely reversing the rate cuts delivered during 2025. In that scenario, the repricing remains a contained cyclical adjustment, with the longer-term terminal rate still anchored around the 3.75%-4.00% area.
However, a decisive break above 4.424 would carry much larger implications. It would suggest investors are no longer simply pricing the reversal of last year's easing cycle, but are beginning to question whether the entire policy-loosening phase since mid-2024 was a mistake. Such a move would mark a shift from a temporary inflation shock to a full-fledged macro regime change, where structurally higher inflation forces the Fed to maintain materially tighter policy for years rather than quarters. That is the line separating a hawkish adjustment from a genuine higher-rate era.
Dollar's Biggest Test Since 2025 Has Arrived
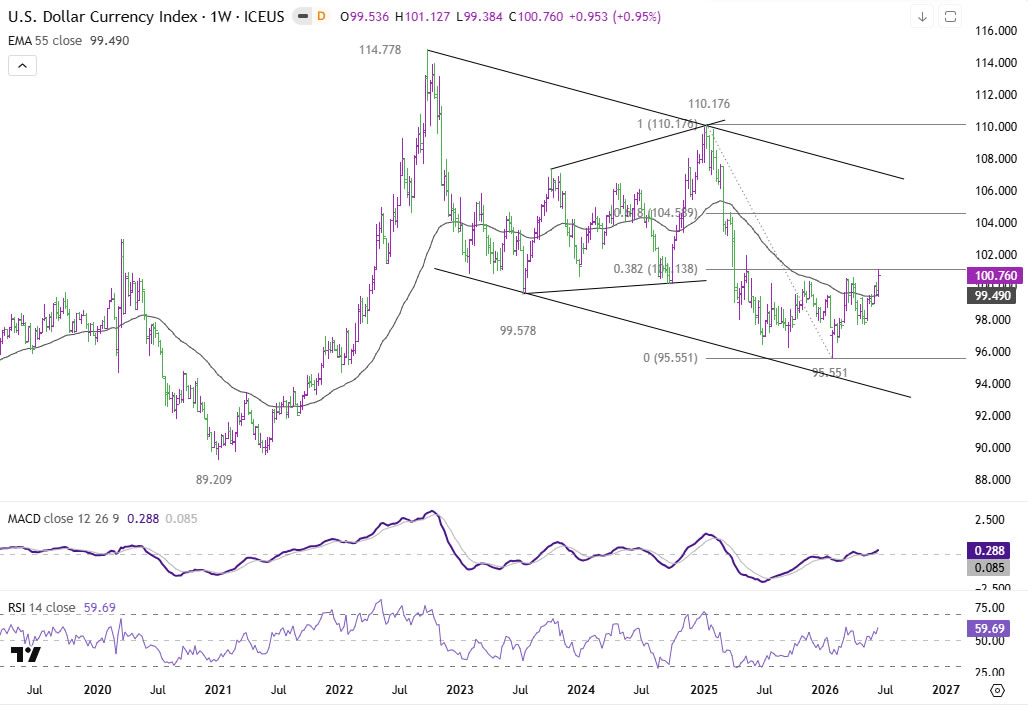
Dollar Index surged sharply following the Fed meeting and reached 101.12 before settling back slightly into the weekly close. The rally carried the index almost exactly to 38.2% retracement of 110.17 to 95.55 at 101.13. This is no ordinary resistance. It is a level that could determine whether the Dollar's recovery develops into a broader medium-term uptrend.
Technically, the near-term picture remains bullish as long as 99.38 support holds. Firm break above 101.13 would confirm bullish continuation and target 100% projection of 95.55 to 100.64 from 97.62 at 102.71 next.
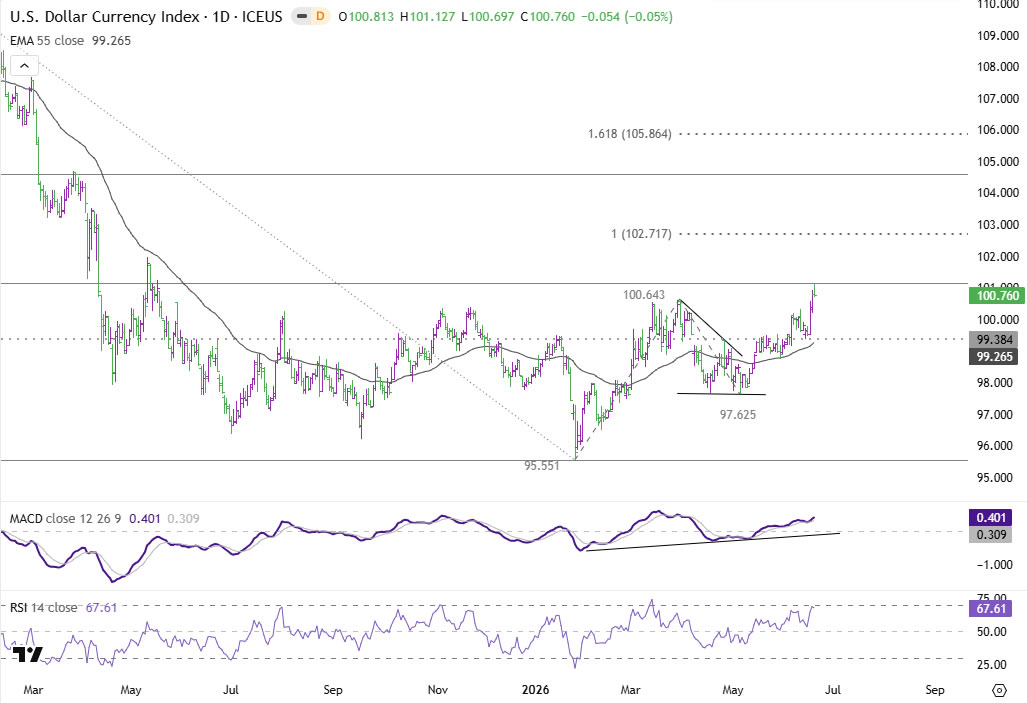
More importantly, it would strengthen the case that the rise from 95.55 is reversing the broader down trend from 110.17 (2025 high). That would set up further rise to 61.8% retracement at 104.58, or even further to long term falling channel ceiling (now at around 107).
Dollar Faces Tug-of-War Between Fed and Risk Appetite
A traditional headwind for the Dollar would be the return of strong risk appetite following the collapse in oil prices and the gradual normalization of shipping through the Strait of Hormuz. Historically, falling energy prices, improving global trade conditions and rising equity markets tend to encourage investors to move away from safe-haven assets and into higher-yielding or growth-sensitive currencies.
This cycle, however, may be more complicated. A strong stock market is not necessarily bearish for the Dollar if it reflects improving earnings prospects and stronger economic growth. Lower energy costs effectively boost household purchasing power and corporate profitability. As supply chains normalize and transportation costs fall, businesses gain confidence to invest while consumers increase spending. A stock market reaching record highs under such conditions could reinforce rather than weaken the underlying strength of the US economy.
That creates an unusual policy dilemma for the Federal Reserve. If geopolitical relief accelerates an economy that is already expanding at a solid pace, the output gap could narrow further and labor-market pressures could intensify. At that point, the Fed's challenge would no longer be balancing growth against inflation. Instead, the focus would shift toward preventing stronger demand from triggering a second wave of core inflation, particularly in the services sector. Such an outcome would strengthen the case for additional tightening and provide ongoing support for the Dollar.
For now, the greenback appears caught in a tug-of-war between improving risk sentiment and rising Fed expectations. The deciding factor over the coming months is likely to be domestic services inflation. If falling oil prices pull headline inflation lower but services inflation remains stubbornly elevated, markets may conclude that the Fed needs to stay hawkish despite the improving geopolitical backdrop. In that scenario, the Dollar could continue to strengthen even as global risk assets perform well.
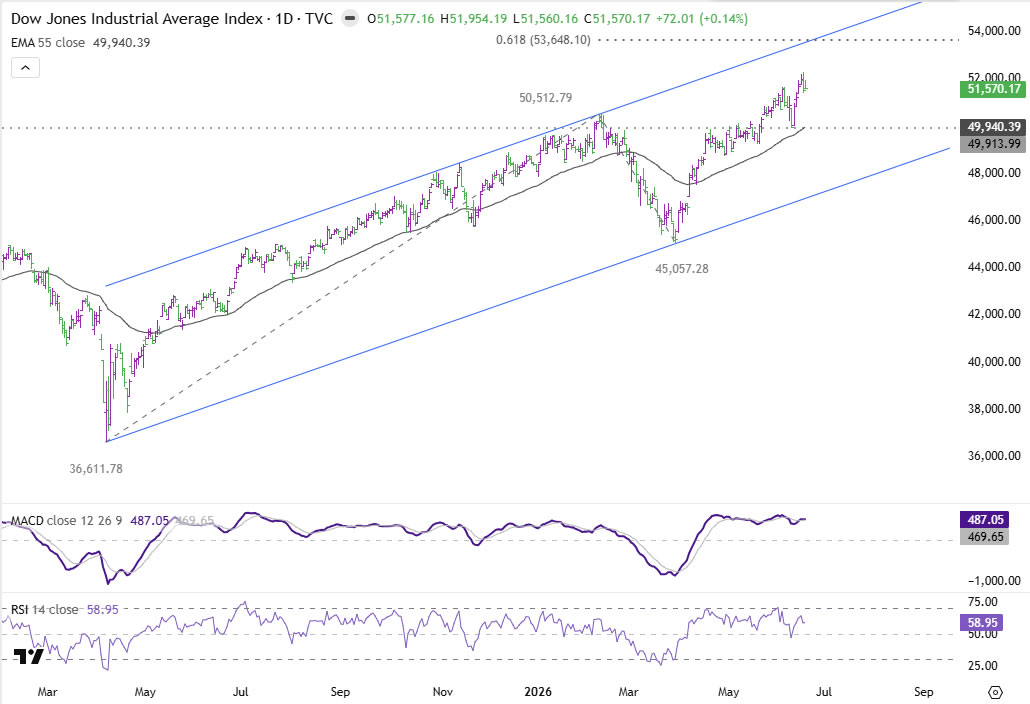
Technically, DOW's up trend resumed last week and hit a near record high. While some consolidations might be seen in the near term, outlook will stay bullish as long as 49,940 support holds. Next target is 61.8% projection of 36,611 to 50,512 from 45,057 at 53,648.
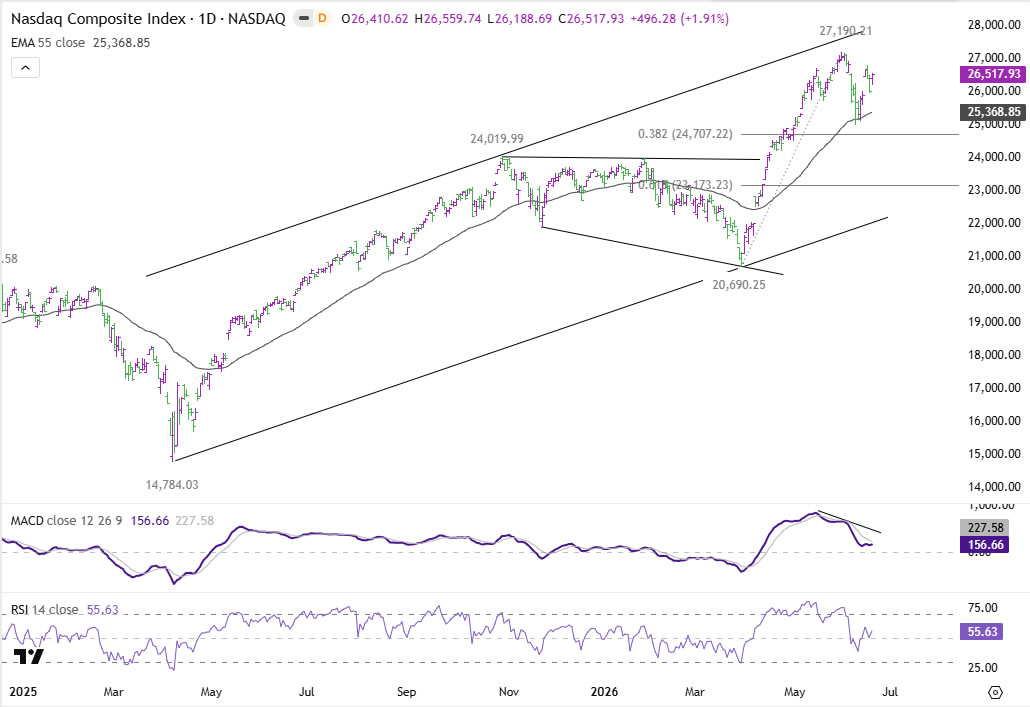
While NASDAQ did rebound last week, upside is capped well below 27,190 record high. Near term outlook remains neutral for more consolidations first. Though, in case of another fall, downside should be contained by 38.2% retracement of 20,690 to 27,190 at 24,707. Break of 27,190 to resume the larger up trend is still expected, but later.
EUR/USD Weekly Outlook
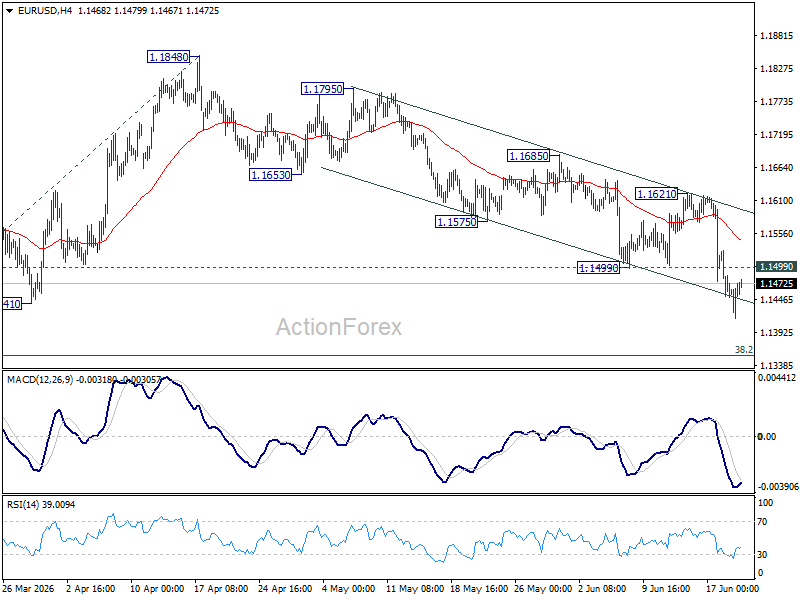
Immediate focus is now on 1.1408 support in EUR/USD after last week's decline. Firm break there will resume whole fall from 1.2081 and target 100% projection of 1.2081 to 1.1408 from 1.1848 at 1.1175. On the upside, above 1.1499 support turned resistance will turn intraday bias neutral again first. However, outlook will remain mildly bearish as long as 1.1621 resistance holds, in case of recovery.
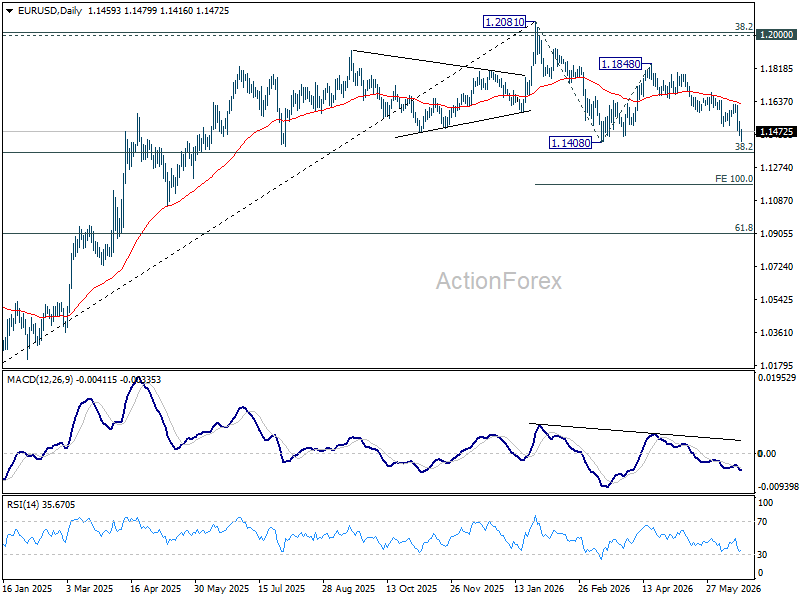
In the bigger picture, focus is back on 38.2% retracement of 1.0176 to 1.2081 at 1.1353. Decisive break there will revive the case of medium term bearish trend reversal after rejection by 1.2 key cluster resistance level. Further fall should be seen to 61.8% retracement at 1.0904. Nevertheless, strong rebound from 1.1353, followed by break of 1.1621 resistance, will retain medium term bullishness.
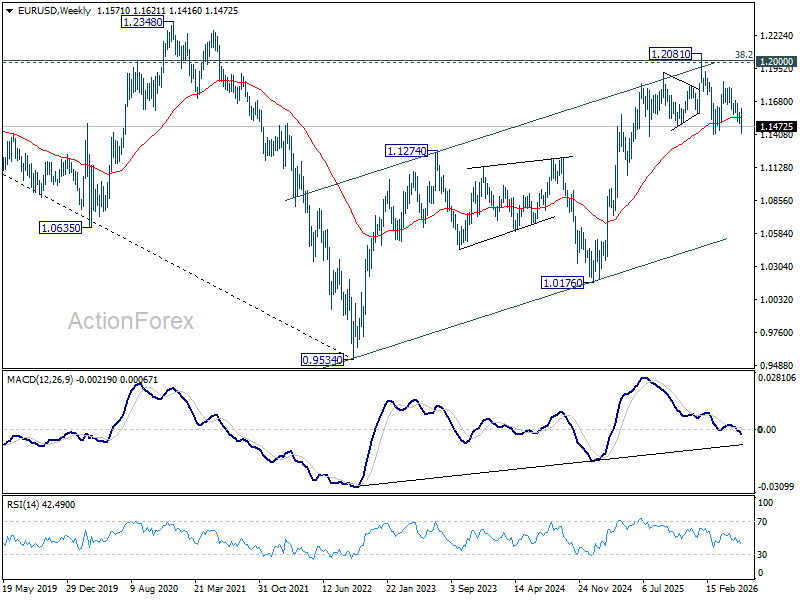
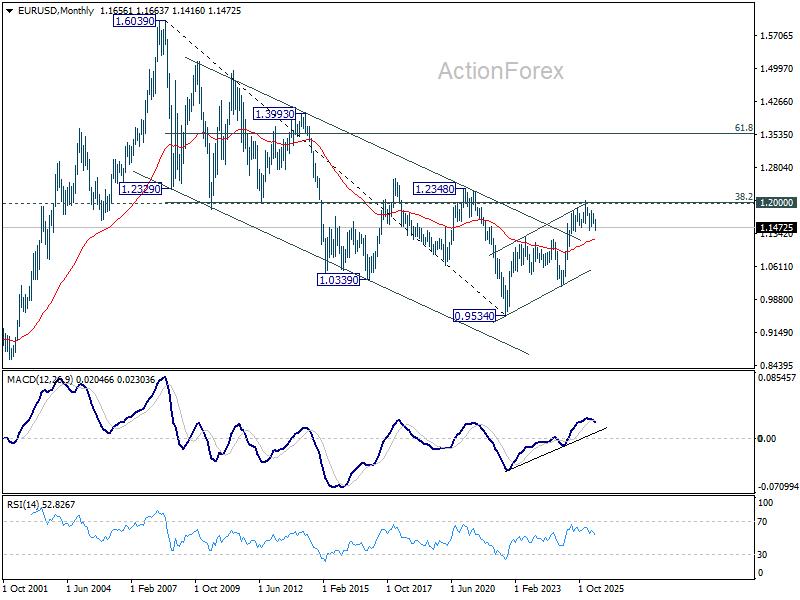
In the long term picture, 38.2% retracement of 1.6039 to 0.9534 at 1.2019, which is close to 1.2000 psychological level is the key for the outlook. Rejection by this level will keep the multi decade down trend from 1.6039 (2008 high) intact, and keep outlook neutral at best. However, decisive break of 1.2000/19, will suggest long term bullish trend reversal, and target 61.8% retracement at 1.3554.
EUR/USD Weekly Outlook
Immediate focus is now on 1.1408 support in EUR/USD after last week's decline. Firm break there will resume whole fall from 1.2081 and target 100% projection of 1.2081 to 1.1408 from 1.1848 at 1.1175. On the upside, above 1.1499 support turned resistance will turn intraday bias neutral again first. However, outlook will remain mildly bearish as long as 1.1621 resistance holds, in case of recovery.
In the bigger picture, focus is back on 38.2% retracement of 1.0176 to 1.2081 at 1.1353. Decisive break there will revive the case of medium term bearish trend reversal after rejection by 1.2 key cluster resistance level. Further fall should be seen to 61.8% retracement at 1.0904. Nevertheless, strong rebound from 1.1353, followed by break of 1.1621 resistance, will retain medium term bullishness.
In the long term picture, 38.2% retracement of 1.6039 to 0.9534 at 1.2019, which is close to 1.2000 psychological level is the key for the outlook. Rejection by this level will keep the multi decade down trend from 1.6039 (2008 high) intact, and keep outlook neutral at best. However, decisive break of 1.2000/19, will suggest long term bullish trend reversal, and target 61.8% retracement at 1.3554.
USD/JPY Weekly Outlook
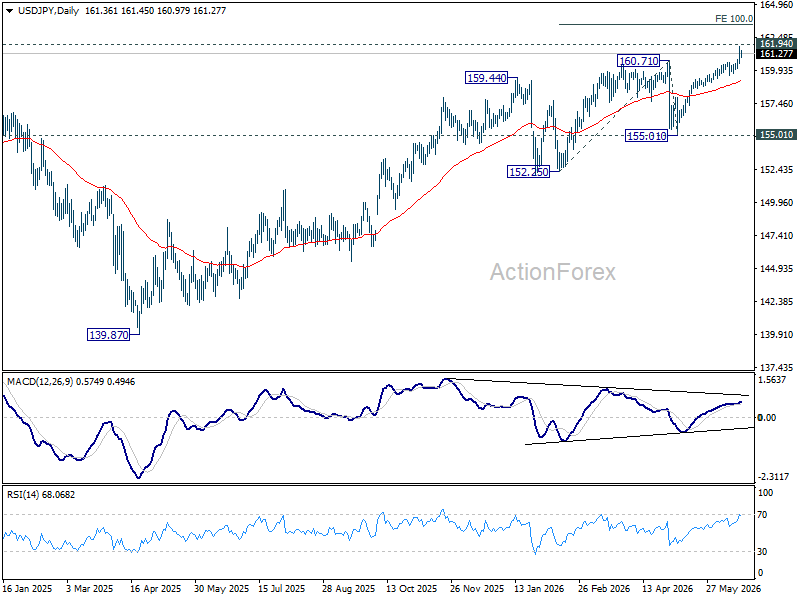
USD/JPY's rise from 139.87 resumed by breaking through 160.71 last week. Initial bias stays on the upside this week for 161.94 high first. Firm break there will target 100% projection of 152.25 to 160.71 from 155.01 at 163.47 next. On the downside, break of 160.58 minor support will turn intraday bias neutral first.
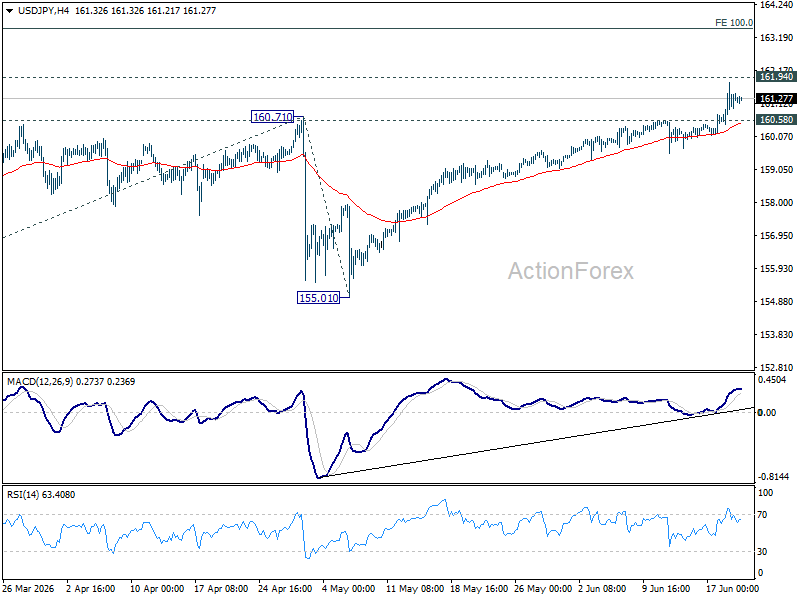
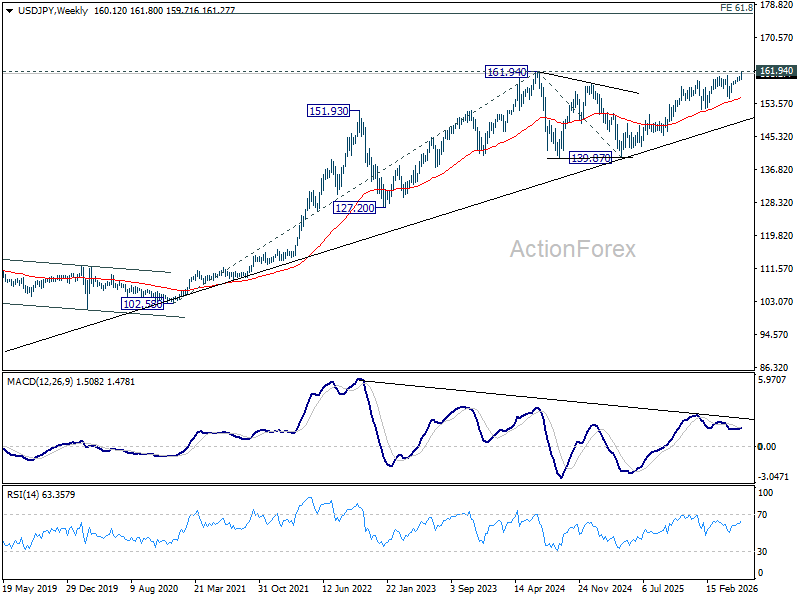
In the bigger picture, for now, corrective pattern from 161.94 (2024 high) is still seen as completed at 139.87. Rise from there is seen as resuming the long term up trend. This will remain the favored case as long as 55 W EMA (now at 155.17) holds.
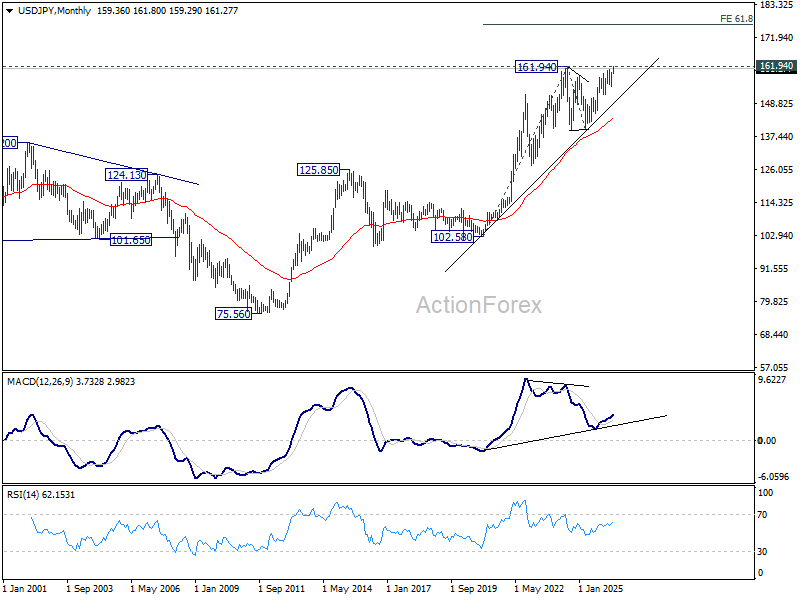
In the long term picture, up trend from 75.56 (2011 low) is still in progress and might be ready to resume. Firm break of 161.94 will target 61.8% projection of 102.58 (2020 low) to 161.94 (2024 high) from 139.87 at 176.55 in the medium term. Long term outlook will stay bullish as long as 139.87 support holds, even in case of deep pullback.
GBP/USD Weekly Outlook
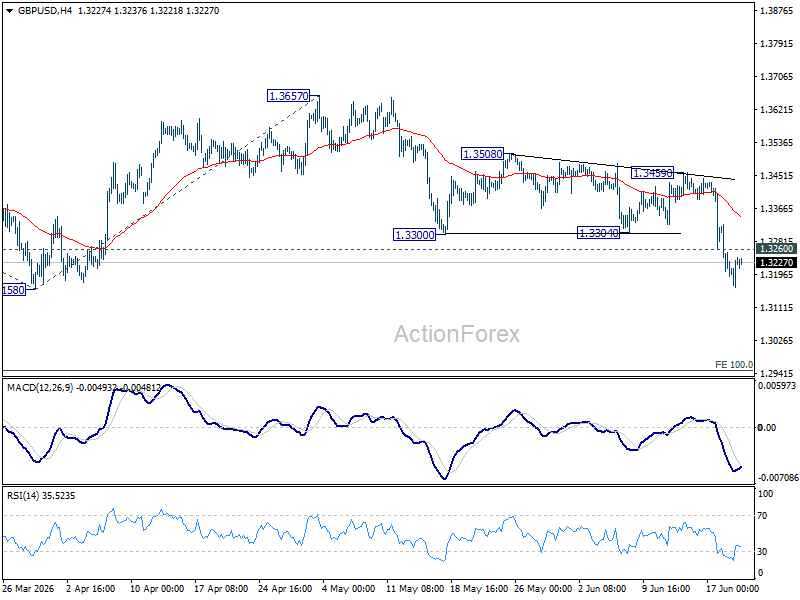
With last week's extended decline, immediate focus in GBP/USD is now on 1.3158 support. Decisive break there will resume whole fall from 1.3867 to 100% projection of 1.3867 to 1.3158 from 1.3657 at 1.2948. On the upside, above 1.3260 minor resistance will turn intraday bias neutral and bring consolidations first, before staging another fall.
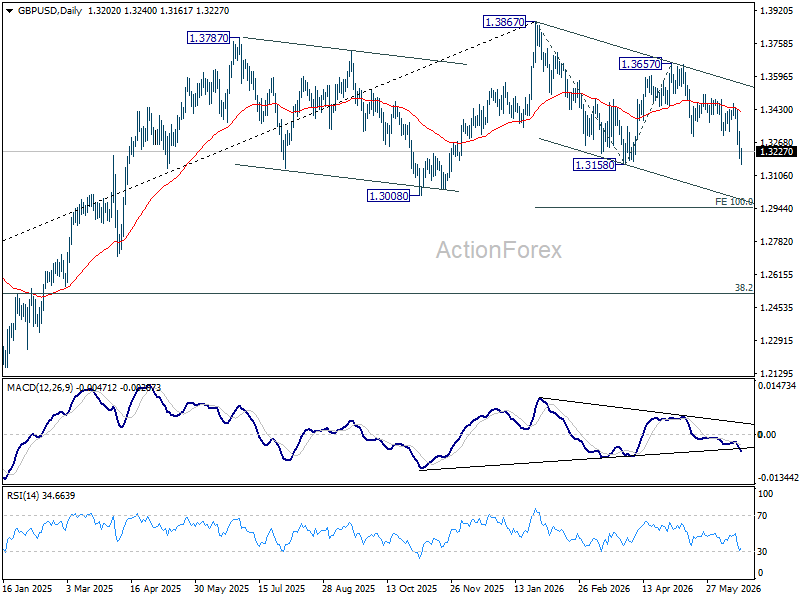
In the bigger picture, price actions from 1.3867 are a corrective pattern within the broader up trend from 1.0351 (2022 low). With 1.3008 support intact, medium term bullishness is maintained and break of 1.3867 is in favor for a later stage, towards 1.4248 key resistance (2021 high). However, firm break of 1.3008 will at least bring deeper fall to 38.2% retracement of 1.0351 to 1.3867 at 1.2524, with increased risk of bearish reversal.
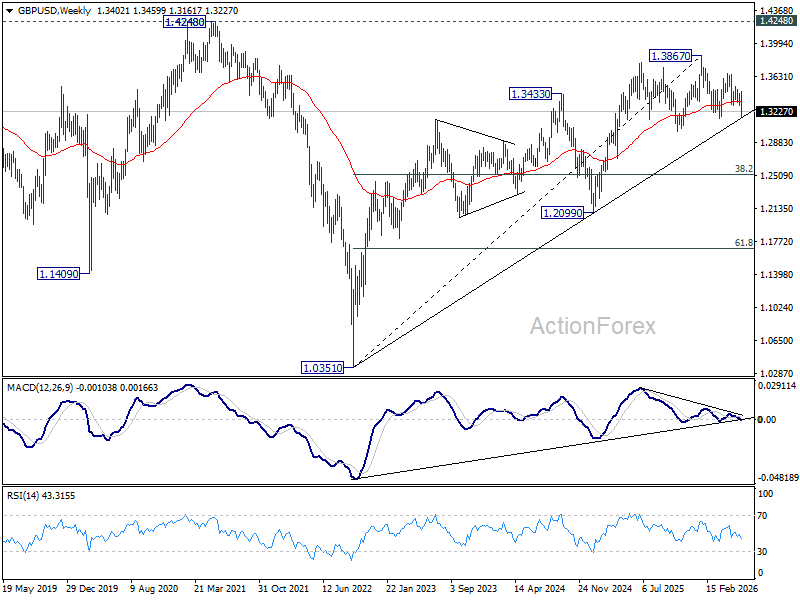
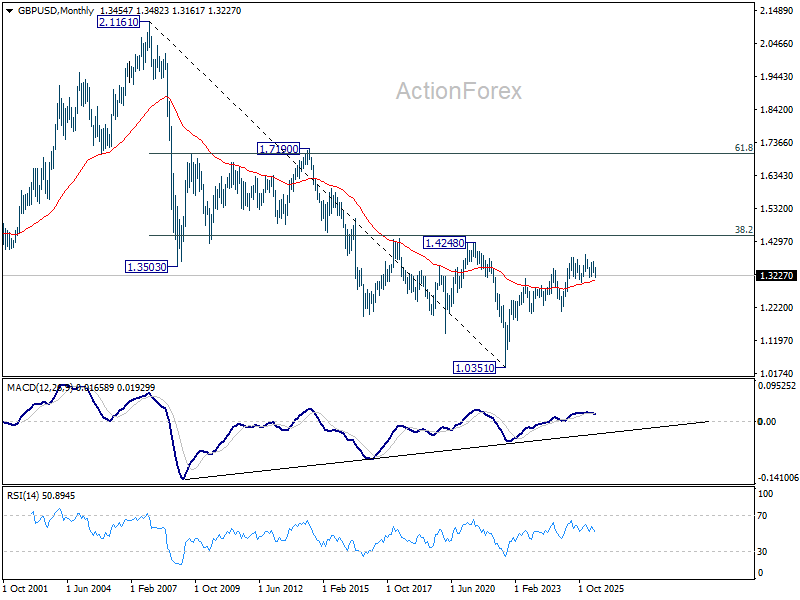
In the long term picture, as long as 1.4248/4480 resistance zone holds (38.2% retracement of 2.1161 to 1.0351 at 1.4480), the long term outlook will remain bearish. That is, price actions from 1.0351 are seen as a corrective pattern to down trend from 2.1161 (2007 high) only. Nevertheless, decisive break of 1.4248/4480 will be a strong sign of long term bullish reversal.
USD/CHF Weekly Outlook
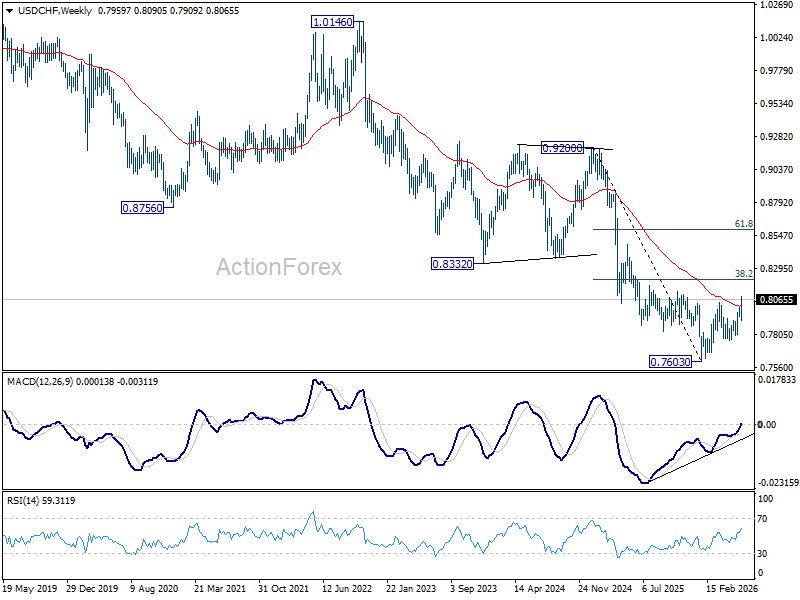
USD/CHF's strong rise and break of 0.8041 resistance last week confirmed resumption of whole rally from 0.7603. Initial bias stays on the upside this week for 100% projection 0.7603 to 0.8041 from 0.7600 at 0.8198 next. On the downside, below 0.8012 resistance turned support will turn intraday bias neutral and bring consolidations first before staging another rise.
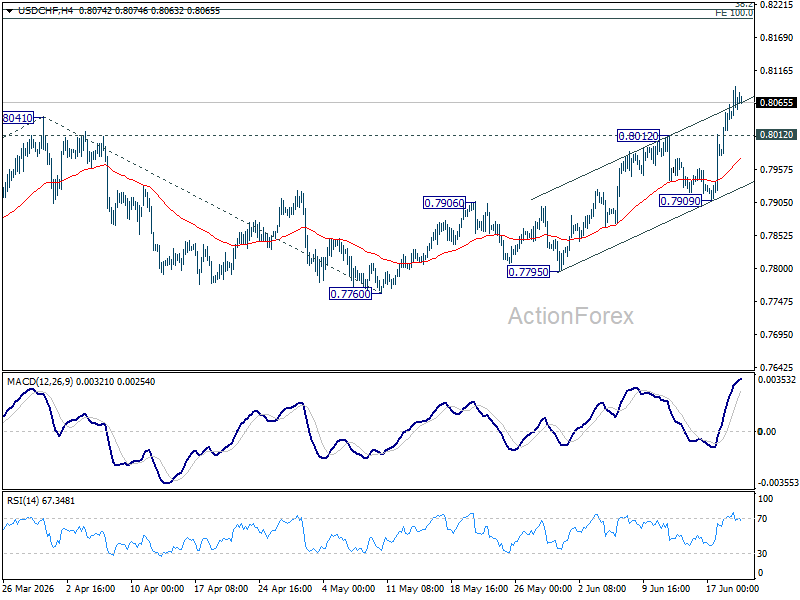
In the bigger picture, while a medium term bottom was formed at 0.7603, it's still early to call for bullish trend reversal. As long as 38.2% retracement of 0.9200 (2025 high) to 0.7603 at 0.8213 holds, the larger down trend could still continue through 0.7603 at a later stage. However, firm break of 0.7603 will argue that the trend has reversed and turn focus to 0.8332 support turned resistance (2023 low) for confirmation.
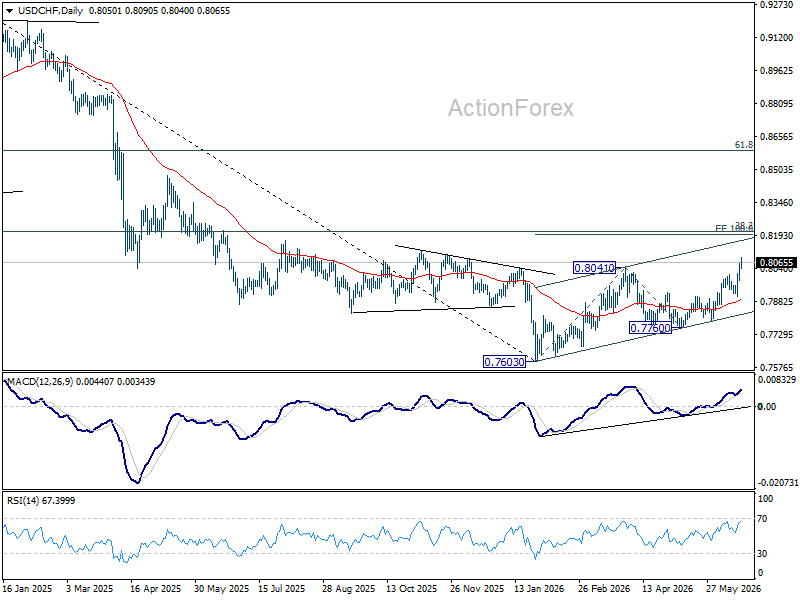
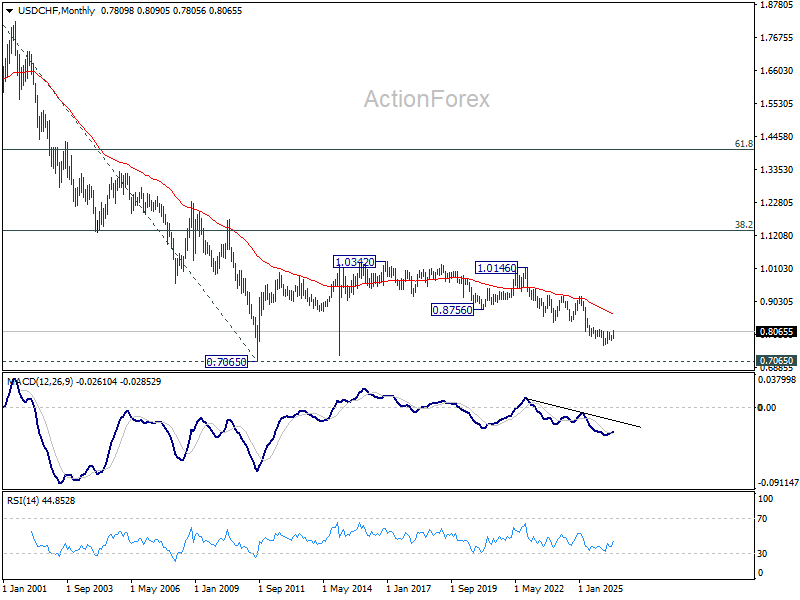
In the long term picture, price action from 0.7065 (2011 low) are seen as a corrective pattern to the multi-decade down trend from 1.8305 (2000 high). It's uncertain if the fall from 1.0342 is the second leg of the pattern, or resumption of the downtrend. But in either case, outlook will stay bearish as long as 0.8756 support turned resistance holds (2021 low). Retest of 0.7065 should be seen next.