

Sample Category Title
EUR/GBP Gains as Markets Scale Back BoE Tightening Expectations, More Upside Ahead
EUR/GBP's advance this week is telling a bigger story than simple Euro strength. What markets are really pricing is a fading belief that the Bank of England will need to deliver significantly more tightening than the European Central Bank. For months, Sterling benefited from the assumption that sticky UK inflation would eventually force policymakers into a more aggressive stance than their European counterparts. That narrative is now beginning to unravel.
The first blow came from the collapse in energy prices following the U.S.-Iran agreement. Only weeks ago, surging oil prices threatened to reignite inflation concerns across Europe and the UK. Today, that risk looks considerably smaller. The second blow came from the UK inflation report. Headline CPI held at 2.8%, below expectations of 3.0%, while core inflation rose only modestly to 2.6%, also undershooting forecasts. Services inflation remains elevated and explains why some policymakers remain concerned, but the overall report failed to provide the kind of inflation shock that would force markets to aggressively price further BoE tightening.
The final piece arrived with the BoE meeting itself. Although two members voted for a rate hike, the broader Committee showed little sign of shifting in a hawkish direction. More importantly, the Bank's statement emphasized a loosening labor market and signs of economic weakness. That matters because the BoE's centrist members ultimately hold the balance of power. As long as they remain focused on slowing growth rather than inflation persistence, the probability of securing enough votes for a rate increase remains low. Investors are concluding that the most likely outcome is an extended pause rather than another move higher.
This leaves EUR/GBP benefiting from a growing policy asymmetry. The ECB has already raised rates to 2.25%, and while expectations for additional tightening remain limited, investors no longer see the BoE pulling decisively ahead. The market is not necessarily becoming more bullish on the Euro. Rather, it is becoming less bullish on Sterling. That distinction helps explain why EUR/GBP has strengthened even without a major change in ECB expectations.
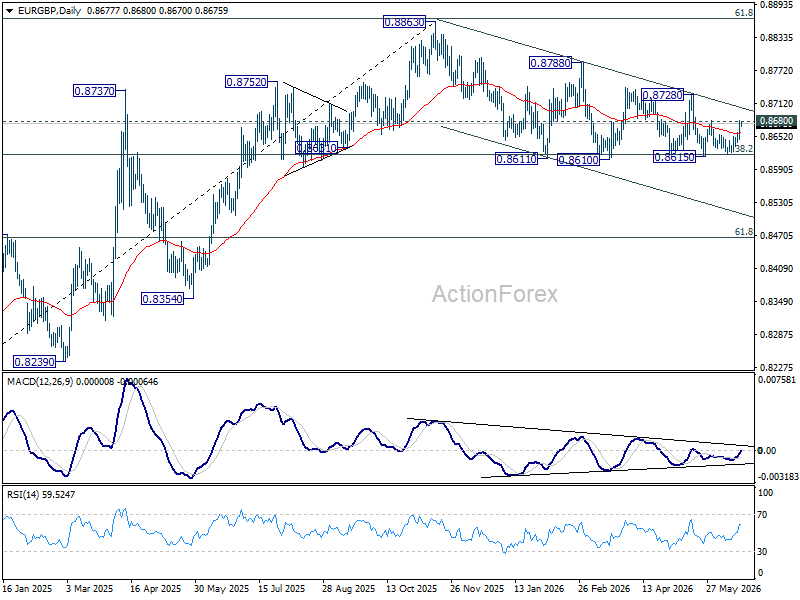
Technically, the crosses continues to send constructive signals. The repeated defense of the 0.8618 support zone, corresponding to 38.2% retracement of 0.8221 to 0.8863, suggests buyers remain firmly in control. The larger uptrend from the 0.8221 (2024 low) remains intact.
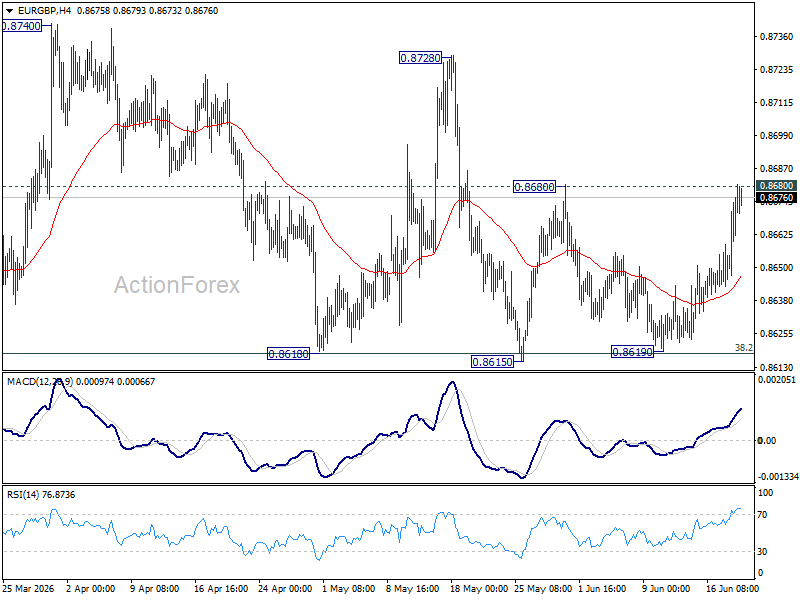
A decisive break above 0.8680 resistance would add further confidence to the bullish case and target 0.8728 next. Beyond that, attention would shift back toward the 2025 high at 0.8863. Unless incoming UK data materially alter expectations for the BoE, the balance of risks appears tilted toward further EUR/GBP gains in the weeks ahead.
Japan Core Inflation Holds at 1.4%, Fuel Subsidies Continue to Suppress Price Pressures
Japan's core consumer inflation remained unchanged at 1.4% yoy in May, matching expectations and staying below the Bank of Japan's 2% target for a fourth consecutive month. Headline CPI edged up from 1.4% yoy to 1.5% yoy. The closely watched core-core measure, which excludes both fresh food and energy, slowed from 1.9% yoy to 1.8% yoy, marking its weakest pace since September 2022.
Government fuel subsidies continued to play a significant role in restraining inflation. Energy prices fell -2.5% yoy following a -3.9% decline in April, with gasoline prices down -7.0% and electricity costs falling -2.4%. Food inflation also moderated, with prices excluding fresh food rising 3.5% yoy, down from 4.1% yoy in the previous month. The data suggest that while imported cost pressures remain present, government support measures are still preventing a broader acceleration in consumer prices.
Nevertheless, the softer inflation readings are unlikely to derail the Bank of Japan's normalization path. Analysts generally expect inflation to reaccelerate in coming months as higher raw material costs linked to the Middle East conflict feed further into producer and consumer prices. Producer price inflation has already accelerated sharply, raising expectations that pipeline pressures will eventually broaden beyond energy-related sectors. While the latest CPI report offers some near-term relief, it is unlikely to materially alter expectations for another gradual BoJ rate hike later this year.
Japan CPI (May 2026)
| Indicator | Apr | May | Expected |
|---|---|---|---|
| Headline CPI Y/Y | 1.4% | 1.5% | - |
| Core CPI (Ex-Fresh Food) Y/Y | 1.4% | 1.4% | 1.4% |
| Core-Core CPI (Ex-Fresh Food & Energy) Y/Y | 1.9% | 1.8% | - |
Key Inflation Components
| Component | May 2026 |
|---|---|
| Energy Prices Y/Y | -2.5% |
| Food Prices (Ex-Fresh Food) Y/Y | 3.5% |
| Gasoline Prices Y/Y | -7.0% |
| Electricity Prices Y/Y | -2.4% |
New Zealand Exports Jump 18%, But Faster Import Growth Limits Trade Surplus
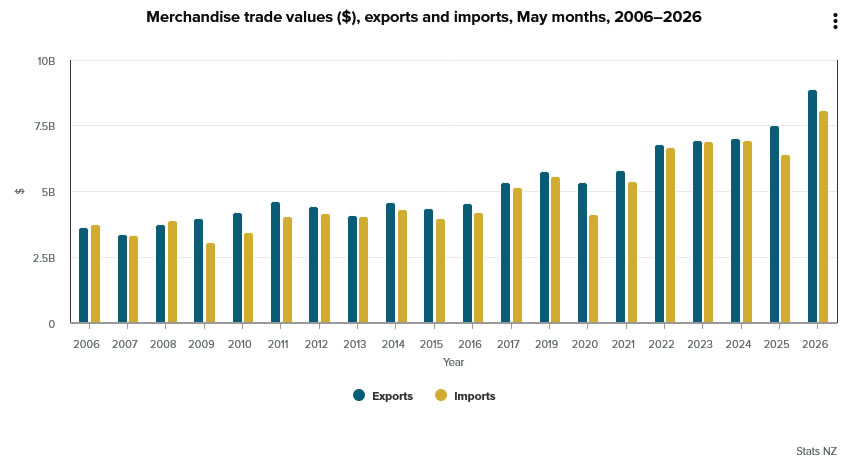
New Zealand recorded a goods trade surplus of NZD 800m in May, slightly below expectations of NZD 875m, as strong export growth was more than offset by an even larger increase in imports. Goods exports rose NZD 1.4b, or 18% yoy, to NZD 8.9b, while imports climbed NZD 1.7b, or 26% yoy, to NZD 8.1b. The figures point to healthy trade activity but also suggest resilient domestic demand and rising import requirements.
Export performance was broad-based across New Zealand's major trading partners. Exports to the United States rose NZD 265m, or 29%, led by a surge in meat shipments. Australia recorded a NZD 255m increase, with gains spread across precious metals, pharmaceuticals and steel products. Exports to China rose NZD 196m, supported by stronger shipments of meat, dairy products and seafood, while exports to the European Union and Japan increased by NZD 110m and NZD 120m respectively. The data indicate that external demand remained resilient despite a slowing global growth backdrop and recent geopolitical uncertainty.
Imports also rose sharply, reflecting both stronger domestic activity and higher purchases of key goods. Imports from South Korea surged 79%, driven overwhelmingly by petroleum products. Imports from China, the European Union, Australia and the United States all posted double-digit gains, led by vehicles, machinery and pharmaceutical products. While the narrower-than-expected surplus may appear disappointing at first glance, the composition of the report suggests trade flows remain robust on both sides of the ledger. The strong rise in imports alongside healthy exports points to an economy that continues to benefit from improving external demand while maintaining solid domestic spending momentum.
| Indicator | Actual | Expected |
|---|---|---|
| Trade Balance | NZD 800m Surplus | NZD 875m Surplus |
| Export Growth Y/Y | 18% | - |
| Import Growth Y/Y | 26% | - |
Top Export Destinations
| Destination | Y/Y Change | Main Drivers |
|---|---|---|
| United States | +NZD 265m (+29%) | Meat, fruit, machinery |
| Australia | +NZD 255m (+33%) | Precious metals, pharmaceuticals, steel |
| China | +NZD 196m (+10%) | Meat, dairy, seafood |
| Japan | +NZD 120m (+31%) | Aluminium, meat, fruit |
| European Union | +NZD 110m (+15%) | Fruit, aluminium, meat |
Top Import Sources
| Source | Y/Y Change | Main Drivers |
|---|---|---|
| South Korea | +NZD 391m (+79%) | Petroleum products |
| China | +NZD 280m (+19%) | Vehicles, electrical equipment, machinery |
| Australia | +NZD 147m (+20%) | Food products, vehicles |
| European Union | +NZD 145m (+15%) | Vehicles, rail equipment, machinery |
| United States | +NZD 105m (+18%) | Machinery, pharmaceuticals |
Australia May CPI Preview: Underlying Pressures Persist
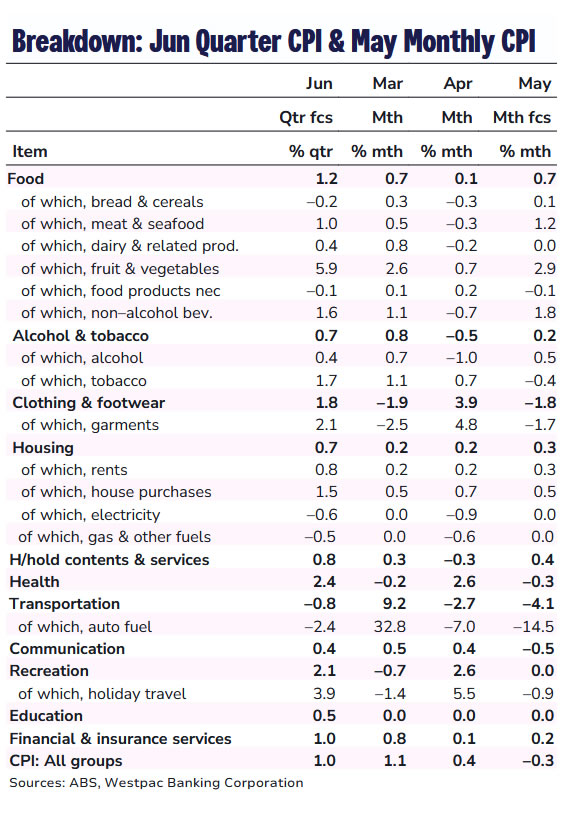
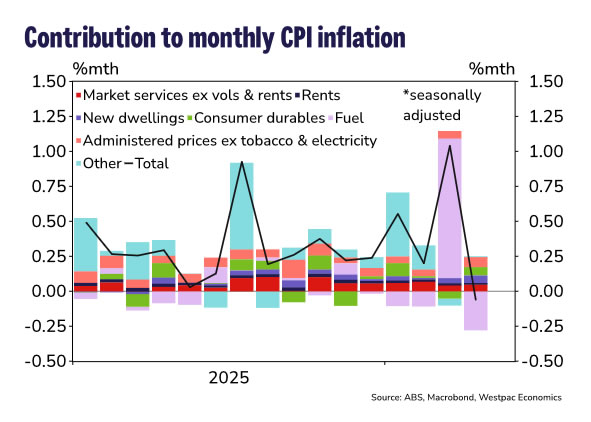
- We expect May CPI to fall -0.3%mth, which will still see the annual pace lift to 4.4%yr. On a seasonally adjusted basis, we pencil in a modest 0.2%mth rise.
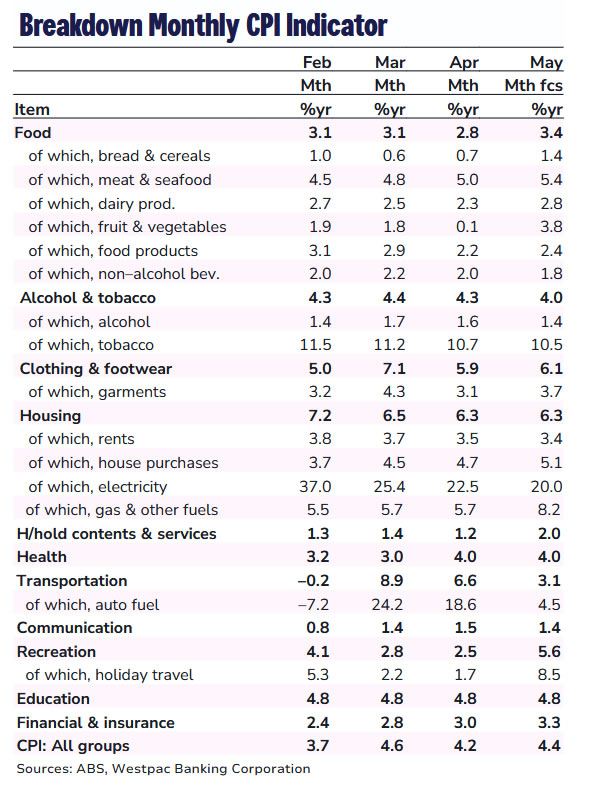
- Transport is expected to again be the main drag due to lower fuel prices, with clothing & footwear also subtracting. This will be partly offset by modest gains in food and housing.
- The monthly trimmed mean is forecast at 0.4%mth, lifting the annual pace to 3.6%yr. Market services excluding volatiles is expected to be flat in the month; excluding both volatiles & holiday travel is expected to rise 0.2%mth.
- Downside risks are centred on timing, with uncertainty over the pace and extent of price adjustments. Some measures suggest pressures moderated in May but remain elevated. The key upside risk is a faster pass-through of higher construction costs.
Abstracting From the Noise
Underlying Inflation Firmed in April ...
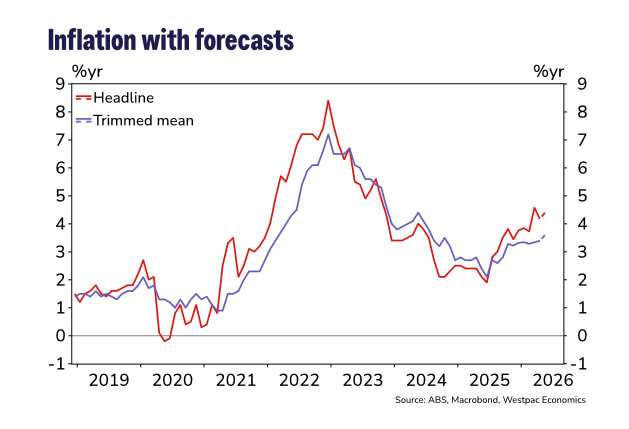
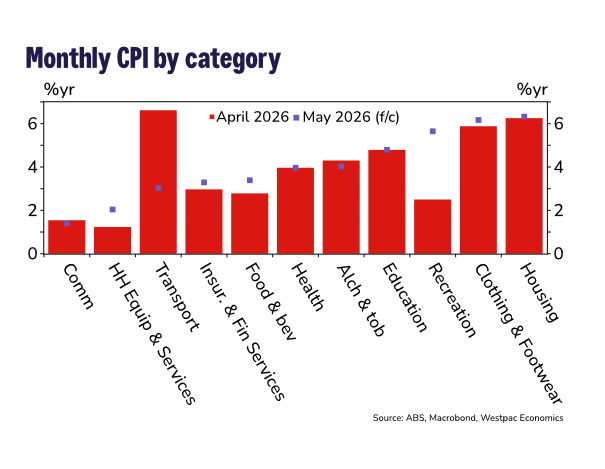
In April, the monthly CPI undershot expectations, with headline inflation easing to 4.2%yr. However, underlying inflation remained firm, with trimmed mean rising to 3.4%yr from 3.3%yr in March.
The release provided a read on pass-through from the Middle East energy shock beyond automotive fuel, and while there were emerging signs of cost pressures feeding into housing and some services, the extent of pass-through across the broader CPI basket was more limited than we had anticipated. This largely reflected policy measures, which have helped dampen the initial impact.
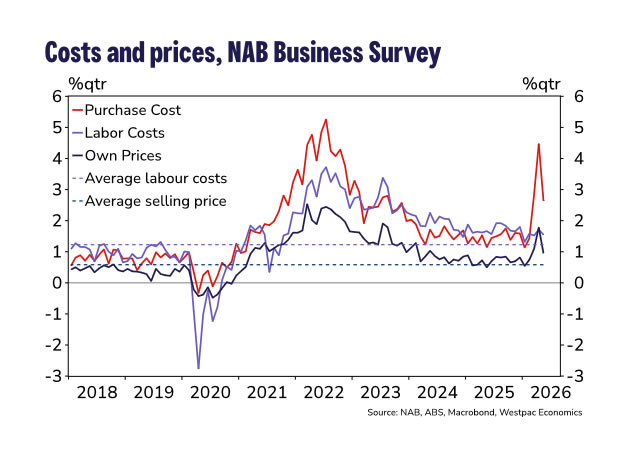
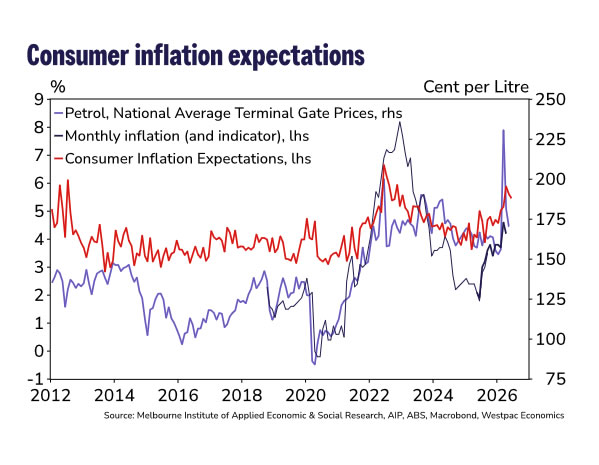
In May, most of the focus will again be on evidence of second-round effects from higher oil prices and energy-intensive goods. While details since the April CPI release show some moderation in cost pressures, levels remain elevated. Purchase cost growth is still 1.4ppts above its long-run average, with selling price growth also sitting above its respective level (see here). The RBA also noted in its post-meeting statement on Tuesday that some firms are already passing through higher costs, with others signalling an intention to do so (presumably based on insights from its liaison program).
... and Should Continue to Strengthen in May
We expect the May monthly CPI to decline -0.3%mth. With a -0.5%mth fall dropping out of the annual comparison, year-ended inflation lifts to 4.4%yr. May is typically a seasonally soft month; on a seasonally adjusted basis, we expect CPI to rise by 0.2%mth.
The main detractor in the month is transport (-0.4ppts), largely reflecting lower automotive fuel prices. Clothing & footwear is also expected to subtract around -0.1ppt. These are partly offset by modest contributions from food and housing, each adding around 0.1ppt to the monthly outcome.
We estimate trimmed mean inflation to rise 0.4%mth, taking the annual pace to 3.6%yr from 3.4%yr in April.
On other underlying measures, market services excluding volatiles is expected to be flat in the month; excluding both volatiles & holiday travel is expected to rise 0.2%mth.
Key Details
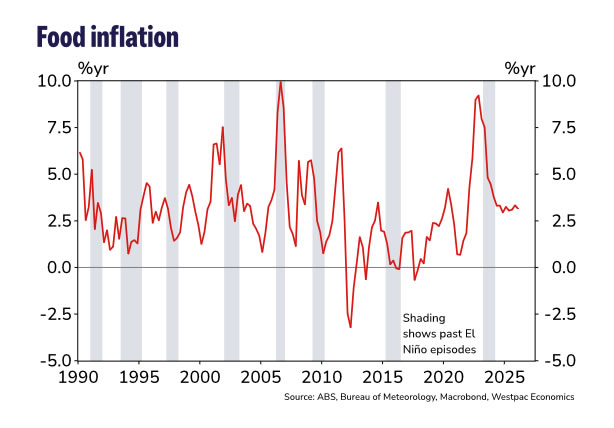
Food prices are expected to lift 0.7%mth, driven primarily by a 2.9%mth rebound in fruit and vegetables following unexpected softness last month. The Bureau of Meteorology has now confirmed an El Nino event. El Nino's effect on food prices has historically been mixed but combined with higher fertiliser costs we think there could be larger disruptions to agricultural output and hence greater upside pressure to food prices later this year and into next year.
Transport prices are expected to fall -4.1%mth in May, reflecting a -14.5%mth decline in automotive fuel. Retail petrol and diesel prices continued to ease in the month, averaging $1.84/l and $2.35/l, respectively. The fuel excise cut remains in place until end-June, and we expect its expiry to be fully reflected in prices by around the third week of July.
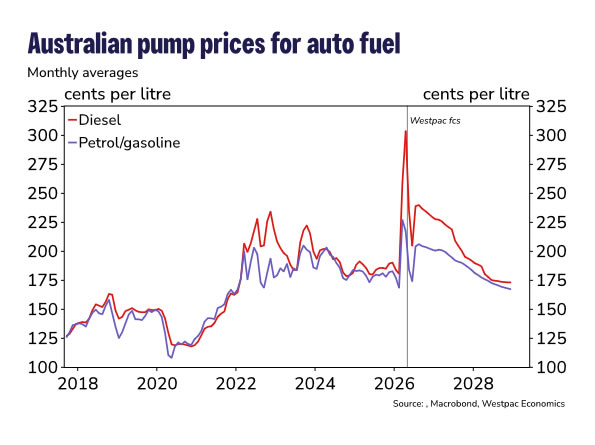
There are ongoing discussions around a potential three-month extension of the fuel excise cut. If implemented - and matched by state government contributions - this would present downside risk to our Q3 inflation forecasts. We estimate this extension would subtract around 0.5ppts from headline inflation in Q3. The direct impact on trimmed mean would be negligible, but it could dampen second-round effects, leading to trimmed mean coming in lower than projected. Even so, it would remain elevated and well above the RBA's target band.
Housing is expected to rise 0.3%mth.
- Rents are expected to increase 0.3%mth. This is a pick-up from the 0.2%mth pace seen over the prior two months, which were dampened by an increase in the Commonwealth Rent Assistance. This will lift annual rent inflation to 3.4%yr.
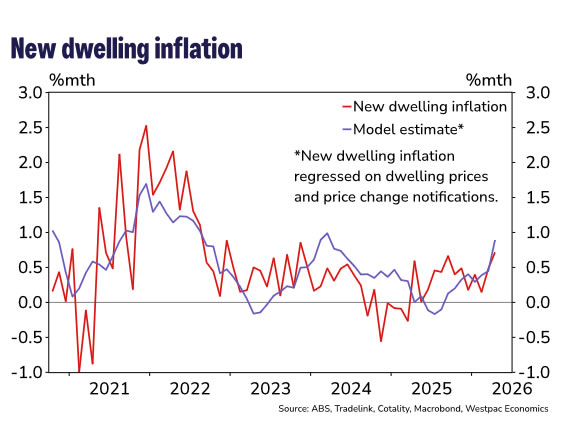
- New dwelling purchase costs are expected to rise 0.5%mth, after recording a more than two-year high result of 0.7%mth in April. This would take year-ended inflation to 5.1%yr - the highest since August 2024.
- Construction cost measures such as the Tradelink price change notification data show a reasonable explanatory relationship with new dwelling costs once short-term volatility and broader housing market conditions are allowed for. This suggests recent increases in price notifications will continue to put upward pressure on new dwelling inflation in the months ahead. The build-out of data centres is also increasing competition for labour and materials, which could add to cost pressures over the coming year.
Holiday travel is expected to decline -0.9%mth. May is a seasonally weak month, particularly for domestic travel.
Insurance & financial services are expected to rise by 0.2%mth in May. This is led by a 0.6%mth rise in insurance. We expect insurance premiums to gradually lift into year-end as repair and replacement costs for dwellings and motor vehicles rise.
Risks to May Baseline
The key risk to the May profile is delayed pass-through, with second-round effects slower-than-expected due to both policy dampening and lags in how price changes feed into the CPI (e.g. lags for holiday travel are around one month for domestic travel and two months for international). Firms may also absorb a larger share of increases, given the softening we have seen in non-fuel consumer spending (see here) and sentiment stuck in deep pessimism territory (see here).
On the upside, new dwelling purchase inflation could turn out stronger than our forecast. Average value of price changes among trade suppliers picked-up in May (17% vs 16% in April) and this could flow through more quickly and strongly than we have accounted for.
Quarterly Profile
We released our updated forecasts following revisions to our baseline oil price scenario in last week's June Market Outlook (see here). Minor rounding impacts have since lifted our Q2 year-ended trimmed mean forecast to 3.8%yr (3.74%yr to 3.78%yr), with the quarterly estimate unchanged at 1.0%qtr. The remainder of the profile is unchanged, with trimmed-mean inflation still expected to peak in Q3 this year. For further details discussing the revisions see here.
Cliff Notes: Policy Matters
Key insights from the week that was.
The RBA Monetary Policy Board (MPB) unanimously decided to leave the cash rate unchanged at 4.35% this week, as widely expected. However, in the subsequent communications, the MPB clearly leaned against the idea that the hiking cycle is definitively over. After emphasising that both headline and underlying inflation is “too high” and warning that “[t]here are signs that some firms experiencing cost pressures are increasing the prices of their goods and services and others are looking to do so”, the MPB explicitly signalled that it will not rule out “increasing the cash rate target further if required” in order to achieve its objectives.
As discussed by Chief Economist Luci Ellis in a video update midweek, markets have recently taken a larger cue from a softer run of data around consumer spending, housing and the labour market. Some of the weakness in the labour market reflected ‘abnormal seasonality’ which we expect will revert in May. But the important point is that Governor Bullock framed a weaker economy as an intended consequence of tighter monetary policy – slowing demand growth enough to squeeze inflation out of the system and prevent it from becoming embedded in expectations. With upcoming inflation data likely to show further persistence, we think the MPB will feel compelled to respond with further rate hikes in August and September.
Before moving offshore, a final note on local manufacturing. The latest Westpac-ACCI Survey of Industrial Trends revealed that momentum stalled heading into mid-year, the Actual Composite falling from a robust 57.6 in Q1 to a neutral reading of 50.5 in Q2. Underpinning the result was a flattening in new orders, a deceleration in output growth and a decline in employment. This comes as the Middle East conflict compounds the cost-of-living pressures households face, weighing on demand. It has also reignited cost pressures within manufacturing, a net 51% of firms reporting a rise in average unit costs. Firms expect further material increases in selling prices as a result, suggesting the pass-through of higher costs will persist into the second half. What was once budding optimism on the general business outlook has now collapsed to deep pessimism, leading many firms to delay or cancel plans to increase investment and hiring over the coming year.
Before moving further afield, New Zealand received an update on economic activity this week, the 0.8% rise in Q1 GDP a little less than we expected, though revisions meant the annual growth pace came out ahead of our forecasts. The pick-up in momentum evident over recent quarters likely came to a halt in Q2 due to the Middle East conflict, but this week’s apparent resolution (see below) could see the economy pick up again sooner than we had assumed.
In the US, the first FOMC meeting with Kevin Warsh as Chair was largely as anticipated. Notably, Chair Warsh focused on the practices of the Committee and the Federal Reserve as much as the economic outlook, announcing the formation of five separate task forces. On the current state of the economy, the labour market was characterised as largely in balance. The message on inflation was blunt, Chair Warsh making clear the Committee “will deliver price stability”.
Regarding the near-term policy outlook, the market showed concern over 9 of 18 respondents expecting at least one rate hike by year end. However, in the press conference, Chair Warsh made clear the degree of uncertainty participants wrestled with in coming to these views. Also, at least with respect to energy prices, in recent days risks have begun to recede. If the US/Iran deal holds over coming months, we expect the FOMC to remain on hold.
The Bank of England also marked time in June, with seven of the nine Monetary Policy Committee members voting to keep Bank Rate unchanged at 3.75%. The minutes showed that Chief Economist Huw Pill and external member Megan Greene preferred a 25bp hike as a risk-management response given the possibility of material second-round effects from energy inflation. Other members took comfort from the recent fall in energy prices. The latest labour market and inflation prints were meanwhile interpreted as evidence that disinflation was well underway before the Middle East conflict. Nonetheless, the statement carried a hawkish tone, signalling the Committee still sees price risks as the dominant concern.
In Asia, the Bank of Japan raised its policy rate by 25bps to 1.0%. This follows strong wage outcomes earlier this year and growing evidence of pass-through to domestic inflation, particularly for services. In Governor Ueda’s absence, Deputy Governor Uchida signalled further rate hikes ahead. We expect that productivity gains and sustained domestic inflation pressures will support the BoJ reaching a terminal rate of around 1.5% in mid-2027.
The Policy Board also confirmed that it will continue tapering JGB purchases, albeit at a slower pace. Importantly, the Bank retains the flexibility to scale up purchases in the event of disorderly moves in yields and will continue to pre-commit to purchase amounts on a quarterly basis.
On the data front, Chinese activity disappointed again in May. Retail sales contracted over the year, -0.6%yr, as soft income growth, declining wealth and an absence of confidence weighed. Fixed asset investment fell 4.1%ytd, driven by declines in sectors including property, health and education, but also owing to a lull in previously strong areas of the economy, namely manufacturing and utilities. Industrial production growth of 5.4%ytd shows the effective use of current capacity to meet strong growth in external demand, however. Aggregate growth in the economy is largely dependent on net exports’ contribution at present. This is unsustainable given the record-high level of the trade surplus, hence the need for material and urgent stimulus for the domestic economy.
Finally, to the Middle East conflict. A resolution now looks to be in effect, at least for the next 60 days after a 14-point Memorandum of Understanding was signed by both the US and Iran. On day 1 of the Strait’s re-opening, several VLCCs, which each carry 2 million barrels of oil, were seen transiting the Strait as others readied at port. Further, not only will shipments from other Middle East countries now come to the global market, but also from Iran – waivers allowing the nation to freely sell into the global market without delay and, as conditions are met, the removal of sanctions should confirm long-term access. Negotiations over Iran’s nuclear program are still necessary, and until agreed there is risk of further conflict. Also, it will take time for damaged infrastructure and global inventories to be rebuilt. Still, the initial market reaction has be positive, the price of Brent oil falling from a recent peak near USD110 per barrel to USD79, compared to an average of USD63 in Q4 2025.
USD/JPY Builds Strong Momentum for Another Upside Push
Key Highlights
- USD/JPY started a fresh increase above the 160.00 resistance.
- A key bullish trend line is forming with support at 160.40 on the 4-hour chart.
- EUR/USD extended losses and traded below 1.1520.
- WTI Crude Oil prices declined below $76.50 and $75.00.
USD/JPY Technical Analysis
The US Dollar remained supported above 158.50 against the Japanese Yen. USD/JPY formed a base and started a fresh increase above 160.00.
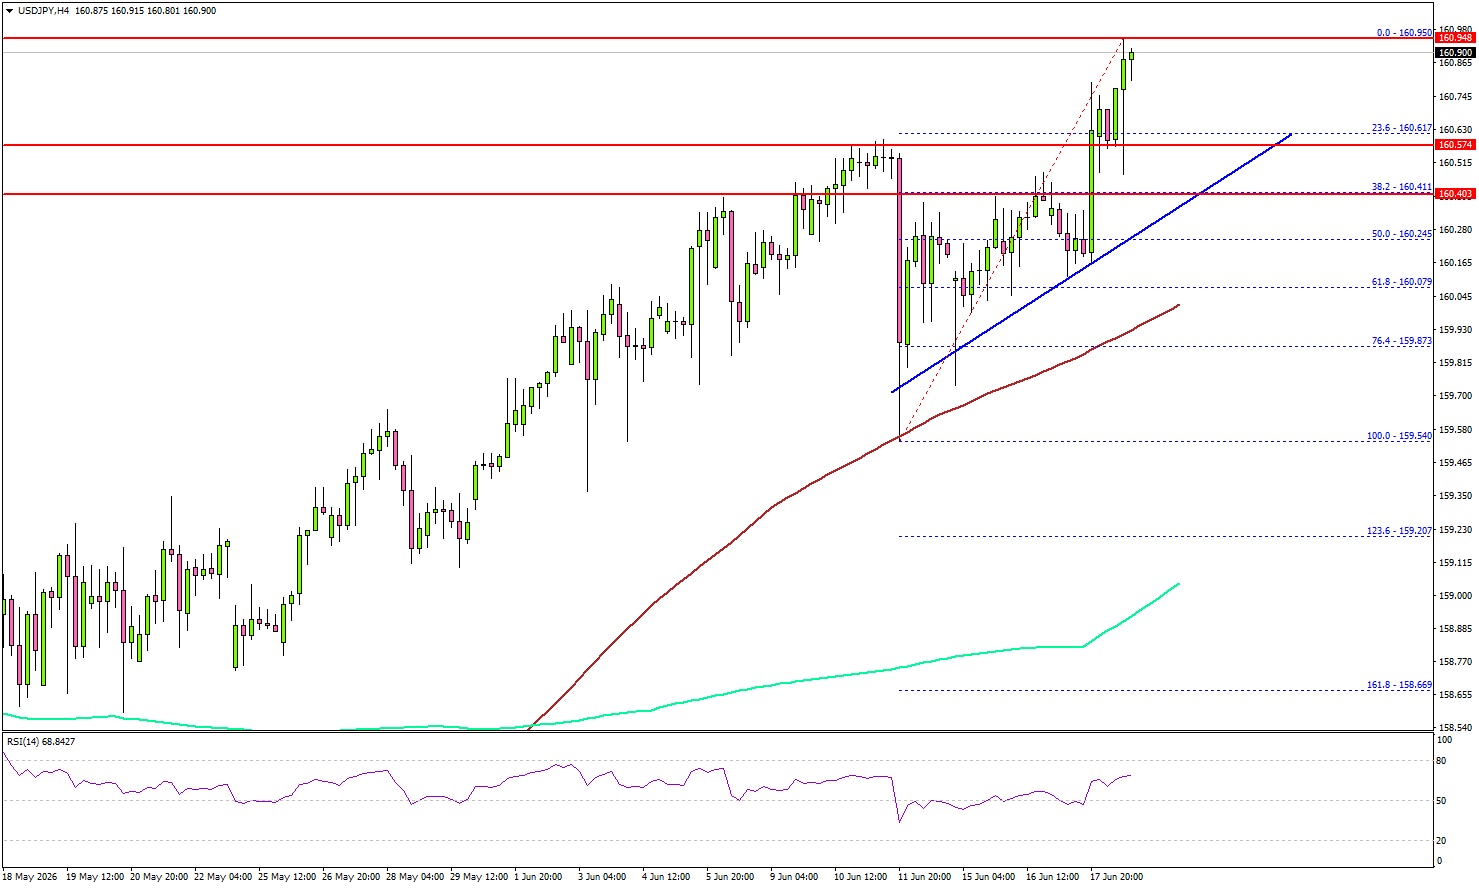
Looking at the 4-hour chart, the pair settled above 160.00, the 100 simple moving average (red, 4-hour), and the 200 simple moving average (green, 4-hour). The current price action suggests that the pair could continue to rise.
Immediate resistance might be 161.20. The next major resistance could be 162.00. A close above 162.00 could open the doors for a larger increase. In the stated case, USD/JPY might aim for a test of 165.00.
If there is a downside correction, the pair might find support near 160.55. The first major support could be near a key bullish trend line at 160.40. A downside break and close below the trend line might spark bearish moves.
The main support could be near 160.00 and the 100 simple moving average (red, 4-hour). Any more losses might set the pace for a test of 159.20 and the 200 simple moving average (green, 4-hour).
Looking at EUR/USD, the pair faced an increase and selling pressure and declined below the 1.1520 support.
Upcoming Key Economic Events:
- ECB's Lane speech.
- ECB's Cipollone speech.
- ECB's Elderson speech.
Elliott Wave Analysis: Bitcoin’s (BTCUSD) Countertrend Bounce Set to Fail
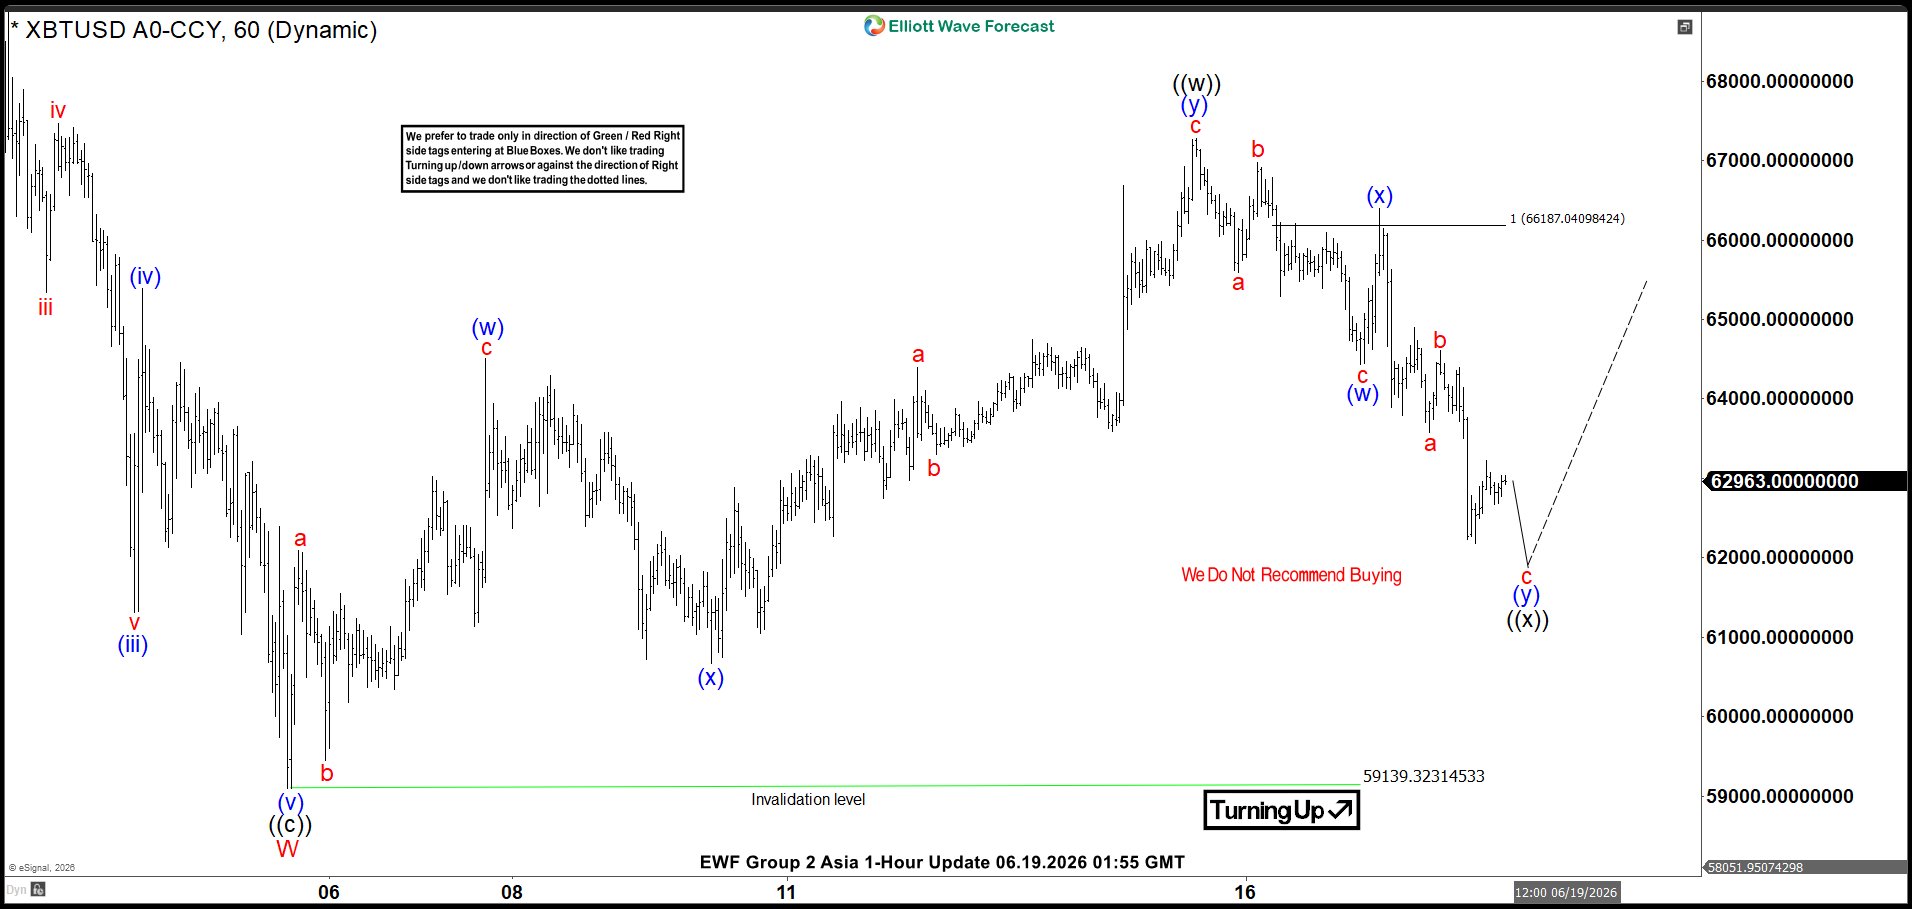
Since establishing the all‑time high on October 6, 2025 at $126,272, Bitcoin (BTCUSD) has entered a pronounced corrective phase. The Elliott Wave sequence from that peak suggests further downside potential, with the extreme area projected between $41,411 and $52,204. In the short term, the decline from the May 6, 2026 high concluded at $59,081, marking the completion of wave W. From that point, a corrective rally in wave X has unfolded, designed to retrace the cycle from the May 6 high. Internally, this rally has developed as another double three structure of lesser degree.
Advancing from wave W, wave (w) terminated at $64,506, followed by a pullback in wave (x) that ended at $60,670. Bitcoin then resumed higher in wave (y), reaching $67,278 and completing wave ((w)) of a higher degree. The subsequent pullback in wave ((x)) has progressed as a double three, with wave (w) ending at $64,430 and wave (x) at $66,398. The final leg, wave (y) of ((x)), is expected to conclude soon. Once complete, Bitcoin should turn higher in wave ((y)) to finish wave X, thereby correcting the cycle from the May 6, 2026 high.
Near term, as long as the pivot at $59,081 remains intact, Bitcoin retains scope for another upward leg. However, this corrective strength is anticipated to be temporary. The broader Elliott Wave outlook continues to favor renewed weakness, ultimately guiding prices toward the $41,411–$52,204 extreme area. This structure underscores the fragile nature of the current rally and highlights the prevailing bearish bias within the larger cycle.
Bitcoin (BTCUSD) 60-Minute Elliott Wave Chart
BTCUSD Elliott Wave Video:
https://www.youtube.com/watch?v=D2PCOuu-XOI
Eco Data 6/19/26
| GMT | Ccy | Events | Act | Cons | Prev | Rev |
|---|---|---|---|---|---|---|
| 22:45 | NZD | Trade Balance (NZD) May | 800M | 875M | 1920M | 1598M |
| 23:01 | GBP | GfK Consumer Confidence Jun | -23 | -23 | -23 | |
| 23:30 | JPY | National CPI Y/Y May | 1.50% | 1.40% | ||
| 23:30 | JPY | National CPI Core Y/Y May | 1.40% | 1.40% | 1.40% | |
| 23:30 | JPY | National CPI Core-Core Y/Y May | 1.80% | 1.90% | ||
| 23:50 | JPY | BoJ Minutes | ||||
| 06:00 | GBP | Retail Sales M/M May | 1.20% | 0.50% | -1.30% | -1.00% |
| 06:00 | EUR | Germany PPI M/M May | 0.30% | 0.80% | 1.20% | |
| 06:00 | EUR | Germany PPI Y/Y May | 2.20% | 2.50% | 1.70% | |
| 06:00 | GBP | Public Sector Net Borrowing (GBP) May | 23.3B | 18.9B | 24.3B | 23.0B |
| 12:30 | CAD | Retail Sales M/M Apr | 0.50% | 0.60% | 0.90% | |
| 12:30 | CAD | Retail Sales ex Autos M/M Apr | 0.10% | 0.70% | 1.40% |
| 22:45 | NZD |
| Trade Balance (NZD) May | |
| Actual | 800M |
| Consensus | 875M |
| Previous | 1920M |
| Revised | 1598M |
| 23:01 | GBP |
| GfK Consumer Confidence Jun | |
| Actual | -23 |
| Consensus | -23 |
| Previous | -23 |
| 23:30 | JPY |
| National CPI Y/Y May | |
| Actual | 1.50% |
| Consensus | |
| Previous | 1.40% |
| 23:30 | JPY |
| National CPI Core Y/Y May | |
| Actual | 1.40% |
| Consensus | 1.40% |
| Previous | 1.40% |
| 23:30 | JPY |
| National CPI Core-Core Y/Y May | |
| Actual | 1.80% |
| Consensus | |
| Previous | 1.90% |
| 23:50 | JPY |
| BoJ Minutes | |
| Actual | |
| Consensus | |
| Previous | |
| 06:00 | GBP |
| Retail Sales M/M May | |
| Actual | 1.20% |
| Consensus | 0.50% |
| Previous | -1.30% |
| Revised | -1.00% |
| 06:00 | EUR |
| Germany PPI M/M May | |
| Actual | 0.30% |
| Consensus | 0.80% |
| Previous | 1.20% |
| 06:00 | EUR |
| Germany PPI Y/Y May | |
| Actual | 2.20% |
| Consensus | 2.50% |
| Previous | 1.70% |
| 06:00 | GBP |
| Public Sector Net Borrowing (GBP) May | |
| Actual | 23.3B |
| Consensus | 18.9B |
| Previous | 24.3B |
| Revised | 23.0B |
| 12:30 | CAD |
| Retail Sales M/M Apr | |
| Actual | 0.50% |
| Consensus | 0.60% |
| Previous | 0.90% |
| 12:30 | CAD |
| Retail Sales ex Autos M/M Apr | |
| Actual | 0.10% |
| Consensus | 0.70% |
| Previous | 1.40% |
Dollar Index Rallies on Growing Prospects for Fed Rate Hike
The dollar extends advance into the second consecutive day and hit the highest in more than a year on Thursday.
Fed’s hawkish hold on Wednesday sparked fresh dollar’s rally, as signals of rate hike by the end of 2026 offsets dollar negative signals from growing peace prospects after US and Iran signed an agreement that opens way towards the end of war.
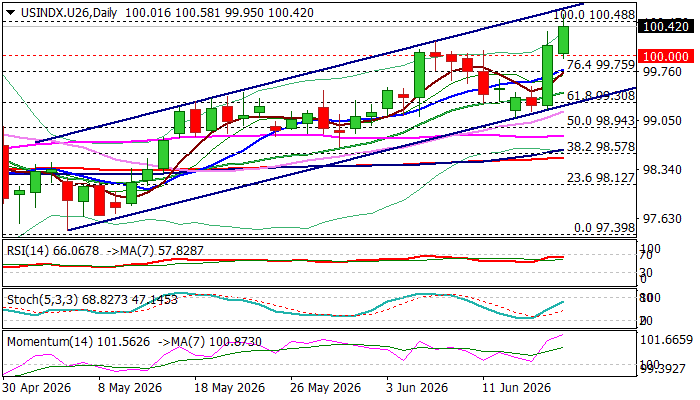
Wednesday’s nearly 1% advance marks the biggest daily gain since mid-March, which has also registered close above psychological 100 barrier, with today’s extension above former 2026 peak, on track for the second close above 100 level and to confirm bullish signal.
Firmly bullish daily studies contribute to supportive fundamentals and keep the dollar in larger uptrend, eyeing targets at 101.67 (bull-channel upper boundary and 101 zone (100WMA / Fibo 38.2% of larger 110.00/95.35 downtrend / round figure).
Broken 100 barrier reverts to solid support, along with 99.75 (10DMA) which should keep the downside protected.
Res: 100.58; 100.82; 100.94; 101.22
Sup: 100.00; 99.75; 99.45; 99.30
Sunset Market Commentary
Markets
“All members nevertheless agreed that the appropriate policy response would depend primarily on the outlook for second-round effects. If higher inflation were to reflect mainly direct energy effects and second-round effects were to remain contained, there was a stronger case for tolerating a slower return of inflation to target, in the context of weak activity. However, there would be a more challenging trade-off if higher energy prices appeared to be feeding into more persistent domestic inflation. In that event, the weight placed on output stabilisation would be likely to diminish, and policy would need to remain restrictive for longer, or become more restrictive.” That sums up the discussion at the Bank of England today. The central bank voted in a 7-2 split decision to keep the rate steady at 3.75% while retaining that it stands ready to act as necessary to have inflation meet the 2% target. Risks to inflation remained skewed to the upside. Policymakers noted that despite the recent oil price decline, there remains huge uncertainty regarding the US-Iran deal and that there’s bound to be a logistical delay in restoring energy production and transportation that may keep prices elevated for a longer period. A majority, however, considered continued weakness in activity and softness in the labour market (though not per se illustrated by this morning’s labour market report) to limit the strength of any potential second-round effects. The camp of 7 said it was too early to draw conclusions on the matter and that the current, restrictive policy stance, compounded by market-based tightening would weigh against them anyway. The members (Greene, Pill) voting for a rate increase to 4% thought of it in terms of risk management given the significant uncertainty about the extent of such second-round effects. The pound initially extended losses and UK front-end yields retreated from intraday highs after the decision, potentially disappointed with the BoE not stating a stronger commitment. Moves in both were limited either way. EUR/GBP is trading around 0.866 as it now eyes the potentially more important Manchester by-election. UK money markets hold on to at least one hike by end-2026. The UK yield curve flattens with changes varying between +4 bps (2-yr) to -2 bps (30-yr) in a move that mirrors the US’ yesterday. Fed chair Warsh’s first presser left marks on the EA bond market too, where yields are changing +4 bps (2-yr) to -2.5 bps (30-yr). US front-end yields stabilize around yesterday’s highest close since February 2025. The long end continues to rally on compressing (inflation) risk premia. The likes of the 30-yr at some point dropped 7 bps. By focusing on the central bank’s inflation remit, Warsh at least temporarily is given the benefit of the doubt. That’s also supporting the US dollar, in spite of a slightly weaker oil price and improved risk sentiment. EUR/USD hits a new recent low at 1.1469. Key support is situated at 1.1392. DXY even surpassed the March high to trade at the strongest levels since May 2025.
News & Views
The Norges Bank kept its policy rate unchanged at 4.25%, but the current assessment of the outlook implies that it will likely be necessary to raise the policy rate further at one of the forthcoming meetings. Updated projections still suggest that it would be a final hike (fully discounted by the September meeting). Inflation is too high, higher than anticipated, and the rapid rise in business costs in recent years will contribute to keeping inflation elevated ahead. Underlying inflation (CPI-ATE) is expected to drift gradually towards the 2% target by the end of the policy horizon (2.1% by 2029 via 3.2%-2.8%-2.3% in 2026-2028). The central bank adds that it doesn’t want to restrict the economy more than needed with growth being slightly weaker than expected and the labour market loosening. The Norwegian krone loses some more ground today, but that June move is mainly inspired by lower oil prices. EUR/NOK trades at 11.10 compared with 11.20 at the start of the Iran war.
The Swiss National Bank sticks with its 0% policy rate. Inflation is expected to be marginally higher than in March, but still in the lower half of the 0%-2% tolerance band. Assuming an unchanged policy rate, the SNB expect average inflation of 0.6%-0.6%-0.7% for the 2026-2028 period. The Swiss economy has proved to be resilient given the conflict in the Middle East, but the SNB expects a negative effect from more moderate global growth. Still, the central bank expects growth of around 1% this year and around 1.5% next year as the accommodative monetary policy provides some help. If necessary, the SNB has an increased willingness to intervene in the FX market to counter a rapid an excessive CHF-appreciation. EUR/CHF holds above short term support at 0.92 which has been under test over the past few sessions.