Sample Category Title
Sterling Slips on UK Inflation Misses, But GBP/CAD Bullish Case Remains Intact
Sterling came under modest pressure after UK inflation data undershot expectations in May, but the report is unlikely to materially alter the Bank of England's policy outlook or the broader bullish case for some GBP crosses. Headline CPI held steady at 2.8% yoy, below expectations for a rise to 3.0% yoy, while monthly inflation slowed sharply from 0.7% mom to 0.2% mom. Core CPI edged up from 2.5% yoy to 2.6% yoy, but also came in below consensus forecasts of 2.7% yoy.
The softer-than-expected headline figures should ease concerns that inflation is reaccelerating more aggressively than policymakers anticipated. However, the details of the report were less reassuring. Services inflation, a key gauge of domestic price pressures watched closely by the BoE, accelerated sharply from 3.2% yoy to 3.7% yoy. While goods inflation slowed from 2.4% yoy to 2.0% yoy, the rise in services prices suggests underlying inflation pressures linked to wages and labor costs remain persistent.
As a result, the data are unlikely to change the outcome of Thursday's BoE meeting. Policymakers are widely expected to leave Bank Rate unchanged at 3.75%, and the latest inflation figures probably do little to alter the balance within the Monetary Policy Committee. Hawks will continue to point to elevated services inflation as evidence that inflation risks remain skewed to the upside. More cautious members will focus on signs of slowing economic activity and softer headline inflation. The report may influence the tone of the debate, but it is unlikely to shift votes.
That distinction is important for Sterling. While today's inflation miss may slow the currency's recent rally, it does not materially undermine expectations that the BoE could still tighten policy later this year if services inflation remains elevated. Markets may push back the timing of such a move, but the broader tightening bias remains intact.
This backdrop continues to favor GBP/CAD. The policy gap between the BoE and Bank of Canada remains substantial, with UK rates at 3.75% compared with Canada's 2.25%. Moreover, falling oil prices continue to weigh on the Canadian Dollar, while markets expect the BoC to remain on hold through year-end. Together, those factors provide a supportive fundamental backdrop for further GBP/CAD strength.
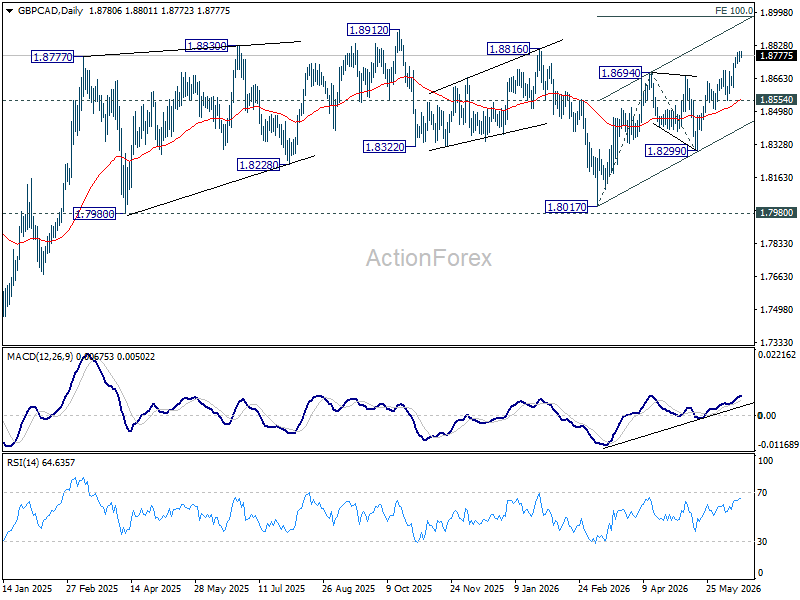
Technically, GBP/CAD's rally from 1.8017 remains intact. A retest of the 1.8912 high should be seen next. A break there would target 100% projection of 1.8017 to 1.8694 from 1.8299 at 1.8976. Near-term outlook should remain bullish as long as support at 1.8554 holds, in case of retreat.
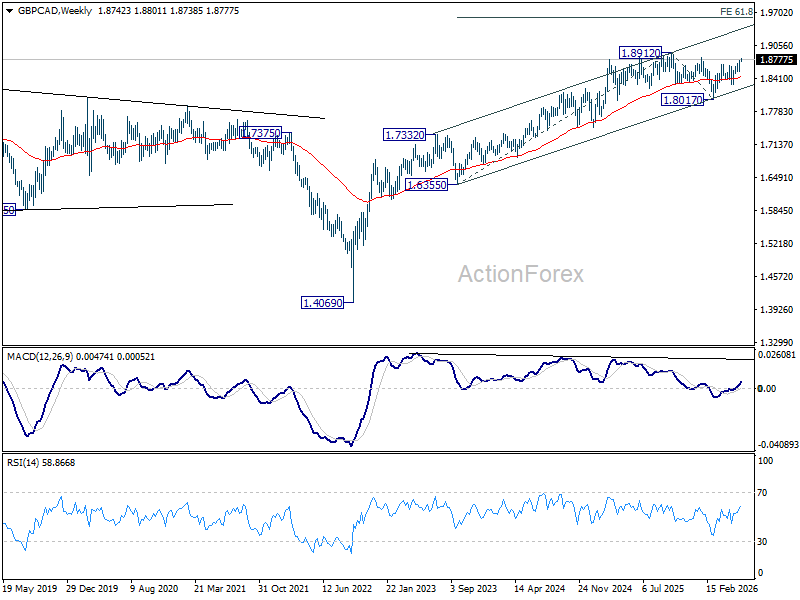
In the bigger picture, GBP/CAD found strong support from the rising channel that has guided price action since late 2023. The structure suggests the broader up trend from 1.4069 (2022 low) is still unfolding. A decisive break above 1.8912 would strengthen the case for a medium-term move toward 61.8% projection of 1.6355 to 1.8912 from 1.8017 at 1.9597.
Brent Crude Oil: Decline Amid US–Iran Ceasefire
The easing of geopolitical tensions in the Persian Gulf following the announcement of a ceasefire between the US and Iran on 14 June remains the main factor weighing on the oil market in recent days. Market participants are increasingly pricing in a scenario of a resumption of full-scale supplies through the Strait of Hormuz in the near future. This has led to a significant reduction in the geopolitical risk premium that previously supported prices at relatively elevated levels. In addition, expectations of higher supply from major producers are prompting profit-taking on long positions accumulated during the previous rally.
Technical Picture
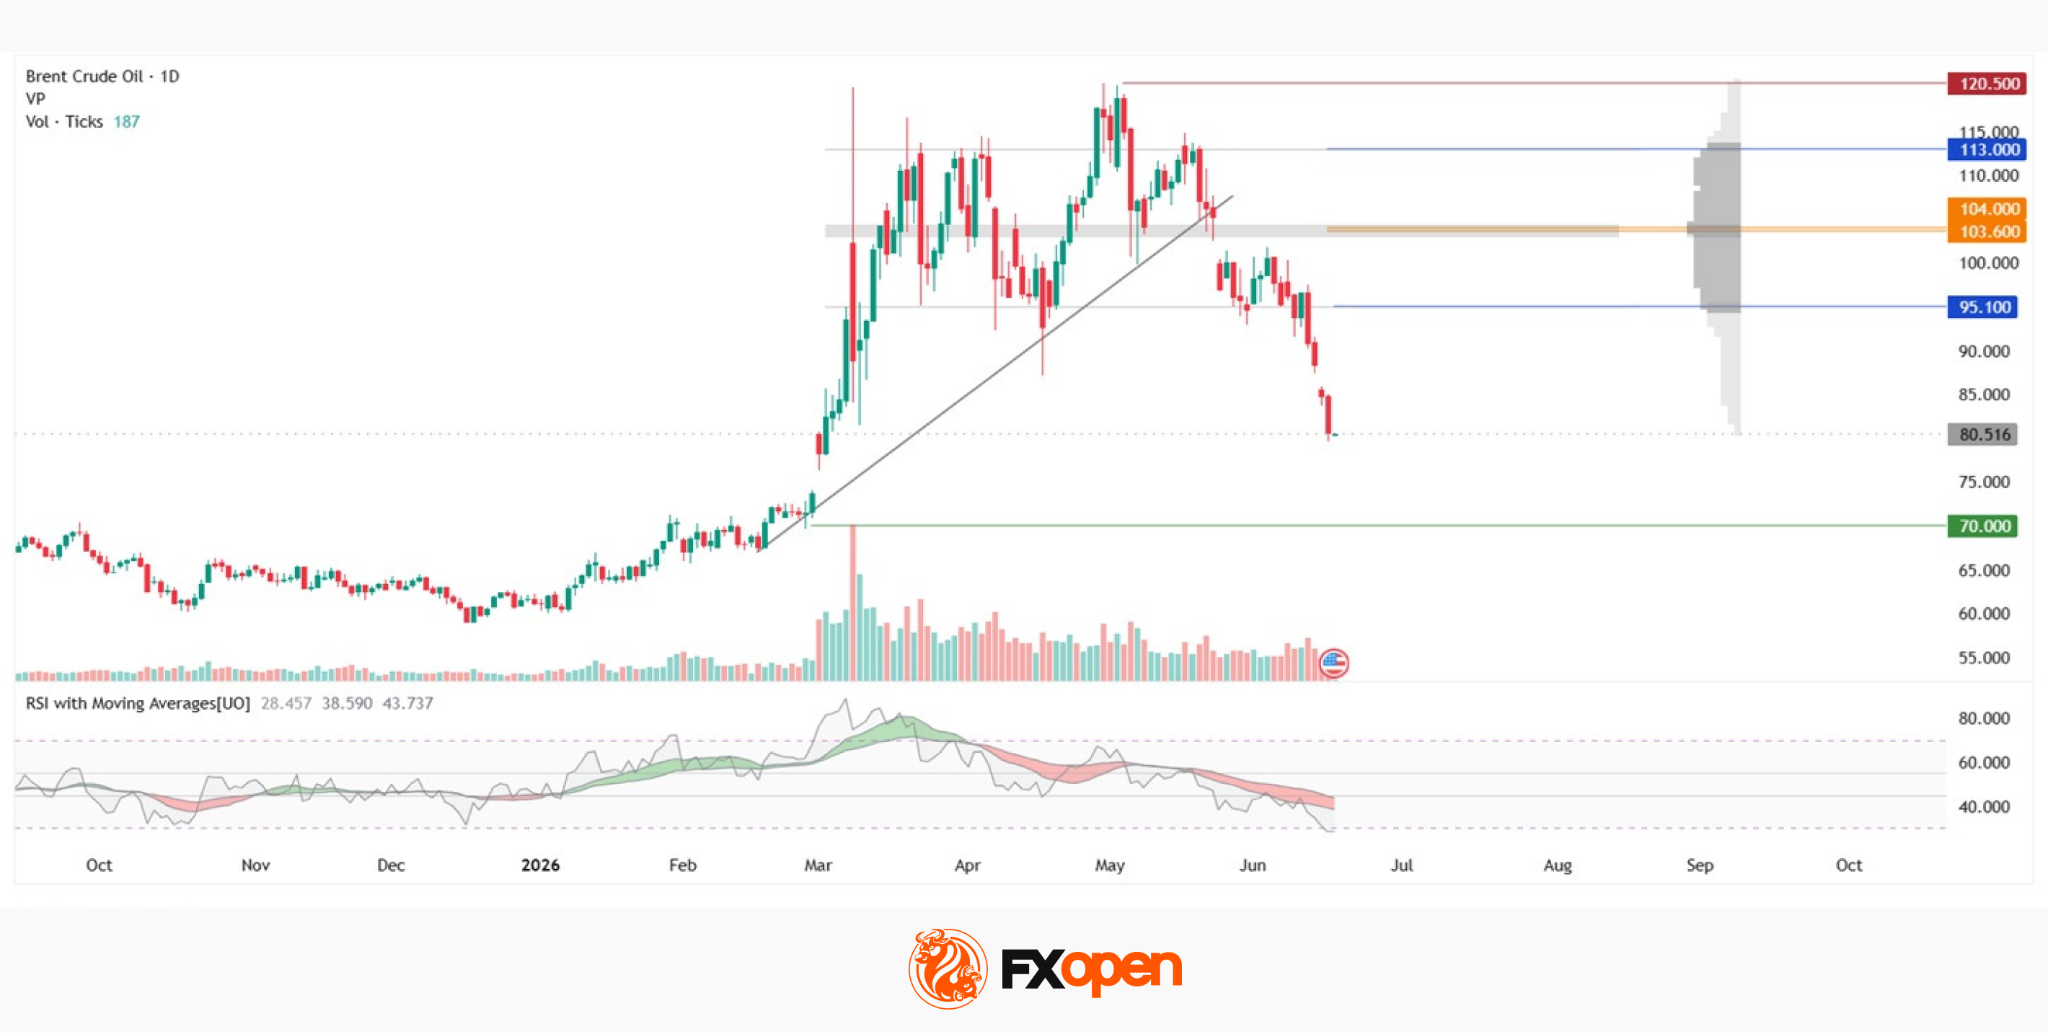
The medium-term uptrend in XBRUSD, which had been forming on the D1 timeframe since mid-December 2025, was broken on 25 May following a downside gap. After this, the price broke below the lower boundary of the market profile and significantly accelerated its downward movement. If the momentum continues at the same pace, the green support around $70,000 could act as the next downside reference point. In the event of a corrective rebound, two major obstacles would be the lower boundary of the profile at $95,100 and the point of control (POC) zone at $103,600–$104,000. The red resistance level at $120,500 may come into play if prices rise above the upper boundary of the profile at $113,000.
RSI + MAs shows readings of 28, 38 and 43. The moving averages are coloured red, while the RSI curve has entered oversold territory. This configuration suggests that in the near term the market may remain in a state of heightened uncertainty, with volatility likely to increase significantly. Vertical volume has not yet shown any notable anomalies.
Key Takeaways
The current market structure indicates a prevailing downside bias following the break of the medium-term uptrend. Against the backdrop of expectations of additional oil supply returning to the market, this technical picture adds to short-term uncertainty.
Start trading commodity CFDs with tight spreads (additional fees may apply). Open your trading account now or learn more about trading commodity CFDs with FXOpen.
This article represents the opinion of the Companies operating under the FXOpen brand only. It is not to be construed as an offer, solicitation, or recommendation with respect to products and services provided by the Companies operating under the FXOpen brand, nor is it to be considered financial advice.
FOMC Trading Playbook: How a Hawkish Fed Could Impact NASDAQ 100, Gold, EUR/USD and AUD/USD
Key takeaways
- The June FOMC meeting is a communication event rather than a rate decision event. Markets fully expect rates to remain unchanged at 3.50%-3.75%, with the real focus on the dot plot, inflation forecasts, policy language, and Fed Chair Kevin Warsh’s first press conference.
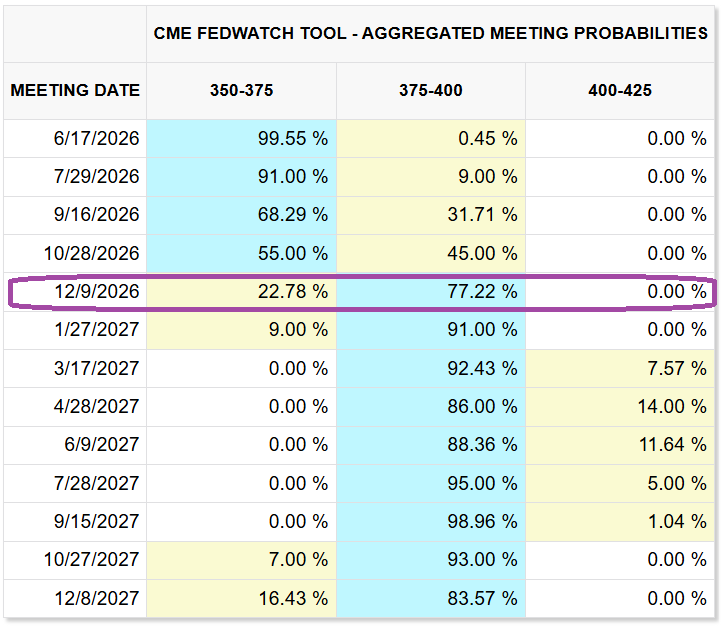
- Markets have rapidly repriced toward a higher-for-longer Fed. Fed funds futures now imply a 77% probability of a rate hike by December 2026, up sharply from 24% a month ago, despite the recent collapse in oil prices following the US-Iran interim peace agreement.
- A hawkish hold remains the base-case scenario. A higher dot plot, upward inflation revisions, and a less dovish policy bias would likely support the US dollar while weighing on Gold, the Nasdaq 100, EUR/USD, and AUD/USD.
The 17 June 2026 FOMC is not a normal “rate decision only” event. The market already expects the Fed to hold rates at 3.50%–3.75%, so the real trading signal will come from the dot plot, economic projections, policy-statement language, and new Chair Kevin Warsh’s first press conference.
Based on the latest data from CME FedWatch tool, US Fed funds futures are now pricing around 77% chance of a rate hike by December (see Fig. 1), up sharply from 24% a month earlier, despite lower oil prices since the start of the week due to US-Iran interim peace deal agreement, which means the market has already shifted from “rate-cut hope” to “higher-for-longer or even hike risk.”
Fig. 1: CME FedWatch tool aggregated FOMC meeting outcome probabilities as of 17 Jun 2026 (Source: CME website). The information presented is historical information, and past performance is not indicative of future performance.
The release of the FOMCE statement, interest rate decision, and “dot” plot (economic projections) will be on 18 June, 2.00 am SGT, followed by Warsh’s press conference at 2.30 am SGT.
The biggest mistake would be to trade only the first 2:00 am SGT candle. The initial move can easily reverse once Warsh starts speaking at 2:30 am SGT, especially because this is his first press conference and markets are trying to understand whether he will be more hawkish, less predictable, or less willing to give forward guidance.
The core market set-up
The Fed is expected to leave rates unchanged, but that does not mean the meeting is neutral. The risk is in the message.
The market participants want to know four things:
- Will the Fed remove its previous easing bias?
- Will the dot plot show fewer cuts or even some hikes?
- Will inflation forecasts be revised higher?
- Will Warsh sound as if he is preparing markets for a possible hike later this year?
Media outlets reported that most policymakers are expected to keep rates on hold for 2026, but some may pencil in a hike. That would be a hawkish shift from March, when the Fed was still leaning more toward eventual cuts.
Hence, this makes the meeting a communication shock event, not a rate-shock event.
Base case: Hawkish hold
The most likely outcome is a hawkish hold.
The Fed keeps rates unchanged at 3.50%–3.75% but removes language suggesting the next move is likely to be a cut. The dot plot shifts higher. Inflation projections are revised up. Warsh says policy must remain flexible and data-dependent, but does not validate market hopes for easing.
This is the scenario markets are partly prepared for, but not fully. The trade reaction depends on how far the dot plot and Warsh go.
Likely cross-asset reaction
| Asset | Potential expected reaction |
|---|---|
| U Dollar Index | Bullish |
| EUR/USD | Bearish |
| GBP/USD | Bearish |
| AUD/USD | Bearish |
| USD/JPY | Bullish but risky, fast approaching 160.65 intervention risk level |
| Gold | Bearish |
| WTI crude | Bearish but dominated by geopolitics |
| Dow Jones Industrial Average |
Bearish to choppy |
| S&P 500 | Bearish to choppy |
| Nasdaq 100 | Bearish, highest sensitivity |
Let’s now focus on the short-term technical charts and key levels to monitor.
EUR/USD – Stalled at around the 20-day moving average
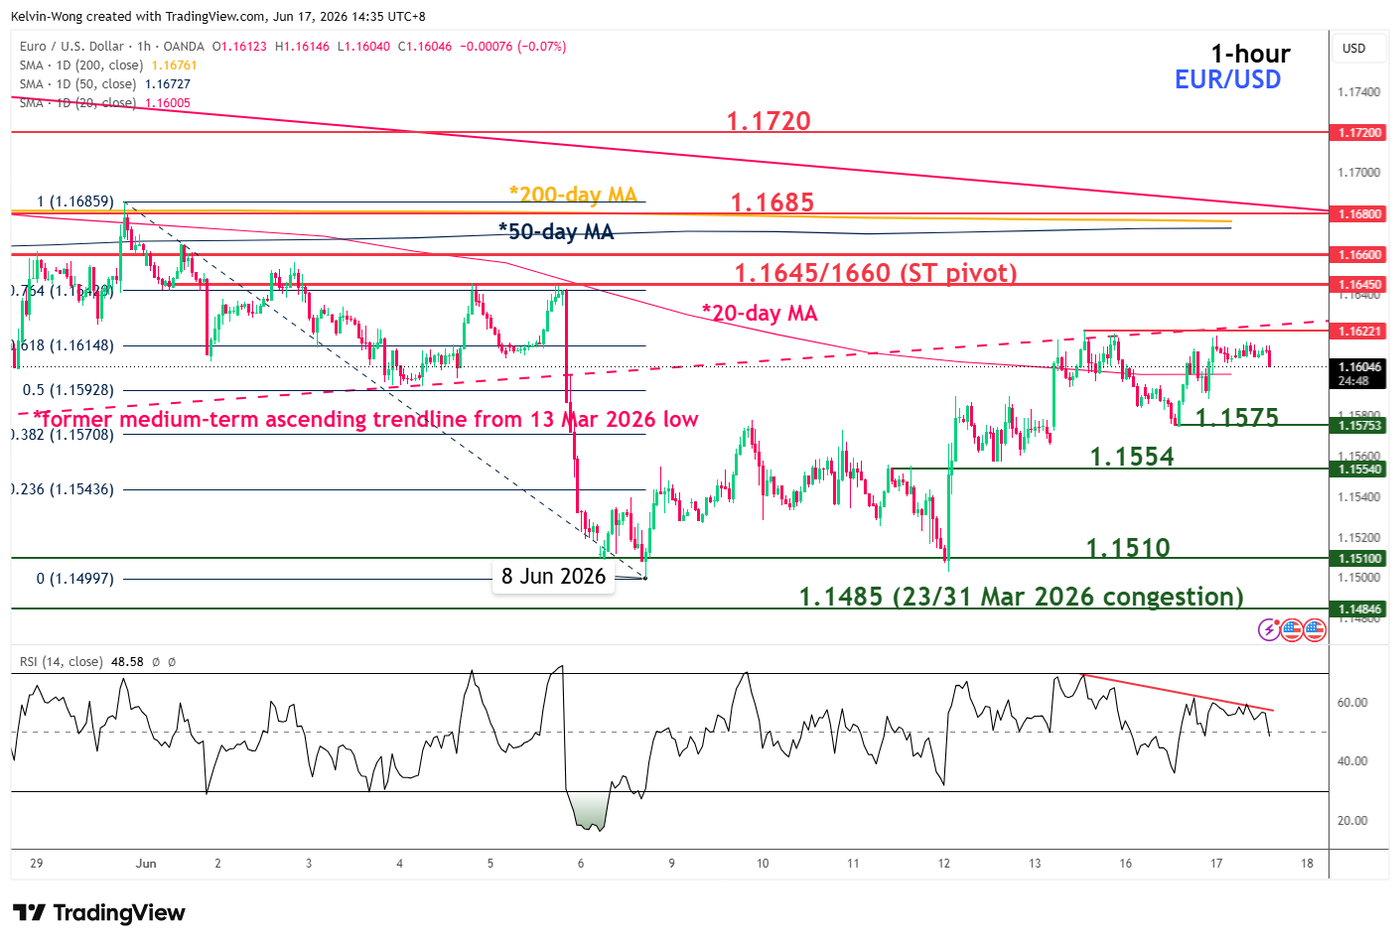
Fig. 2: EUR/USD minor trend as of 17 Jun 2026 (Source: TradingView). The information presented is historical information, and past performance is not indicative of future performance.
The EUR/USD is likely one of the “cleaner” Fed trades because it is highly sensitive to US interest-rate repricing and dollar direction (the euro has the largest weight in the US Dollar Index).
Watch the 1.1645/1660 short-term pivotal resistance to maintain the bearish bias; a break below 1.1575 (Tuesday, 16 June low) reinforces a potential drop towards the intermediate supports of 1.1554 and 1.1510 (minor range bottom of 8 June/12 June 2026) (see Fig. 2).
On the flip side, a clearance and an hourly close above 1.1660 would invalidate the bearish tone and extend the corrective rebound towards the next intermediate resistances at 1.1685 and 1.1720.
AUD/USD – Potential bearish reversal below 20-day moving average
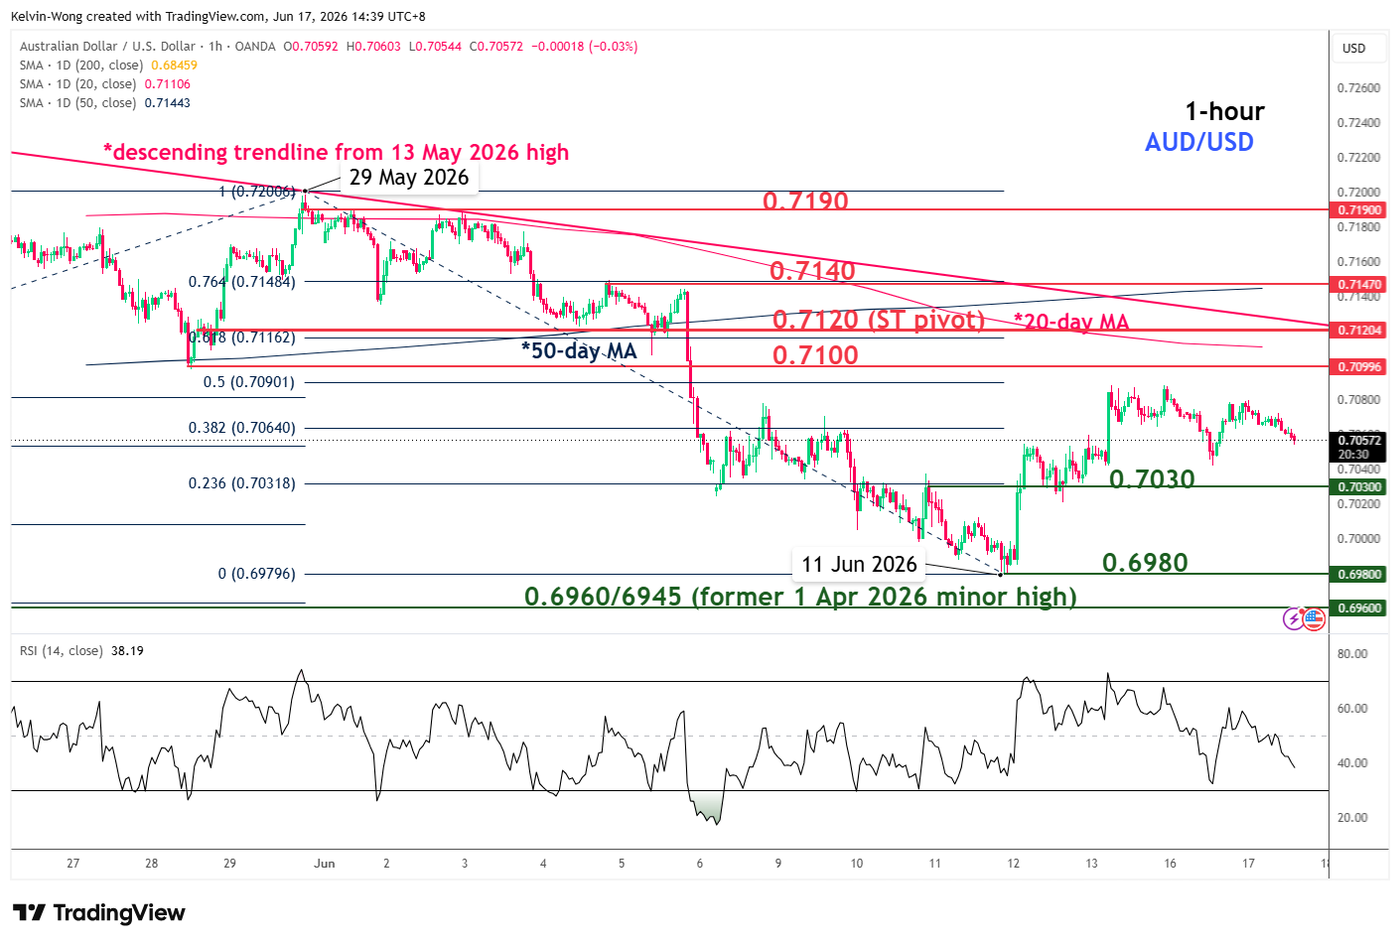
Fig. 3: AUD/USD minor trend as of 17 Jun 2026 (Source: TradingView). The information presented is historical information, and past performance is not indicative of future performance.
AUD/USD is probably the best high-beta FX expression of a hawkish Fed. The Australian dollar tends to weaken when US Treasury yields rise and global risk appetite wanes.
On Tuesday, 16 June 2026, the RBA kept its policy cash rate on hold at 4.35% after three consecutive rate hikes, but warned that the current interest rate hike cycle may be over, which provides some form of support for the Australian dollar, but a hawkish Fed is likely to tilt the macro narrative and dominate in the near-term
The recent minor corrective rebound seen on the AUD/USD from the 11 June 2025 low area of 0.6980 is now fast approaching an inflexion level of 0.7120 (the medium-term descending trendline in place since the 13 May 2026 high and 20-day moving average.
Watch the 0.7120 key short-term pivotal resistance for a potential bearish reversal. Breaking below 0.70300 (close to the ex-post RBA low of 0.7042) reinforces the bearish tone and exposes the next intermediate supports at 0.6980 and 0.6960/6945 in the first step (see Fig. 3).
However, a clearance and an hourly close above 0.7120 invalidate the bearish scenario for an extension of the corrective rebound towards the next intermediate resistance at 0.7140 (also the 50-day moving average), and possibly 0.7190 thereafter.
Nasdaq 100 – Losing bullish momentum
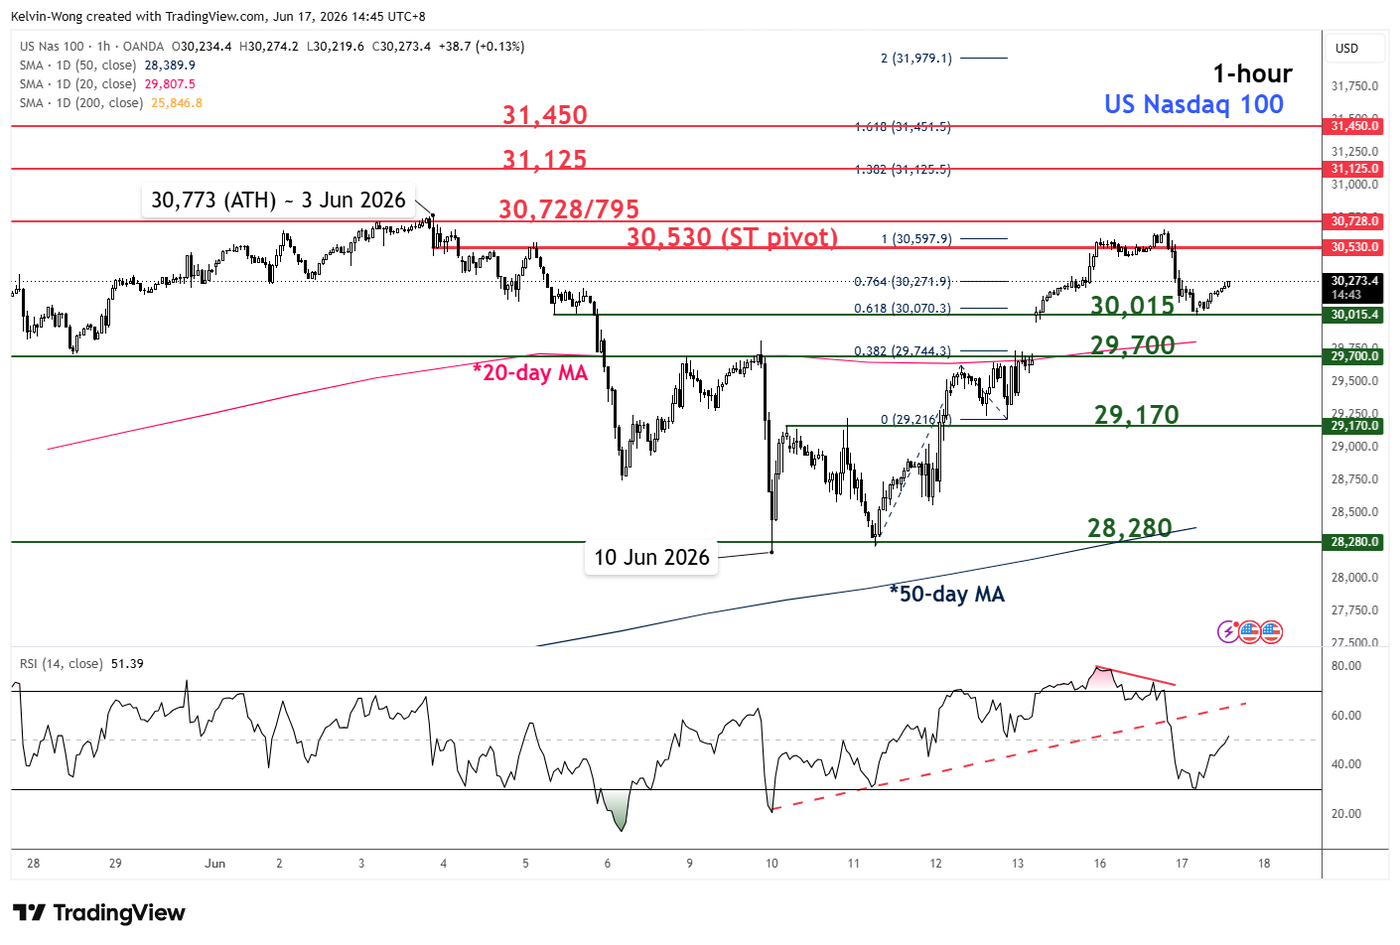
Fig. 4: US Nasdaq 100 CFD minor trend as of 17 Jun 2026 (Source: TradingView). The information presented is historical information, and past performance is not indicative of future performance.
The tech-heavy Nasdaq 100 is the most rate-sensitive of the major US benchmark stock indices. If the Fed removes its easing bias and the dot plot shifts higher (implying one rate hike in 2027), the Nasdaq 00 should underperform the Dow Jones Industrial Average and S&P 500.
Monday’s monstrous gap-up rally in the US Nasdaq 100 CFD (a proxy for the Nasdaq 100 E-mini futures), triggered by the US-Iran interim peace deal, has started to show signs of near-term bullish exhaustion below the current all-time high area of 30,728/795.
Watch the 30,530 key short-term pivotal resistance, with intermediate supports at 30,015 and 29,700 (also the 20-day moving average) (see Fig. 4).
A break below the critical 29,700 suggests that Monday’s gap-up is likely a bull trap, and the bears may gain the upper hand to push prices lower towards 29,170 and even the key medium-term support of 28,280 (also the 50-day moving average).
On the flipside, a break above 30,530 is likely to probe the current all-time high area of 30,728/795 (Tuesday, 16 June’s bearish reaction), and a clearance above 30,795 triggers a potential extension of the bullish impulsive up move sequence towards the next intermediate resistances at 31,125 and 31,450 (Fibonacci extension).
Fig. 5: Gold (XAU/USD) minor trend as of 17 Jun 2026 (Source: TradingView). The information presented is historical information, and past performance is not indicative of future performance.
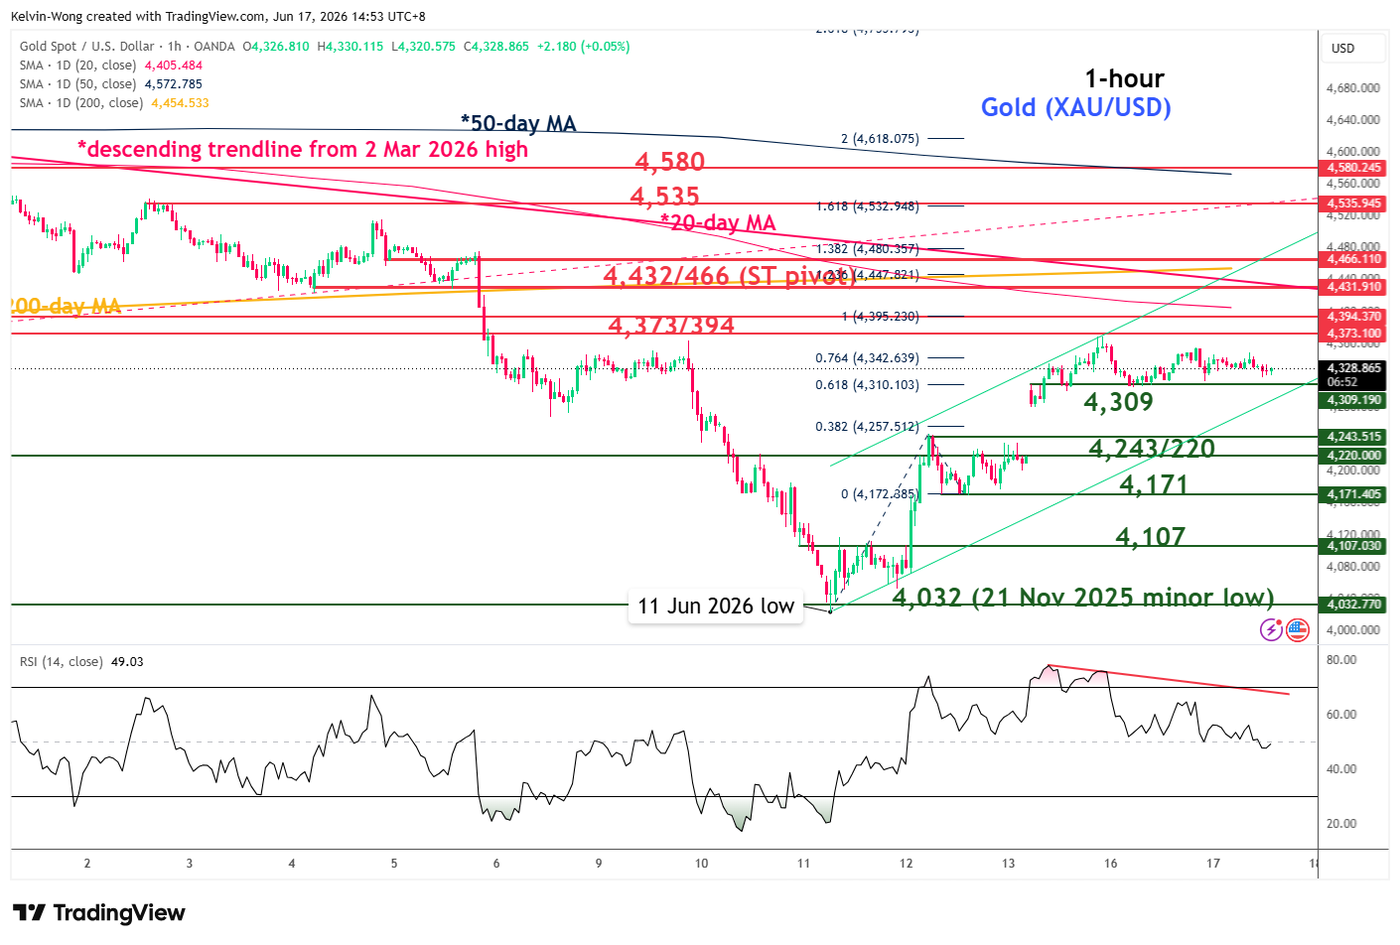
Gold is the clearest expression of this FOMC. A hawkish Fed means higher real yields, a stronger dollar, and lower demand for non-yielding assets. That is usually negative for gold.
The recent 8.6% minor corrective rebound of gold within its medium-term downtrend (still below the 20-day, 50-day, and 200-day moving averages) from the 11 June 2026 low has started to show bullish exhaustion, as evidenced by the bearish divergence condition flashed by the hourly RSI momentum indicator on Tuesday, 16 June 2026 (see Fig. 5).
Watch the 4,432/466 key short-term pivotal resistance for a potential bearish reversal; a break below 4,309 reinforces the bearish bias and exposes the next intermediate supports at 4,242/220 and 4,171 in the first step.
On the other hand, a clearance and an hourly close above 4,466 (also the 200-day moving average) may see a further squeeze up towards the next intermediate resistances at 4,535 and 4,580.
Gold Surges 2% Since Week Opening Amid Geopolitical Shifts and Fed Expectations
On Wednesday, spot gold (XAUUSD) hovered near 4,342 USD per troy ounce, logging a solid gain of over 2% since the beginning of the trading week. The precious metal continues to find strong fundamental support as global market participants increasingly price in a potential landmark peace agreement between the United States and Iran.
The geopolitical breakthrough is expected to lead to the full restoration of oil shipments via the strategic Strait of Hormuz, substantially lowering broader market anxieties regarding a renewed global inflationary spiral. Analysts anticipate that both nations will sign an interim accord in Switzerland as early as Friday. Preliminary details suggest the document encompasses major economic concessions for Iran, most notably the lifting of restrictions on crude oil exports.
In parallel to geopolitical developments, global investors remain intensely focused on the upcoming Federal Reserve monetary policy conclusion. While the market is almost fully pricing in unchanged interest rates, significant attention will be dedicated to the forward guidance and press conference delivered by the newly appointed Fed Chair, Kevin Warsh. His perspective on the future trajectory of monetary policy will be vital in setting expectations for the remainder of the year.
It is worth noting that other major central banks have already delivered their decisions this week. The Reserve Bank of Australia (RBA) opted to maintain its benchmark cash rate at 4.35%. In contrast, the Bank of Japan (BoJ) delivered a historic 25-basis-point hike, pushing its key policy rate to 1.0%—the highest level recorded since 1995.
For the gold market, the primary macroeconomic drivers continue to revolve around global central bank rate expectations, the performance of the US Dollar, and the fluid situation surrounding the US-Iran accord. Should geopolitical tensions continue to dissipate, investor focus is highly likely to pivot entirely back to the Federal Reserve's policy roadmap and long-term global inflation projections.
XAU/USD Technical Analysis
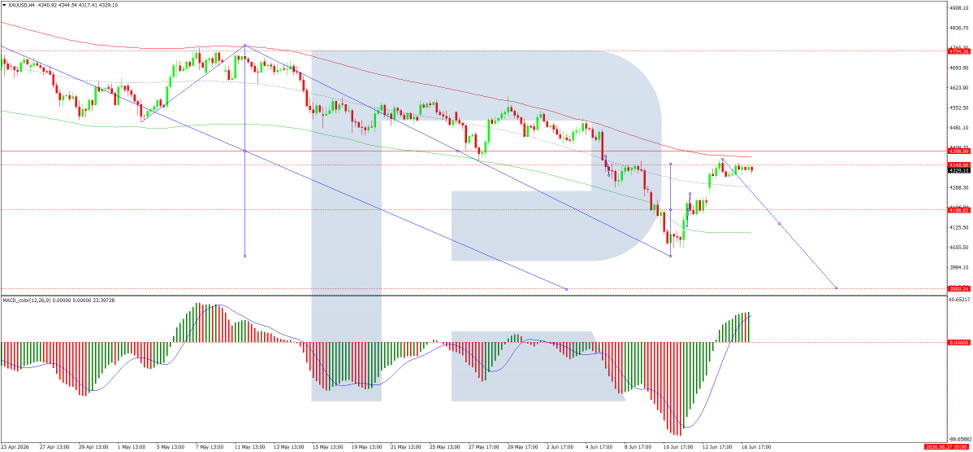 On the 4-hour chart, the XAUUSD pair has developed a distinct consolidation range centered around the 4,343 baseline level. The immediate tactical outlook projects a downside breakout from this range, targeting an initial drop toward 4,188.
Following the completion of this wave, the market may see a corrective recovery wave pointing to 4,277, before resuming its primary downtrend toward 4,088. The overarching trend continuation target sits at the psychological level of 4,000.
Technical Confirmation: The MACD indicator heavily supports this downward momentum. Its signal line is currently positioned at local highs well above the zero baseline and is pointing firmly downward, confirming a dominant bearish momentum.
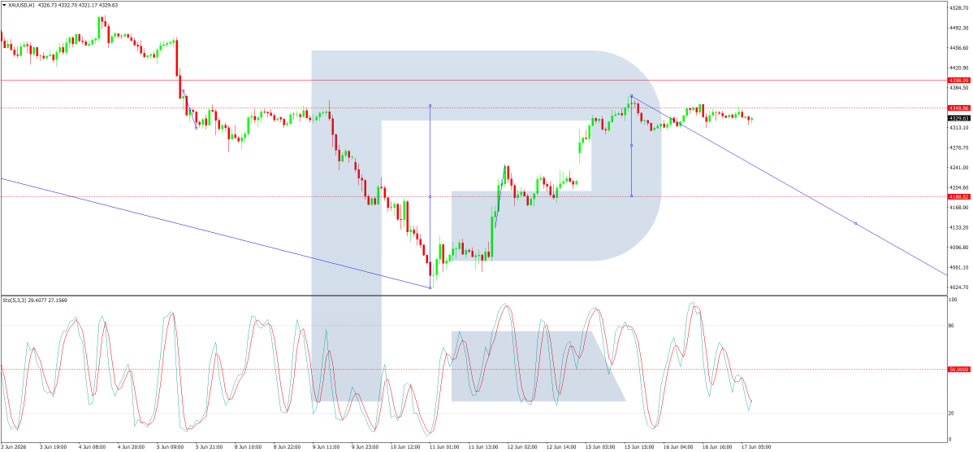
On the 1-hour chart, the market has successfully breached the support baseline at 4,348 downward, completing an initial wave of decline toward the 4,308 mark. Looking forward, the intraday bias favors a brief corrective bounce toward 4,354 to test the broken level from below.
Following this potential retest, a continuation of the bearish structure is expected to target 4,188, with a subsequent corrective growth expected back to 4,270.
Technical Confirmation: This intraday scenario is further validated by the Stochastic oscillator, where the signal line remains suppressed below the 50 median mark and continues to face selling pressure, pointing down toward the 20 oversold threshold.
Dollar Holds Near Key Levels Ahead of the Fed Verdict
The US dollar remains well supported against most major currencies, although the next phase of its movement will largely depend on the outcome of the Federal Reserve meeting. Investors are adopting a cautious stance ahead of the interest rate decision, the release of updated FOMC economic projections, and Jerome Powell’s press conference. Particular attention will be paid to policymakers’ forecasts, as these could reshape expectations regarding the number of potential rate cuts before the end of the year.
Market participants will also focus on a fresh batch of US economic data. Today’s retail sales figures are expected to provide further insight into the strength of consumer demand in the United States. Investors will also monitor Canada’s New Housing Price Index ahead of the Fed decision. While the Fed is widely expected to leave rates unchanged, the key driver for markets will be any signals regarding the future path of monetary policy and the timing of possible rate cuts.
USD/JPY
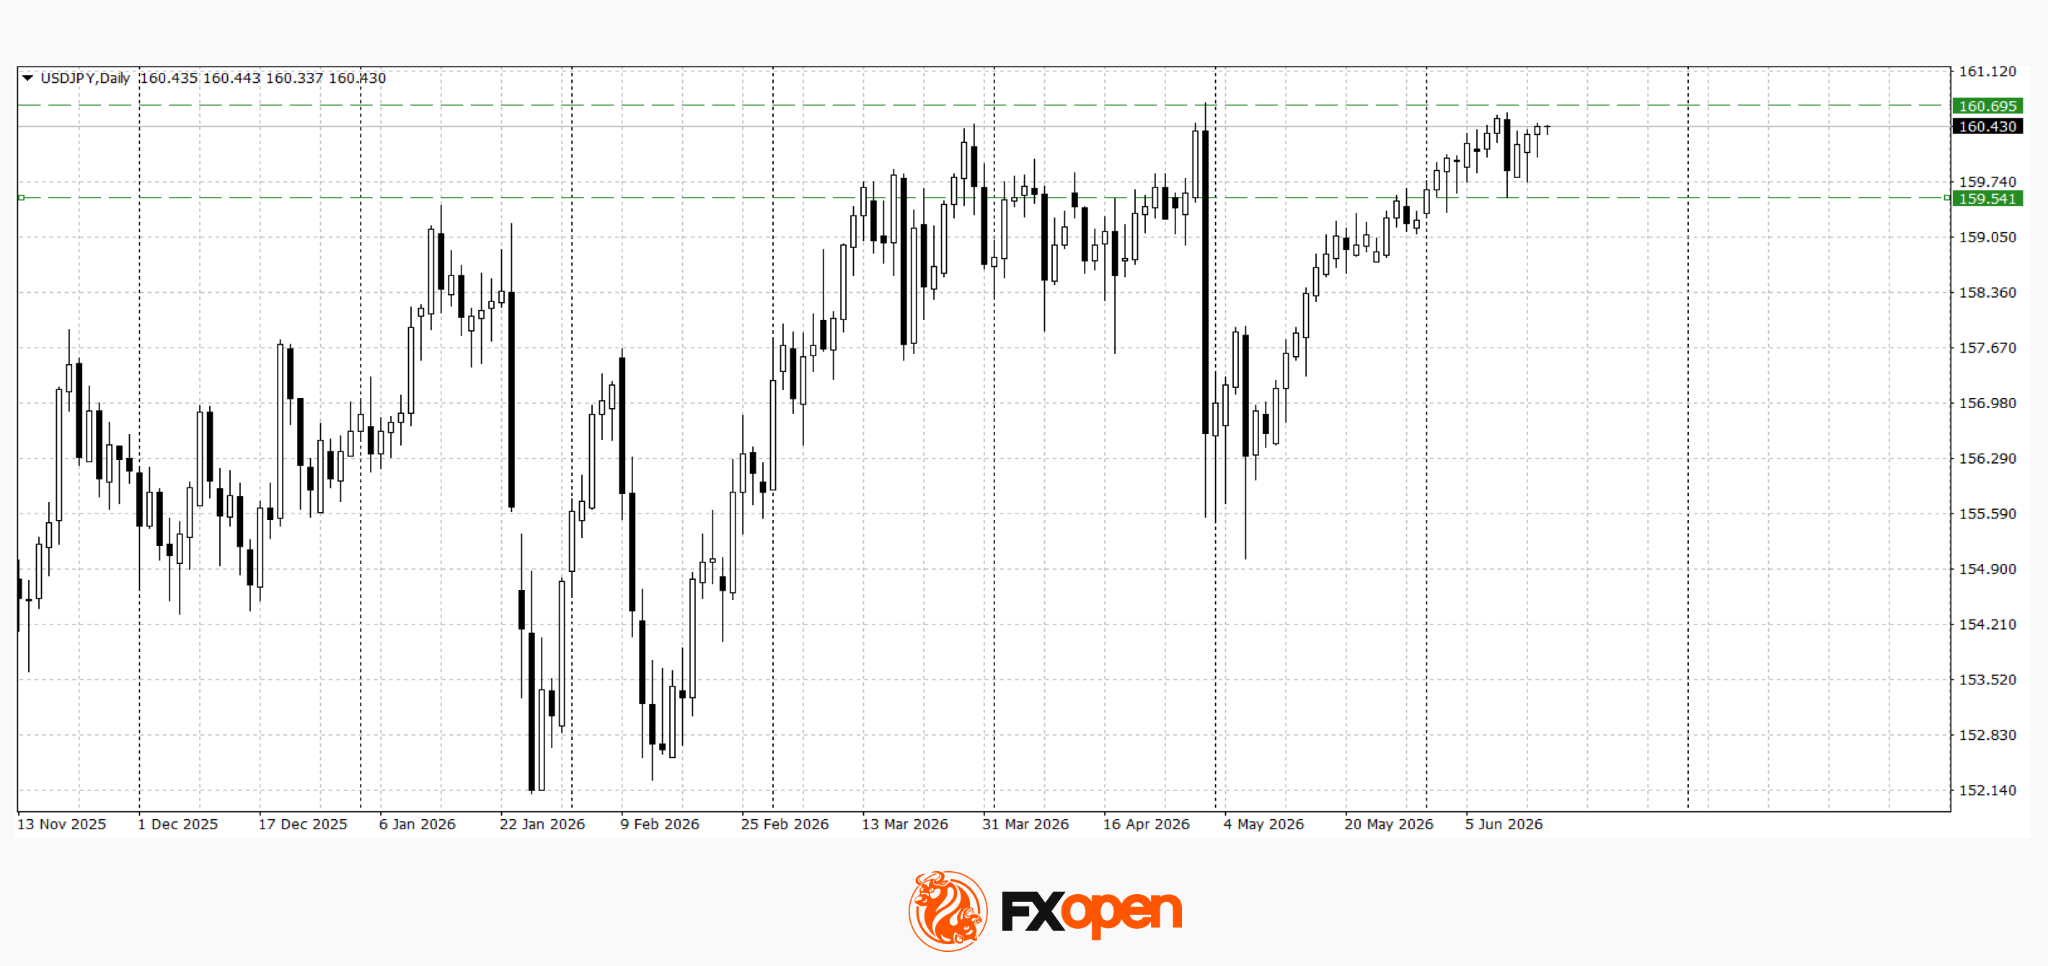
Sellers in USD/JPY managed to trigger a correction towards 159.50 last week. However, they failed to develop a sustained downward move, and the pair is once again trading above 160.00. Technical analysis of USD/JPY points to range-bound trading within the 159.50–160.70 corridor. It appears that investors require clearer guidance from the Fed regarding the future direction of monetary policy.
Key events for USD/JPY:
- Today at 15:30 (GMT+3): US Core Retail Sales;
- Today at 16:30 (GMT+3): speech by US President Donald Trump;
- Today at 21:00 (GMT+3): Federal Reserve interest rate decision.
USD/CAD
USD/CAD reached fresh yearly highs last week and tested the psychological resistance level at 1.4000. Following the breakout above the year’s previous peak, the pair has entered a consolidation phase within the 1.3950–1.4020 range. A sustained move below 1.3950 could trigger a corrective decline towards the 1.3850–1.3900 area. Conversely, a decisive break and close above 1.4000 could pave the way for further gains towards the next significant resistance zone near 1.4130.
Key events for USD/CAD:
- Today at 15:30 (GMT+3): Canada New Housing Price Index;
- Today at 17:30 (GMT+3): US Crude Oil Inventories;
- Tomorrow at 15:30 (GMT+3): Canada Raw Materials Price Index (RMPI).
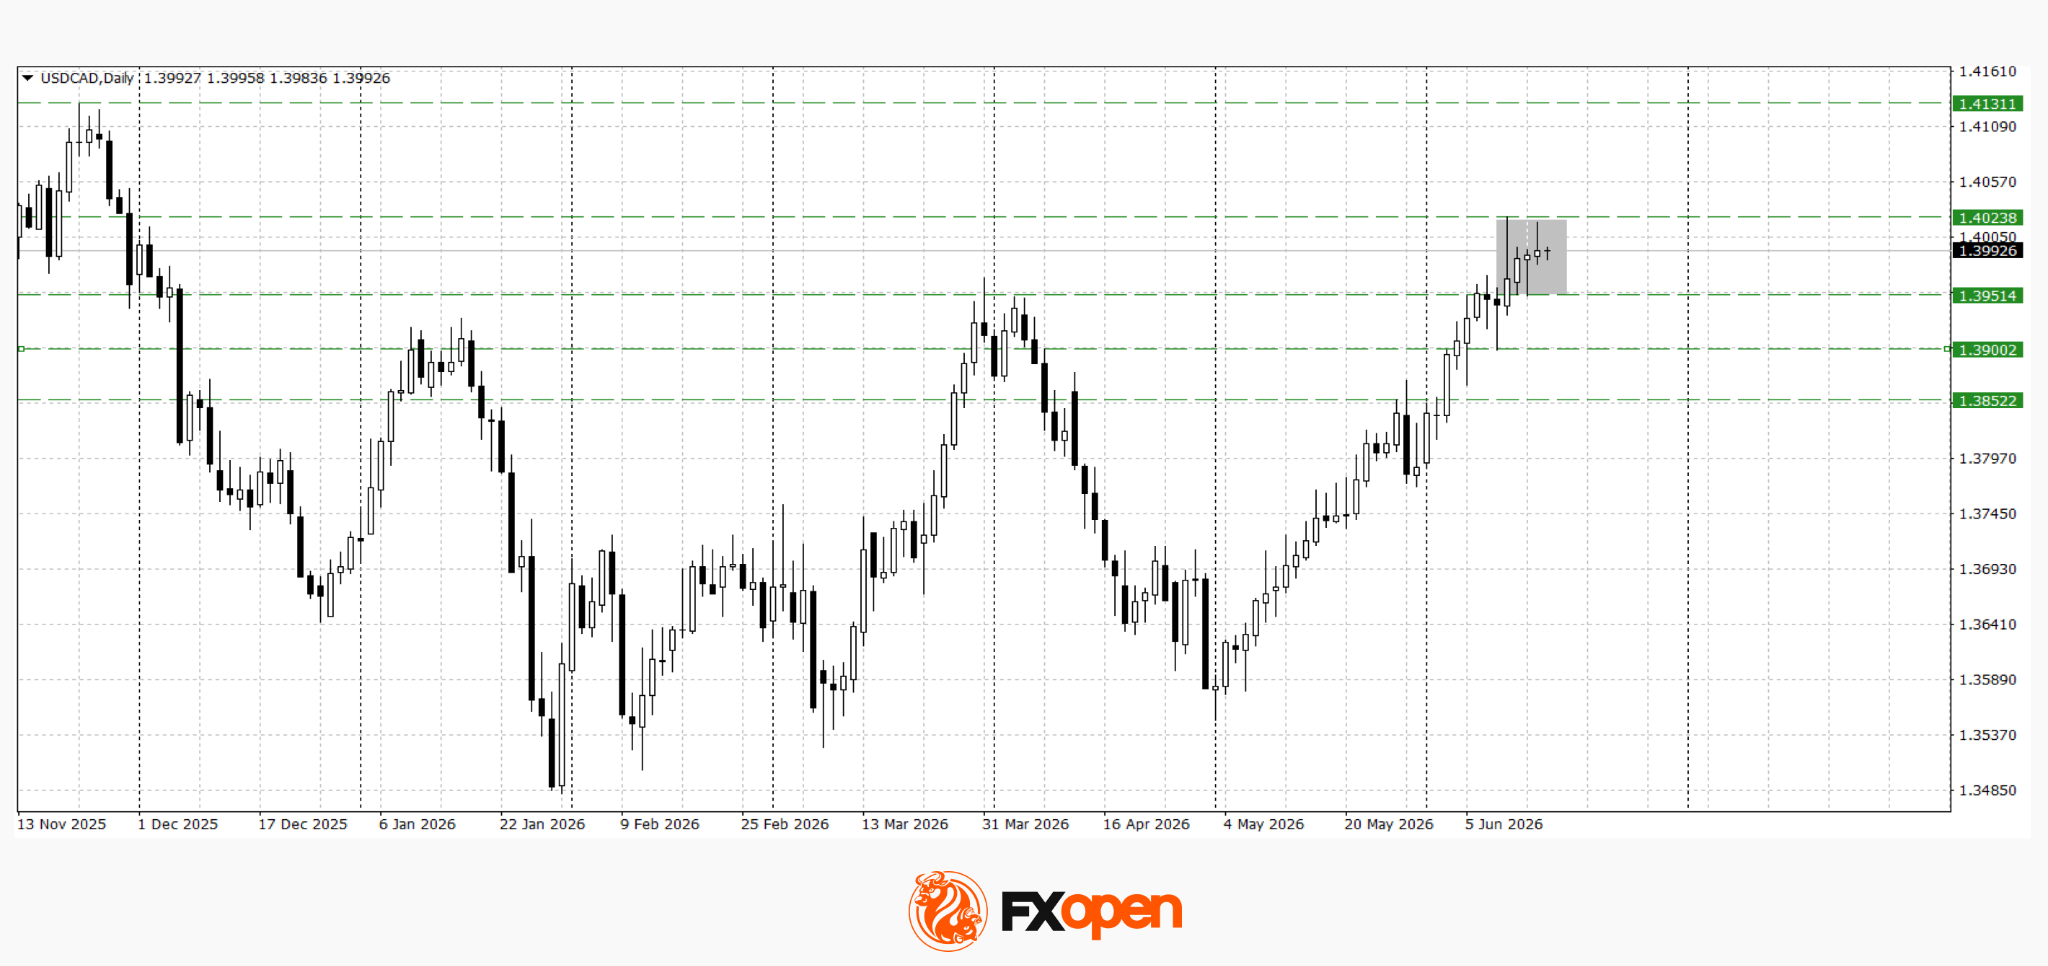
The dollar remains close to important technical levels against both the Japanese yen and the Canadian dollar, but the next directional move is likely to be determined by the outcome of the Federal Reserve meeting. Should the Fed maintain a hawkish tone and reaffirm its cautious approach to rate cuts, USD/JPY and USD/CAD may extend their gains and attempt to break through current resistance levels. A more dovish message from Powell, however, could encourage profit-taking in the dollar and lead to a corrective pullback following the strong rally seen in recent weeks.
Trade over 50 forex markets 24 hours a day with FXOpen. Take advantage of low commissions, deep liquidity, and spreads from 0.0 pips (additional fees may apply). Open your FXOpen account now or learn more about trading forex with FXOpen.
This article represents the opinion of the Companies operating under the FXOpen brand only. It is not to be construed as an offer, solicitation, or recommendation with respect to products and services provided by the Companies operating under the FXOpen brand, nor is it to be considered financial advice.
Sunrise Market Commentary
Markets
The FOMC concludes its first meeting under new Chair Warsh tonight. The new policy statement is expected to drop the slightly dovish bias that was still present in April, even though it already faced considerable resistance and dissent at that meeting. The specific sentence — “In considering the extent and timing of additional adjustments to the target range for the federal funds rate, the Committee will carefully assess incoming data, the evolving outlook, and the balance of risks.” — suggests that the next move would be a rate cut, reflecting the previous policy trajectory before the pause.
Recent US economic data have shifted the Fed's focus from downside employment risks toward upside inflation risks. The US economy has begun to outperform, with the labor market moving beyond its earlier “no hire, no fire” dynamic and returning to net hiring. The three-month average payroll gain of 188k is the strongest since March 2024. Inflation is moving further away from target as the energy supply shock continues to work its way through the economy. PCE inflation reached 3.8% y/y on the headline measure and 3.3% y/y on the core measure in April, while May CPI data pointed to further pressure ahead.
The updated Summary of Economic Projections is expected to reflect these developments, with Fed officials' rate forecasts (the dot plot) likely showing a more hawkish shift. In March, the median projection still suggested one additional rate cut this year and another in 2027. By contrast, money markets are currently pricing in one rate hike over the next 12 months. The overall Fed message is expected to reinforce support for the front end of the US yield curve and could provide support for the dollar.
Today's dot plot may prove to be the final version published by the Fed if one of Warsh's first major initiatives is to overhaul the current communication framework. Warsh has argued that tools such as the dot plot and forward guidance create unnecessary volatility in a post-ZIRP environment. He has also expressed a preference for economic projections produced by staff economists, similar to the Eurosystem model, rather than projections based on individual policymakers' assumptions. Other potential changes include reducing the frequency of press conferences and limiting public remarks by policymakers.
Today's economic calendar also features the ECB wage tracker, an important indicator for assessing whether higher prices are feeding through into wage growth. Recent ECB commentary has emphasized that the end of the Iran conflict should not be confused with the end of the energy shock. Policymakers continue to lean toward at least one additional rate hike in the near term before reassessing conditions.
ECB Chief Economist Lane noted yesterday that Eurozone inflation is likely to remain above 3% for four months because of energy costs, with indirect effects on food, goods and services expected later this year and into next year.
UK CPI data for May released this morning were mixed. Headline CPI rose 0.2% m/m and remained at 2.8% y/y, below the expected 3.0%. Core CPI increased from 2.5% to 2.6%, slightly below consensus expectations of 2.7%, while services inflation accelerated from 3.2% y/y to 3.7% y/y, above the expected 3.6%. Sterling weakened modestly following the release, with EUR/GBP trading near 0.8650.
US retail sales will also be published today, although they are unlikely to generate significant market reaction ahead of the FOMC decision.
News & Views
According to a draft memorandum between the US and Iran seen by Bloomberg, Iran will receive substantial financial and economic support as part of the agreement that is expected to be signed by both countries. The deal is intended to establish a framework for resolving Iran's nuclear program and ending the Strait of Hormuz blockade.
The United States and regional partners are reportedly preparing a comprehensive rehabilitation and economic development plan for Iran, with financing of at least USD 300 billion. The US is also expected to lift all sanctions currently imposed on Iran. Immediately after the memorandum is signed and before sanctions are formally removed, the US would issue waivers allowing Iranian exports of crude oil and other goods and services.
The US would also commit to facilitating access to frozen Iranian assets and restricted funds, although no specific timetable has yet been provided.
Japanese trade data showed a deficit of JPY 378.6 billion in May, compared with a surplus of JPY 301.9 billion in April on an unadjusted basis. Imports rose 12.5% y/y while exports increased 17.0% y/y. However, both series were distorted by yen weakness, which boosted the value of both imports and exports.
Export volumes increased by only 0.5% y/y, while import volumes declined by 6.8%. In volume terms, exports to the US rose 9.3% y/y and imports from the US increased 12.5%. Trade with Europe was weaker, with export volumes rising just 0.7% y/y while import volumes declined 7.2%.
UK Inflation Holds at 2.8% as Goods Disinflation Offsets Services Pressure
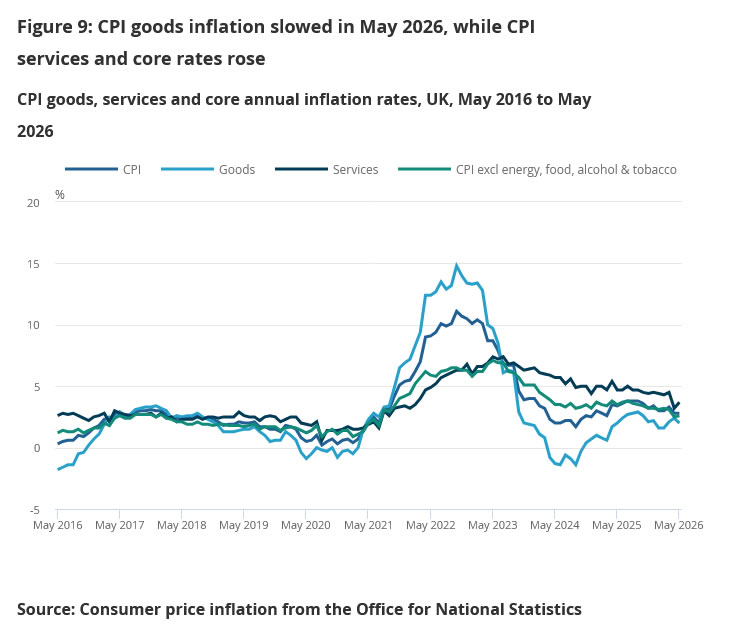
UK inflation data offered some relief ahead of this week's Bank of England meeting, with headline CPI holding steady at 2.8% yoy in May, below expectations for a rise to 3.0% yoy. On a monthly basis, CPI slowed sharply from 0.7% mom to 0.2% mom, also undershooting forecasts of 0.4% mom. Core inflation edged higher from 2.5% yoy to 2.6% yoy, but came in below the expected 2.7% yoy.
The details suggest inflation pressures are becoming increasingly concentrated in services. The annual rate for CPI goods slowed from 2.4% yoy to 2.0% yoy. In contrast, services inflation accelerated from 3.2% yoy to 3.7% yoy, highlighting the continued influence of domestic wage and labor-cost pressures. For policymakers, that divergence is likely to reinforce the view that imported and goods-related inflation is easing while underlying domestic inflation remains more persistent.
| Indicator | Apr 2026 | May 2026 | Expected |
|---|---|---|---|
| CPI M/M | 0.7% | 0.2% | 0.4% |
| CPI Y/Y | 2.8% | 2.8% | 3.0% |
| Core CPI Y/Y | 2.5% | 2.6% | 2.7% |
| CPI Goods Y/Y | 2.4% | 2.0% | |
| CPI Services Y/Y | 3.2% | 3.7% |
Producer price data painted a similarly mixed picture. Input PPI slowed from 2.6% mom to 2.4% mom and rose from 7.9% yoy to 8.7% yoy, while output PPI eased from 1.5% mom to 1.4% mom and slipped from 4.1% yoy to 4.0% yoy. Meanwhile, core output inflation slowed from 2.6% yoy to 2.3% yoy, suggesting some moderation in pipeline inflation pressures despite elevated input costs.
Overall, the report is unlikely to materially alter expectations for Thursday's BoE decision, where rates are widely expected to remain unchanged. However, the softer-than-expected headline and core readings reduce the urgency for policymakers to move quickly toward another rate hike. While services inflation remains uncomfortably high, the broader inflation picture does not appear to be accelerating as rapidly as feared, supporting the case for patience while the Monetary Policy Committee assesses incoming data.
Riksbank and Fed Expected to Stay on Hold, with Focus on First Warsh-Led Meeting
In Focus Today
In the US, new Fed Chair Kevin Warsh will hold his first press conference following the FOMC meeting. We expect the policy rate to remain unchanged at 3.75%, in line with market pricing. The focus will be on Warsh's policy leanings, his assessment of the economy, and any indications of changes to Fed communication and operating practices. Even if Warsh proves relatively dovish, we still expect the distribution of rate projections to shift higher compared with March.
In Sweden, we expect the Riksbank to leave its policy rate unchanged at 1.75%, with attention focused on the updated rate path. Our base case remains a higher probability of rate hikes during the second half of 2026, with the Q4 2026 policy rate averaging 1.9%, broadly consistent with market pricing. We will closely monitor the updated projections and Governor Thedéen's communication for signals regarding the likelihood of further tightening. We continue to expect rate increases in September and December.
On the final day of the G7 summit, leaders will focus on securing critical mineral supply chains, a key theme of France's presidency, alongside broader efforts to address global economic imbalances. France's push for a joint statement follows last year's Chinese export restrictions, which exposed Western vulnerabilities. Policy options under discussion include price supports, common standards and targeted subsidies, representing early steps toward reducing dependence on China without triggering a broader trade rupture.
In the Eurozone, final HICP inflation data for May will be released. The flash estimate showed a surprisingly strong services inflation reading of 0.5% m/m seasonally adjusted. The final release will provide important details on whether this was a one-off development or a broader pickup in inflation momentum, which will be relevant for the ECB outlook.
In the UK, May CPI data will be published ahead of Thursday's BoE meeting. Although the UK has been on a disinflationary trend since autumn, recent PMI surveys suggest that price pressures increased significantly during the spring.
Economic and Market News
What Happened Overnight
The US-Iran agreement continues to leave major questions unresolved. Some details have emerged, with President Trump stating that the framework will prevent Tehran from obtaining nuclear weapons, while US officials indicated that Iran will be permitted to resume oil exports once the agreement is formally signed. Trump has pledged to publish the text, although US officials have suggested that several key commitments remain contained in private channels, raising concerns about transparency. Israel maintains that it is not bound by the agreement, while hostilities involving Hezbollah continue. G7 partners have also highlighted verification risks. Markets have responded by reducing the oil risk premium, but the durability of the ceasefire remains uncertain.
In energy markets, Brent crude has fallen below USD 79/bbl, its lowest level in three months, as markets price in a potential reopening of the Strait of Hormuz and weaker physical demand following the preliminary US-Iran agreement. The decline has been concentrated at the front end of the curve, with one-year Brent still trading near USD 75/bbl, broadly in line with pre-war levels. Polymarket estimates continue to imply roughly a 60% probability of normal shipping traffic through the Strait by the end of July. However, low inventories and ongoing geopolitical risks may limit further downside. European natural gas prices have also weakened, with front-month TTF contracts falling around 5% on reduced supply concerns.
What Happened Yesterday
In Germany, the ZEW economic sentiment index improved sharply in June, rising to 10.5 from -10.2 in May, as investors became more optimistic about easing tensions in the Iran conflict and a moderation in inflation pressures. However, the current conditions index deteriorated further to -81.0 from -77.8, highlighting that assessments of the present economic environment remain very weak despite the improvement in expectations.
In Sweden, the NIER's latest forecast pointed to a continued recovery in the economy, supported by improving consumer and business sentiment and rising resource utilization. Firms' pricing plans suggest that tax cuts may dampen inflation during 2026 before price pressures gradually re-emerge, leaving inflation slightly above, but still close to, the Riksbank's target. These survey-based indicators remain important inputs for monetary policy assessments.
Equities: Global equities were generally lower on Tuesday. US markets surrendered part of Monday's gains, with the S&P 500 declining 0.6%, while the Stoxx 600 gained 0.3% as European markets continued to catch up. Technology stocks underperformed significantly, with AMD, Micron and Intel all falling more than 7%. Volatility in semiconductors and memory-related stocks therefore remained elevated. Nevertheless, the Philadelphia Semiconductor Index still closed near its early-June highs and remains around 15% higher over the past month.
Despite the weakness in technology shares, market action did not resemble a classic risk-off session. Cyclical sectors generally performed well, with financials, utilities, industrials and materials gaining between 0.5% and 1.0%. Asian equities also traded higher overnight, with Korean and Japanese markets advancing between 0.5% and 1.0%, while US futures pointed to a modestly firmer open.
FI and FX: Although Brent crude has slipped below USD 79/bbl, front-end yields have not followed oil lower. Yield curves experienced a modest bull-flattening move yesterday, while overnight changes in US Treasury yields and German bond futures were limited. EUR/USD traded in a narrow range around 1.1600 as investors waited for Kevin Warsh's first public appearance as Fed Chair following tonight's FOMC decision. We do not expect Warsh to provide firm forward guidance regarding future rate moves or to signal immediate changes to balance-sheet policy. In Sweden, we expect the Riksbank to leave rates unchanged at 1.75%, although we anticipate an upward revision to the policy-rate path. Our base case remains for increased probabilities of rate hikes during the second half of 2026, with September and December remaining our preferred timing for further tightening.
EURGBP Wave Analysis
EURGBP: ⬆️ Buy
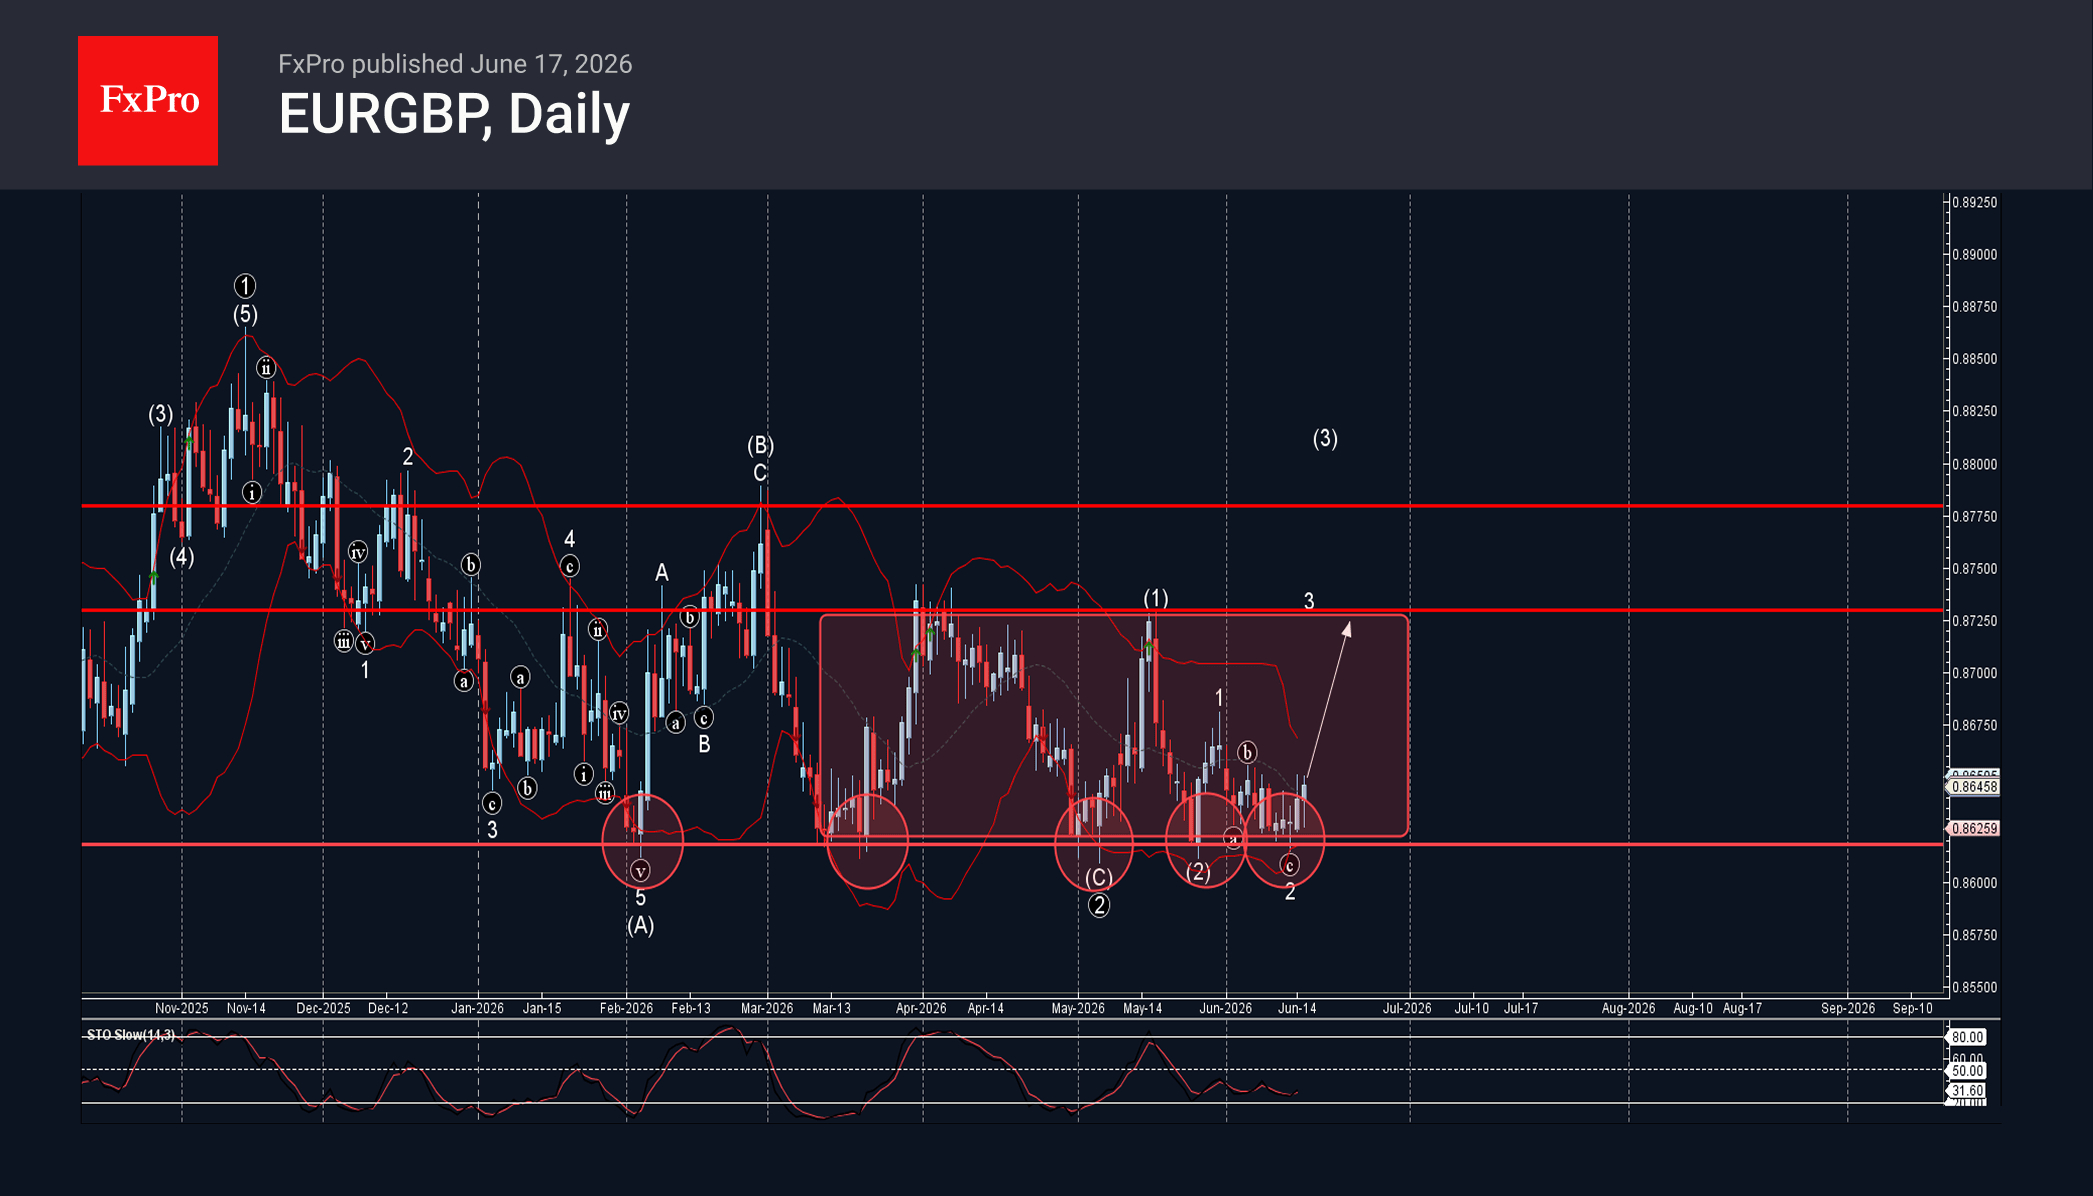
– EURGBP reversed from support zone
– Likely to rise to resistance level 0.8725
EURGBP currency pair recently reversed from the support zone between the strong support level 0.8620 (which has been reversing the price from February, can be seen below) and the lower daily Bollinger Band.
The support level 0.8620 is also the lower border of the narrow sideways price range inside which this currency pair has been moving from March.
Given the strength of the support level 0.8620, EURGBP currency pair can be expected to rise to the next resistance level 0.8725.
DOW Hits Record High as Falling Oil Prices Offset Fed Fears
The DOW is sending a very different message from the rest of Wall Street. While the S&P 500 and NASDAQ spent much of the past two sessions showing signs of caution ahead of today's FOMC rate decision, the DOW Jones Industrial Average pushed to a new record high. Under normal circumstances, traders would be reluctant to chase stocks higher with inflation still elevated and a potentially hawkish Fed just hours away. This time, however, another force appears to be dominating the calculation: oil.
The collapse in crude prices following the US-Iran peace breakthrough has dramatically changed the outlook for large parts of the traditional economy. Brent crude has fallen below USD 80 as markets increasingly price the reopening of the Strait of Hormuz and the gradual restoration of normal energy flows. For industrial companies, transport firms and manufacturers that make up much of the DOW, lower energy costs effectively act as a tax cut. Investors appear convinced that this benefit is large enough to offset the threat posed by a moderately hawkish Fed.
That explains why the DOW's rally has continued even as traders prepare for one of the most important policy decisions of the year. The Fed is widely expected to leave rates unchanged at 3.50%-3.75%, and there is little room for surprise in the rate decision itself. With ultra-dove Stephen Miran having left the committee to allow Kevin Warsh to become Chair, as Jerome Powell stays as Governor, no member is expected to advocate a cut. Equally, recent comments from the committee's hawkish wing suggest it is not yet ready to argue for an immediate rate hike. Hence, the decision will very likely be unanimous.
Fed funds futures currently imply roughly a 60% chance of one or more rate hikes by the end of the year, suggesting investors retain a hawkish bias but little conviction about the eventual outcome. Economists are even more skeptical that tightening will be required. In a recent Reuters survey, 72 of 102 economists, or around 70%, forecast that the federal funds rate will remain unchanged in the current 3.50%-3.75% range through the end of 2026.
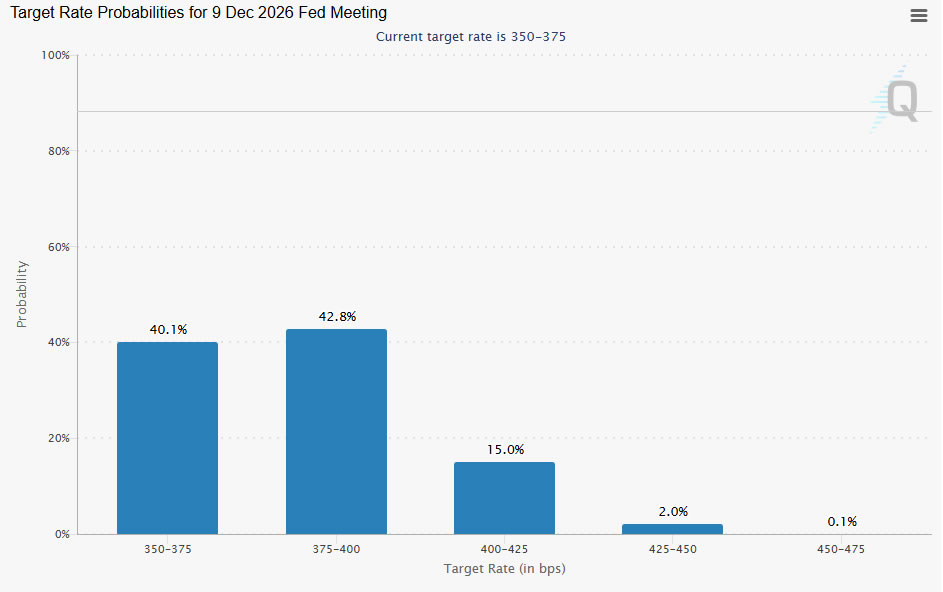
So, the focus instead falls on the statement, the dot plot and Warsh's first press conference.
Markets broadly expect the Fed to remove the easing bias that previously implied the next move would likely be a cut. The median projection is also expected to shift from one rate cut this year to no change through the end of 2026. Neither development would fundamentally shock investors because both are already largely reflected in market expectations.
The real risk lies deeper in the dot plot. Two or three rate-hike projections would likely be dismissed as the views of the committee's usual hawks. Four or more hike dots would be much harder to ignore. At that point, investors may begin to question whether the Fed is moving from a "higher for longer" stance toward actively contemplating further tightening. That would represent a much more serious challenge for risk assets.
Warsh's press conference could prove equally important, although there is a twist. Markets want clarity on whether he views the recent inflation surge as a temporary energy shock or the beginning of a broader second-round inflation problem. Yet Warsh has spent years arguing that central bankers should speak less, not more. Investors may spend weeks preparing questions only to discover he has little interest in providing detailed answers.
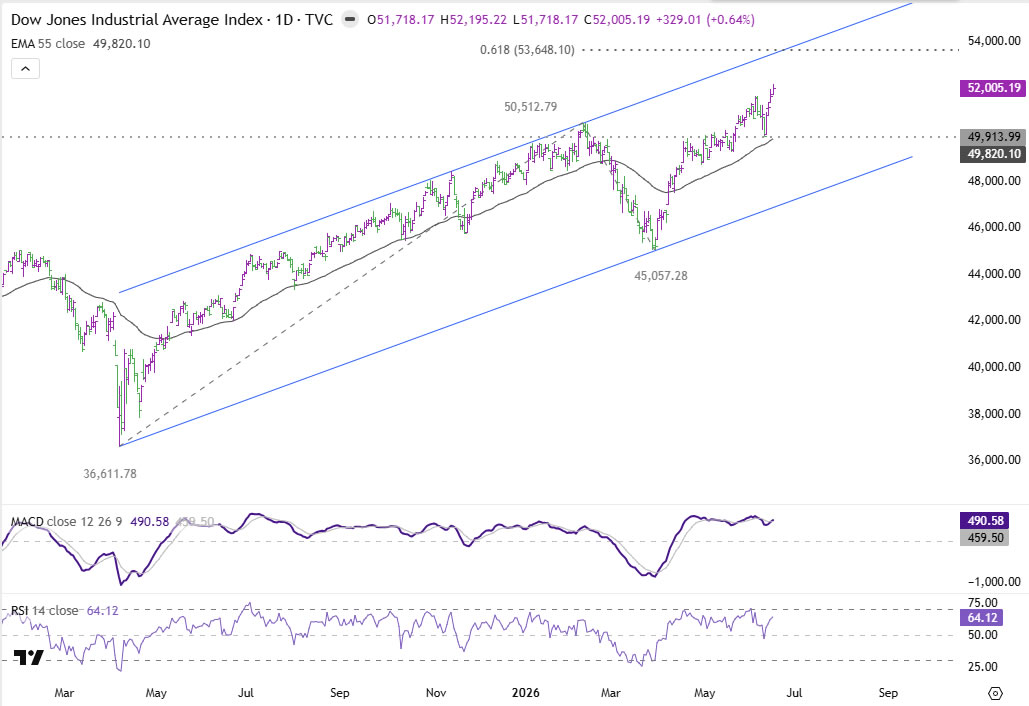
Technically, the DOW's trend remains firmly higher. As long as support at 49,913 holds, the advance from last year's lows remains intact and points toward the next major target at 61.8% projection of 36,611 to 50,512 from 45,057 at 53,648. Falling oil prices have given the index a powerful tailwind just as the market approaches a critical Fed meeting. Unless policymakers signal they are seriously contemplating another rate hike, cheaper energy may continue to matter more than tighter monetary policy.