Sample Category Title
Dow Jones Nears 50,000! Will Stock Market Bulls Ever be Defeated?
- US Stock Markets are continuing their breakouts to ever-fresher highs, but short-term profit-taking seems to be ruining the party
- The Dow Jones could retake 50,000 in today's session barring no weekend-safety trading
- Exploring Technical Levels for the Dow Jones, Nasdaq and S&P 500
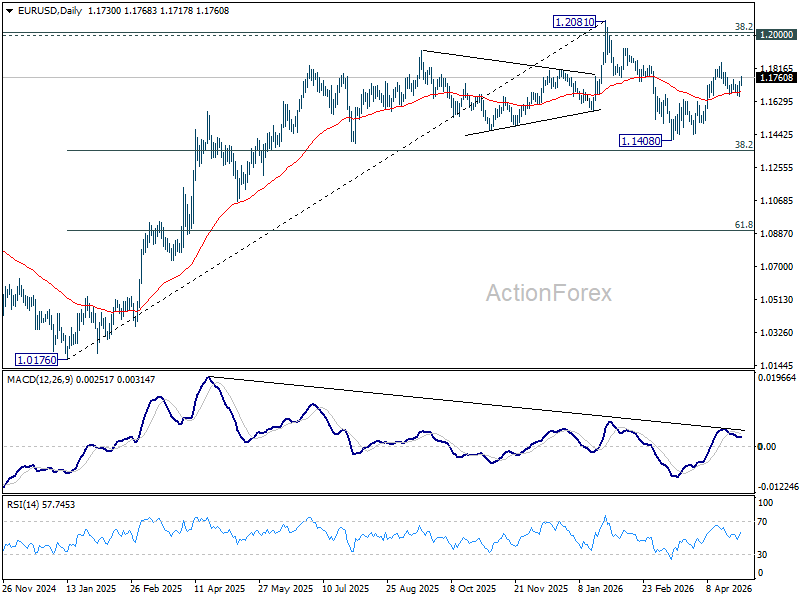
US Stock Markets have been on a rampage after this week's earnings, and this trend is pushing Indexes to some new highs.
Yesterday saw the return of traditional assets demand, sweeping everything on their way and taking the Dow Jones up 1,000 points in one session, propelled by Caterpillar and Eli Lilly.
As the week concludes, the rally is now more broad based, with all US Indexes rising by similar percentages – Some signs of fatigue could be appearing, with some pullbacks from morning highs.
Daily Stock Market Index Performance – May 1, 2026. Source: TradingView
The only main concern that traders could see is the inability from Bulls to break the 50,000 level – If this level breaks in the afternoon session, this will bring with it further optimism signs for next week's action.
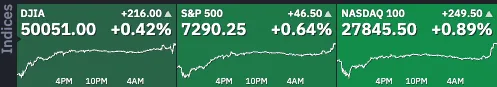
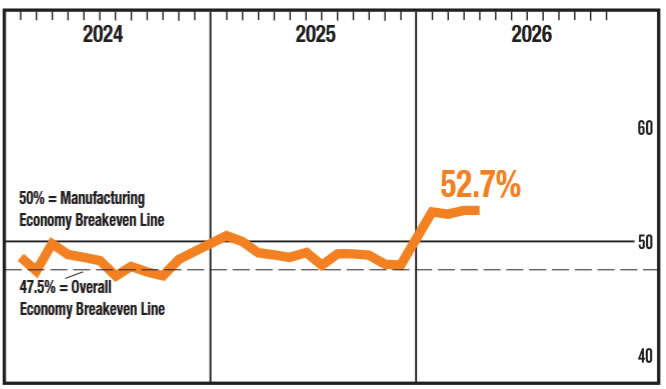
Markets just received the US Manufacturing PMI report for April, and while it did not ease much, there are still concerns of the Index being driven by fears of supply droughts, hence pre-emptive orders all around the sector – The report came in at 52.7, the same as last month.
Manufacturing PMI Data – MarketPulse Economic Calendar
Overall, with the earnings season continuing to break records and the Federal Reserve reluctant to turn to hikes, the only catalyst left to bring Markets lower is the absence of solution between Iran and the US.
The situation has been in a deadlock since the first round of talks failed, with the Ceasefire extension bringing back some life into dull Markets but no solution on the horizon.
Crude Oil was falling off a cliff in early Morning trading but is not bouncing back higher, unable to break below $100 per barrel – Some concerns on that part, particularly with the price action looking more cloudy as the session continues.
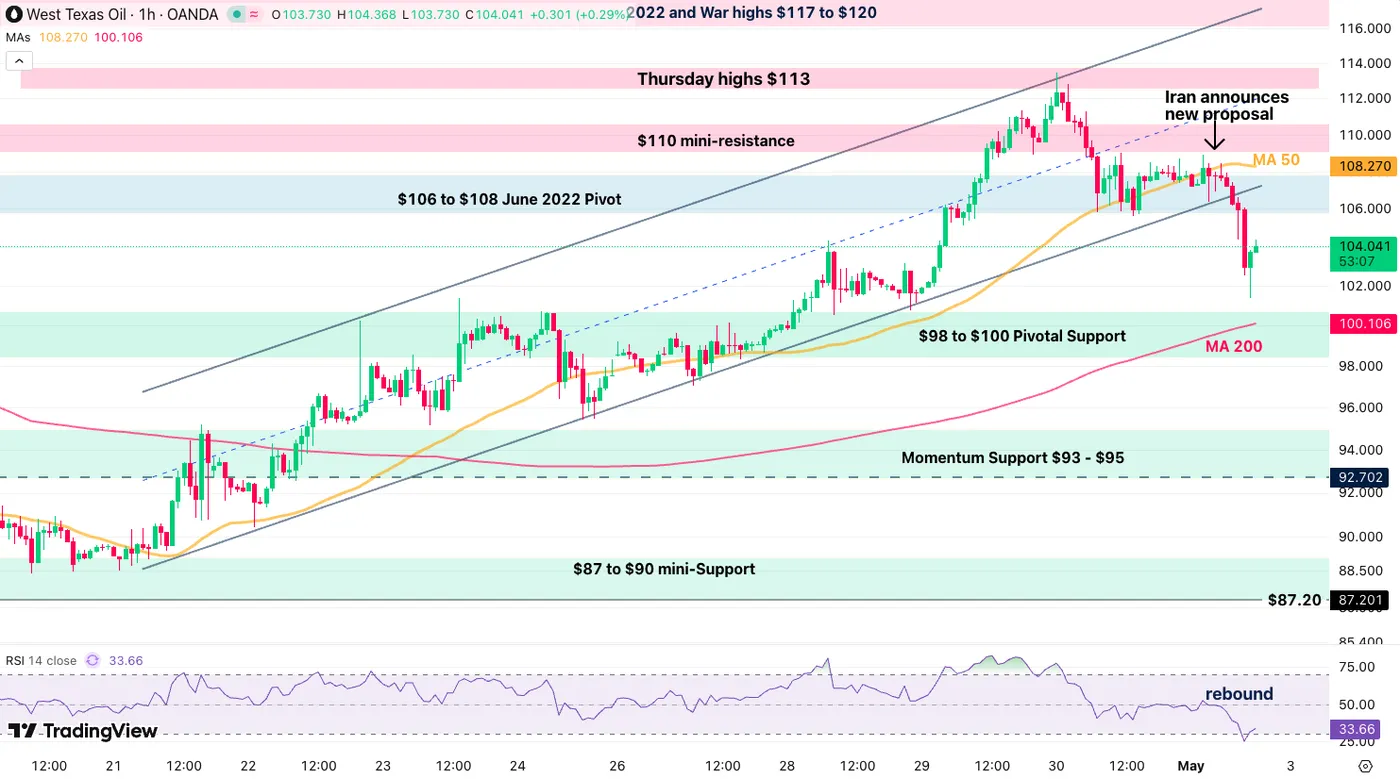
Crude Oil 1H Chart – May 1, 2026 – Source: TradingView
The drop in Crude Oil after the announcement of a new Iranian proposal has now begun to reverse to the upside – For Stock Markets to continue to rally, a break of the $100 level will be mandatory (look at the 200-Hour MA).
Let's dive right into intraday charts and trading levels for the Dow Jones Industrial Average, Nasdaq Composite, and S&P 500.
Current Session's Stock Heatmap
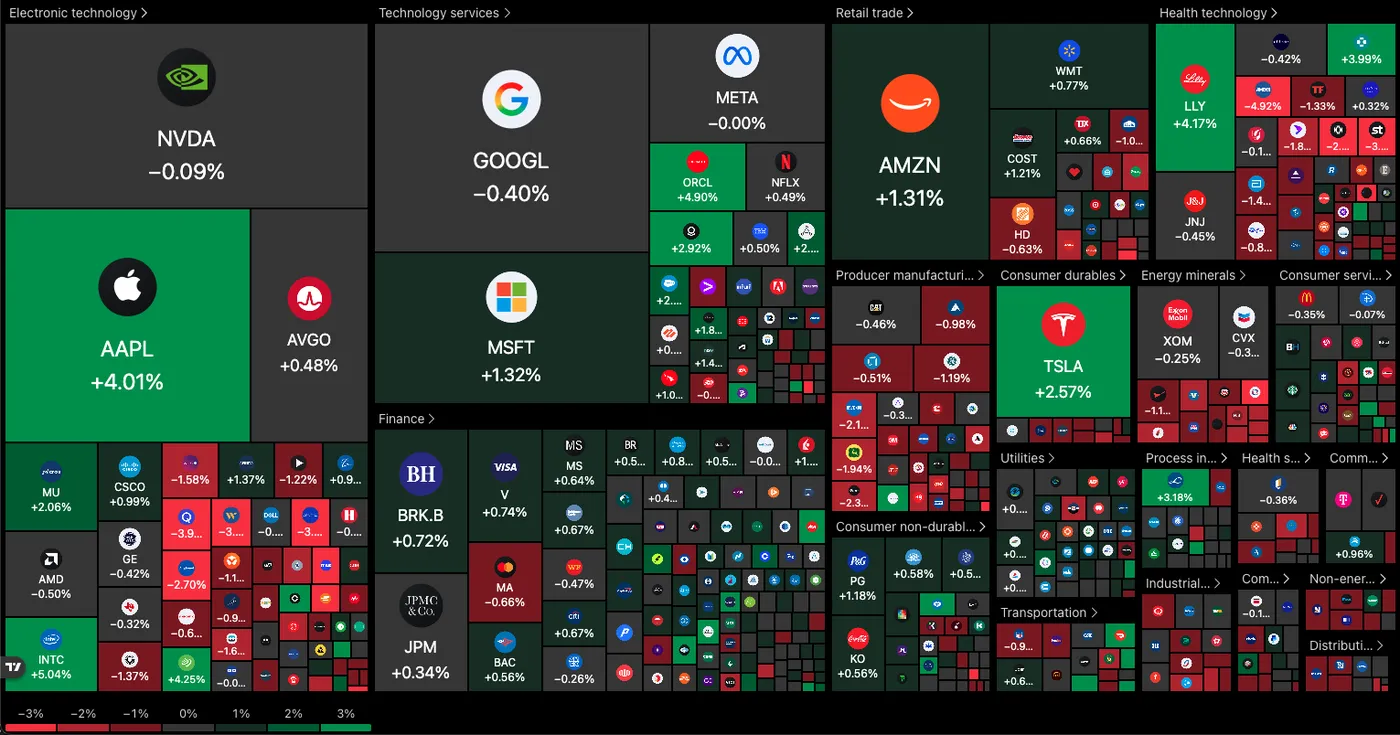
Current picture for the Stock Market (11:09) – Source: TradingView – May 1, 2026
The Stock Market is now back into hesitant trading territory – Healthcare, traditional manufacturing sectors and Energy are lagging after the Manufacturing PMI small miss.
Only a few names are doing the heavy lifting to pull Markets higher, including Apple, Oracle, Intel and Tesla.
Dow Jones 4H Chart and Trading Levels
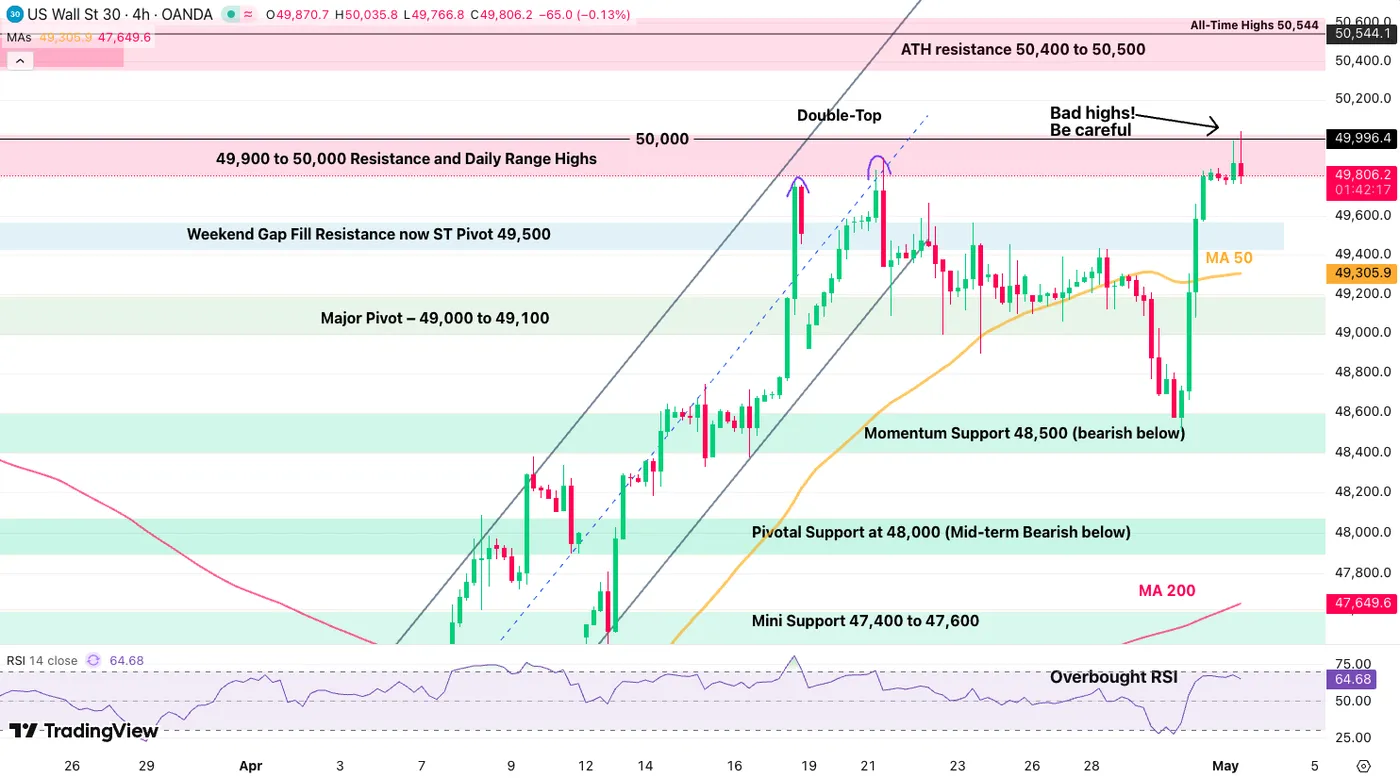
Dow Jones (CFD) 4H Chart – May 1, 2026 – Source: TradingView
After wicking very close to 50,000, the Dow Jones is forming an intraday nasty looking double top.
Sellers are taking control of the intraday momentum, so this could accelerate towards the late weekly session. A break of 49,750 could see further selling towards the 4H 50-period MA (49,300).
Dow Jones technical levels for trading:
Resistance Levels
- Morning highs 49,980
- 49,900 to 50,000 Resistance and Early 2026 Highs (rejecting)
- ATH resistance 50,400 to 50,500
- All-Time Highs 50,544
Support Levels
- 4H 50-period MA (49,300)
- Major Pivot – 49,000 to 49,200
- Momentum Support 48,500 (short-term bearish below)
- Pivotal Support at 48,000
- Mini Support 47,400 to 47,600
Nasdaq 4H Chart and Trading Levels
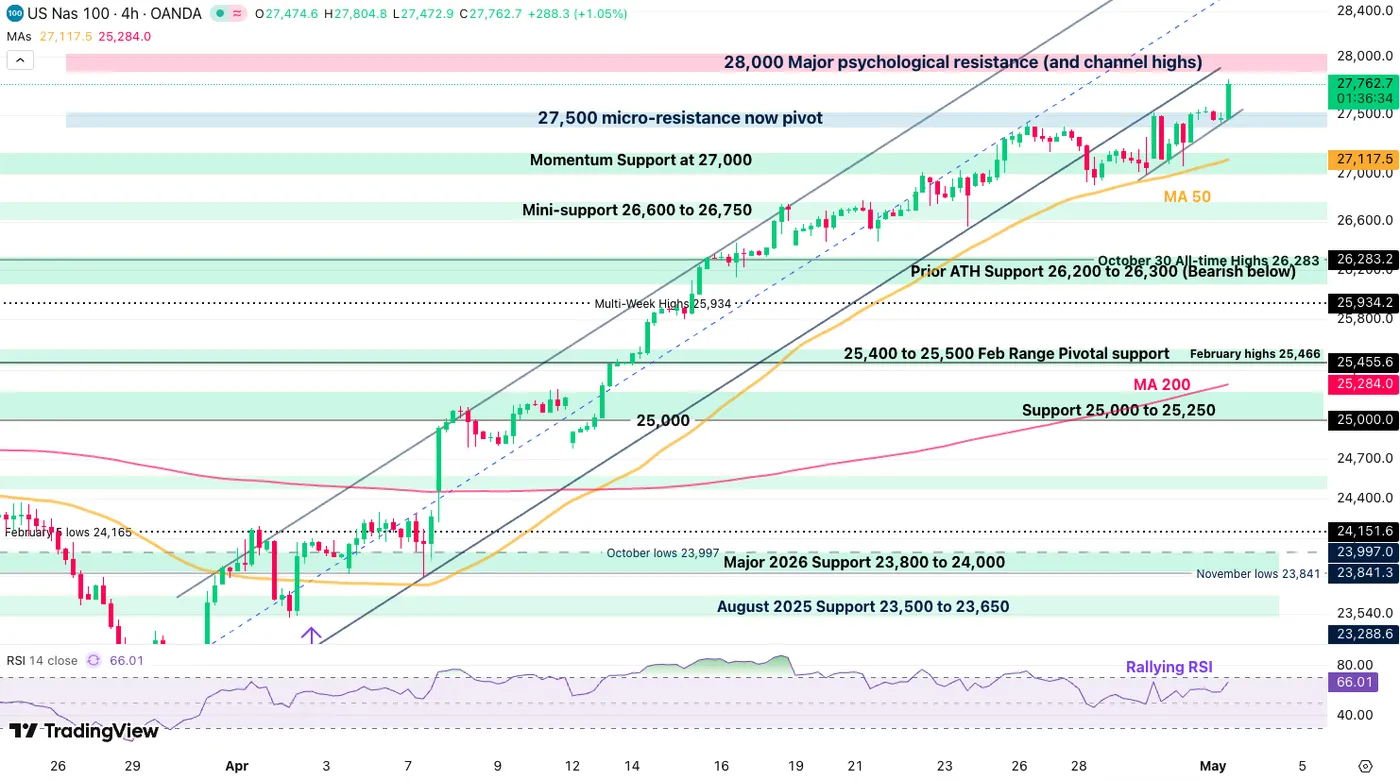
Nasdaq (CFD) 4H Chart – May 1, 2026 – Source: TradingView
Unlike the Dow Jones, Nasdaq hasn't formed any sign of bearish reversal, running towards the 28,000 level, sustained by huge performance from Apple and Intel.
Check out reactions to the psychological level if the action manages to reach the level.
Any rejection below 27,500 could see a swift retest of the 27,100 4H 50-period MA – Watch out as reversals tend to happen fast these days.
Nasdaq technical levels of interest:
Resistance Levels
- 28,000 Major psychological resistance (and channel highs)
- Daily highs 27,850
Support Levels
- 27,500 micro-resistance now pivot
- Momentum Pivot at 27,000 (4H 50-period MA)
- Mini-support 26,600 to 26,750
- Prior ATH Support 26,200 to 26,300
- War Support 25,000 to 25,250
- Early 2025 ATH at 22,000 to 22,229 Support
S&P 500 4H Chart and Trading Levels
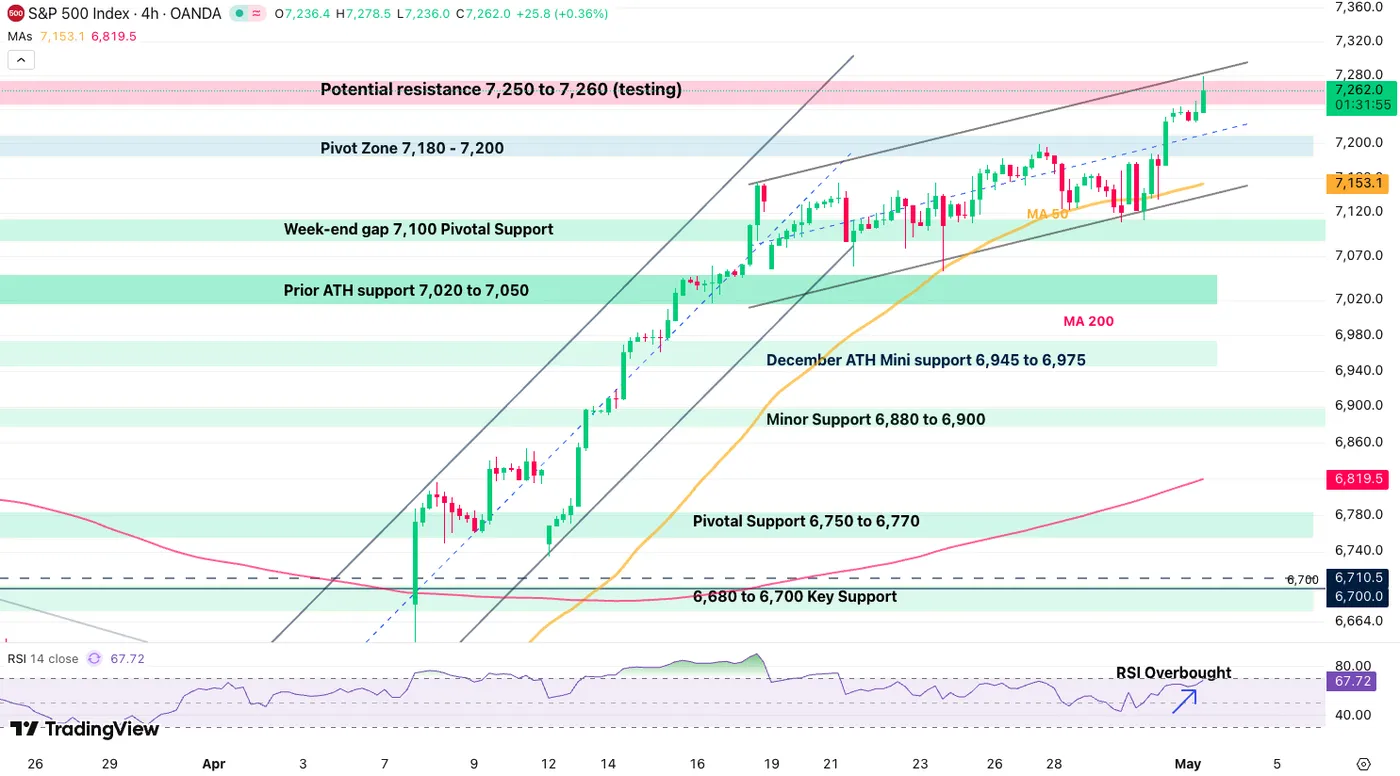
S&P 500 (CFD) 4H Chart – May 1, 2026 – Source: TradingView
The S&P 500 still evolves within its low-slope bull channel, and has now just tested its upper bound.
Momentum still looks strong for the index, but reaching overbought levels, it will be interesting to see if the Index resists to the pressure seen in the DJIA.
Above this, look for 7,300 – Rejecting here however hints at a test of the channel lower bound (7,150).
S&P 500 technical levels of interest:
Resistance Levels
- Mini-channel highs and daily top 7,260
- Potential resistance 7,300
Support Levels
- 7,100 psychological level and 4H 50-period MA
- Prior ATH Pivot 7,000 to 7,020
- Minor Support 6,880 to 6,900
- Pivotal Support 6,750 to 6,770
- 6,300 psychological level (War lows)
Keep track of WTI Crude and the latest headlines throughout the weekend to stay ahead of the curve, with investors still confused about US-Iran negotiations.
Safe Trades!
The Weekly Bottom Line: Markets Jitter, Prices Bite
Canadian Highlights
- March CPI came in a touch softer than expected, with headline inflation jumping to 2.4% on higher gasoline prices but shorter-term core measures are still, on average, running below 2%.
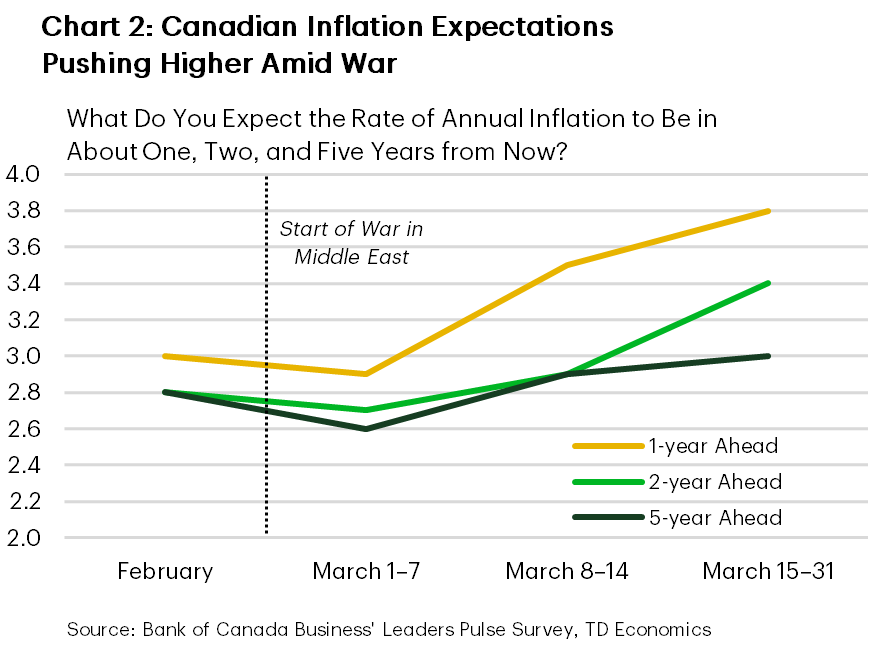
- The first quarter BoC Business Outlook Survey signaled improving pre-war sentiment, but noted rising input costs and some upward drift in inflation expectations since the onset of the conflict.
- With war-related uncertainty elevated and inflation expectations a key area of focus, the BoC is likely to remain on hold next week while reiterating its commitment to keeping expectations well anchored.
U.S. Highlights
- Iran signaled a reopening of the Strait of Hormuz amid a fragile ceasefire, easing oil prices and lifting markets, though evidence of a full normalization in shipping remained limited.
- Retail sales rose sharply in March, boosted by higher gasoline prices but also supported by solid underlying volumes, pointing to continued consumer resilience.
- Business surveys showed activity stabilizing even as war-related supply disruptions pushed price pressures higher, complicating the policy outlook.
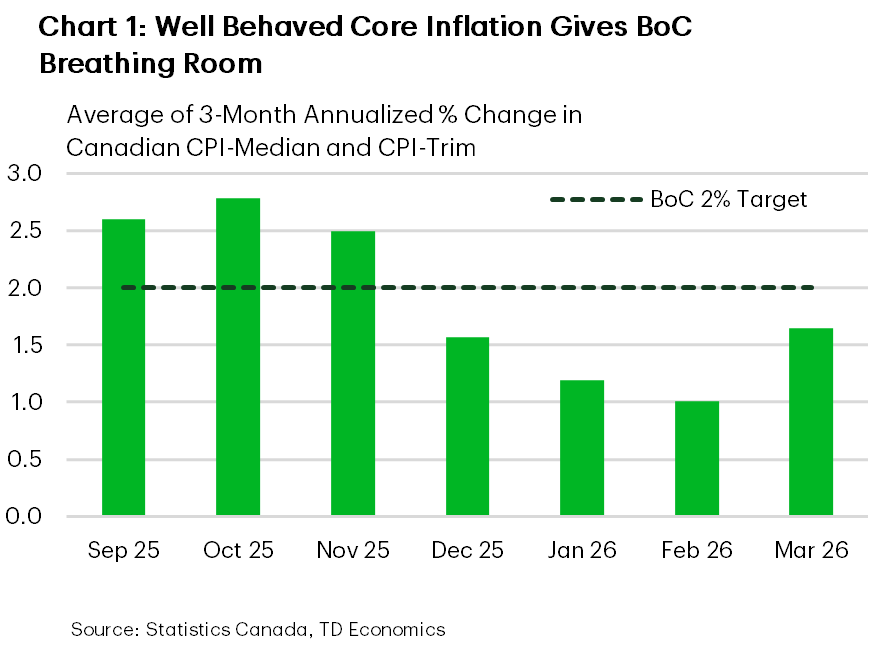
Canada – Well Behaved Core Inflation Strengthens BoC Hold Case
The fluid Middle East situation continued to drive Canadian financial markets. Oil prices remain volatile, with WTI up this week amid limited progress on diplomatic efforts between Iran and the U.S. Canadian bond yields also edged higher (as of writing), with Middle East tensions keeping inflation risks in focus. Since the onset of the war, the 10-year bond yield is up about 35 bps.
This week’s data offered a largely pre-war read on momentum and an early look at inflation spillovers. Retail sales rose in February and Statistics Canada’s flash estimate points to another gain in March. For the Bank of Canada, though, March CPI was the focal point. Headline inflation rose 0.6 ppts to 2.4%, driven by the recent jump in gasoline prices, but the details were modestly softer than expected. For instance, shorter-term core metrics firmed on the month, but remained below 2%, on average (Chart 1). Gasoline prices have been more contained through April, while the federal government has temporarily removed the excise tax on fuels. Still, year-over-year inflation should get a mechanical lift from base effects tied to the April 2025 carbon-tax cut.
The Bank of Canada’s Q1 Business Outlook Survey (BoS) was conducted largely before the war, with only a smaller share of responses collected afterward. Pre-war results showed sentiment improving as firms are adjusting to U.S.–Canada trade frictions. In the background, the CUSMA review is now underway. U.S. and Canadian officials flagged several irritants this week - including U.S. tariffs on Canadian aluminum/steel/autos/lumber and provincial restrictions on U.S. alcohol sales - that will shape negotiations. Multiple parties also suggested the original July 1 deadline is unlikely to be met.
Firms surveyed post-war in the BoS reported only modest impacts on activity measures so far, but flagged rising input costs. The ability of firms to pass through higher costs was mixed, constrained by lackluster demand and increased competition.
Next week brings the release of the federal government’s Spring Economic Update. Last November’s budget pegged the FY 2026/27 deficit at a lofty 2.0% of GDP. This shortfall would also be at the higher end compared to provincial expectations this budget season. However, this year’s outlook for nominal GDP (which drives government revenues) will likely be revised up relative to last November. The update may also be light on substantial net new measures, as several had already been announced, like the grocery rebate top-up.
Attention turns to the Bank of Canada’s rate decision next week. The Bank is widely expected to stay on hold - our call as well. With the economic fallout from the war still highly uncertain, it would be premature to pivot from a hold, particularly with core inflation still well behaved. That said, the BoS points to some upward drift in shorter-term inflation expectations, though long-term measures remain well anchored (Chart 2). Expect the Bank to stress its willingness to act as needed to keep expectations anchored.
U.S. – Markets Jitter, Prices Bite
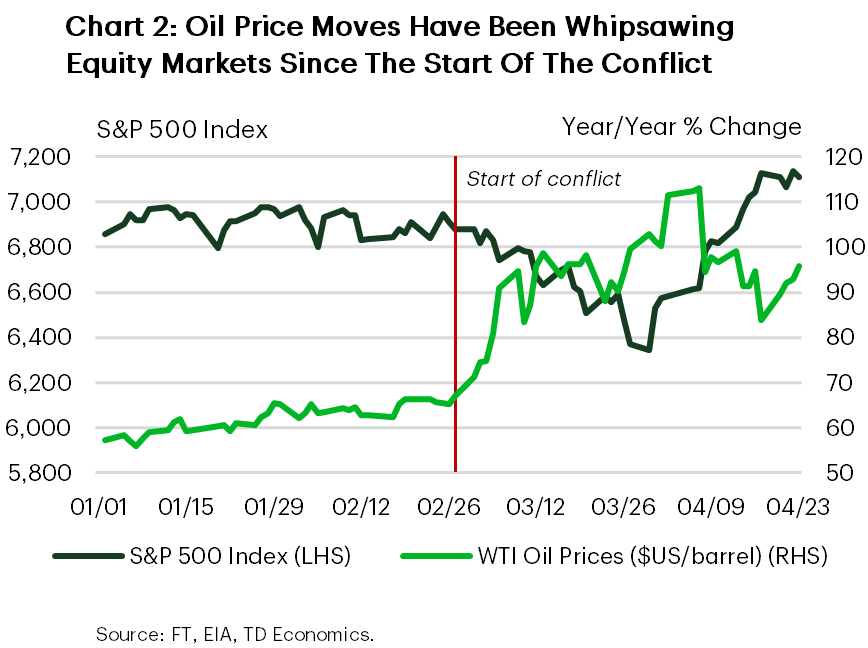
As the Iran conflict approaches the two month mark, financial markets remained highly sensitive to signals around energy supply risks. Early in the week, Iran announced that the Strait of Hormuz would be reopened to commercial shipping vessels during a newly brokered ceasefire, triggering a sharp pullback in oil prices and a relief rally in risk assets. WTI crude fell into the low $80s per barrel range, while U.S. equities moved to new highs as immediate worst case supply scenarios were priced out (Chart 1). That said, reporting around actual shipping flows suggested that conditions on the ground were uneven. As a result, while near term fears eased, geopolitical risks remain elevated and sentiment fragile, leaving markets vulnerable to renewed volatility should tensions re escalate.
U.S. economic data this week offered a reminder that domestic momentum has not yet broken down. Retail and food services sales rose 1.7% in March, driven largely by a surge in gasoline prices, but importantly, real (inflation adjusted) spending also increased a solid 0.8%. Core retail sales excluding gasoline, autos, and building materials posted broad-based gains, suggesting that households have not yet pulled back meaningfully on goods consumption. One area of softness was spending at restaurants, which was little changed on the month, highlighting some emerging price sensitivity among consumers.
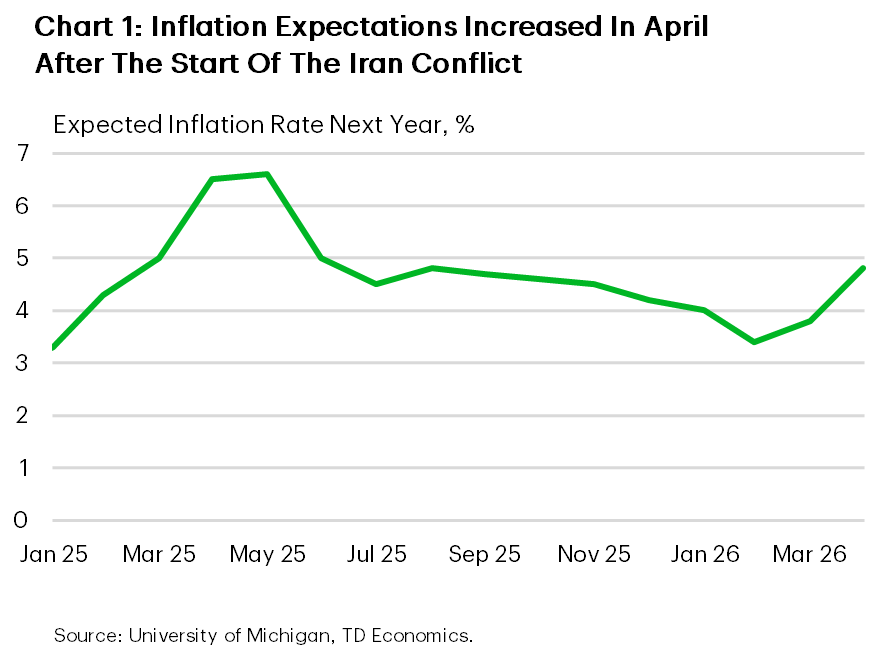
Forward-looking indicators painted a more mixed picture. The latest U.S. PMI readings showed business activity recovering modestly in April after stalling in March, with manufacturing rebounding more strongly than services. However, the rebound was accompanied by worsening delivery times and a sharp increase in input and output prices, reflecting ongoing supply disruptions tied to the conflict. Firms reported precautionary stock building and rising costs, reinforcing concerns that inflation pressures could re-intensify. The University of Michigan survey released today showed inflation expectations over the next year rising sharply, a key indicator energy-driven price worries are becoming more entrenched (Chart 2).
Markets are also increasingly focused on the Federal Reserve policy backdrop. Kevin Warsh’s confirmation hearing this week underscored uncertainty around the future policy framework, with investors parsing how shifts in leadership could influence the Fed’s reaction function at a time when inflation and growth risks are pulling in opposite directions. While Warsh’s confirmation by the Senate Banking Committee was uncertain amid the ongoing DOJ investigation of Chair Powell, headlines on Friday morning suggested the charges had been dropped. This clears a path for Warsh’s confirmation, which means next week’s interest rate announcement will likely be Jerome Powell’s last as chair. Looking ahead, next week’s data calendar is heavy, with personal income and PCE inflation, first quarter GDP, and ISM surveys all due. Together, these releases will help determine whether the economy is slowing enough to offset renewed price pressures.
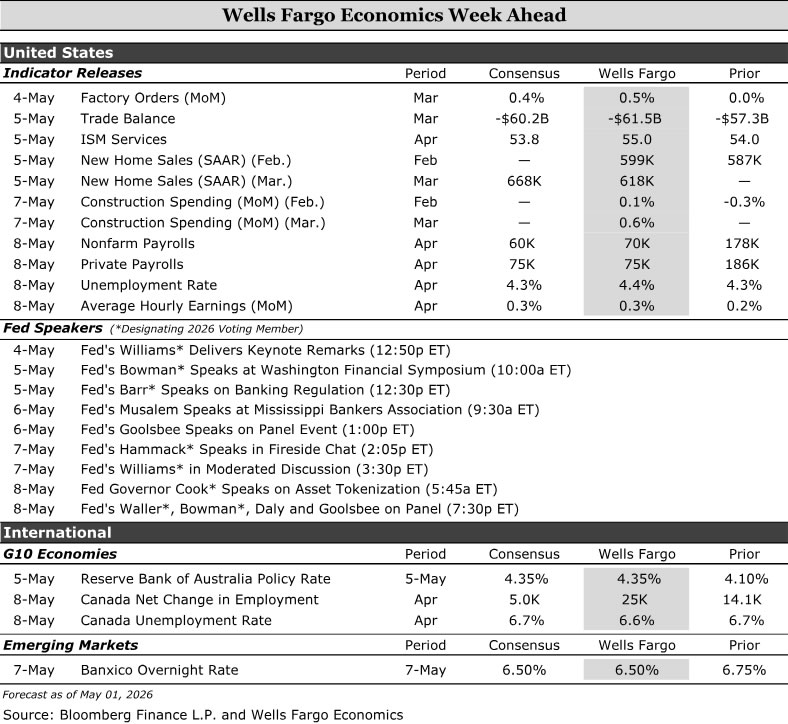
Economics Week Ahead
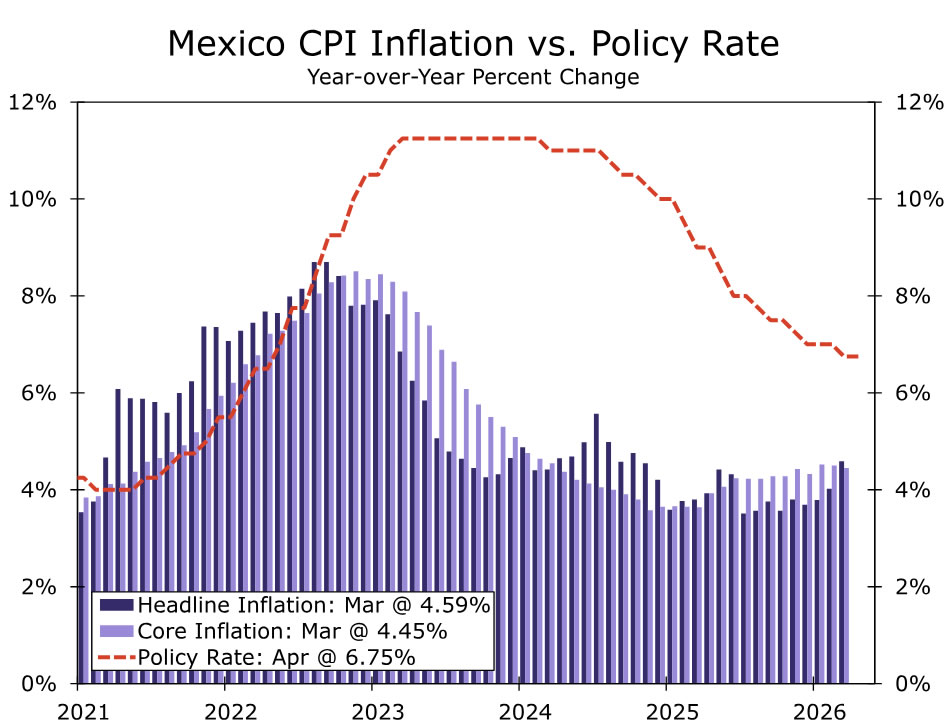
The U.S. labor market remains soft with the “low fire, low hire” environment continuing. We expect payroll growth to step down to around 70K in April, with a rebound in labor force participation pushing the unemployment rate back up to 4.4%. Globally, central banks are diverging. The Fed is firmly on hold in the wake of the continued conflict in Iran. But we now expect the Reserve Bank of Australia to deliver a third consecutive rate hike, prolonging their hiking cycle, and Canada’s labor market to stabilize, supporting a July rate hike as inflation pressures return to focus. In emerging markets, we expect Banxico to cut the policy rate by 25 bps next week to 6.50%, likely in a split decision, even as inflation risks remain tilted to the upside.
United States:
- Employment (Friday)
G10 Economies:
- Reserve Bank of Australia Policy Rate (Wednesday), Canada Labor Force Survey (Friday)
Emerging Markets:
- Banxico Policy Rate (Thursday)
U.S. Week Ahead
Employment • Friday
The labor market is still stuck in the low fire, low hire dynamic that has prevailed for the past two years. While layoffs at well-known tech companies made headlines in recent weeks, initial jobless claims, WARN notices and Challenger job cut announcements point to economy-wide layoffs remaining tame for now. Yet, firms still show little appetite to hire additional workers. Small business hiring plans are sitting at a two-year low, regional Fed employment PMIs sank further into negative territory in April and Indeed job postings—which had been on an upswing since the start of the year—wobbled in March.
With demand for workers little changed, the supply of workers has become a bigger factor in the pace of job growth. Last month's 178K rise in payrolls, even accounting for the ~30K boost from completed strikes, is untenable given the immigration and demographic constraints on labor force growth. We expect some payback in April and estimate total payrolls advanced 70K, with private payrolls up 75K.
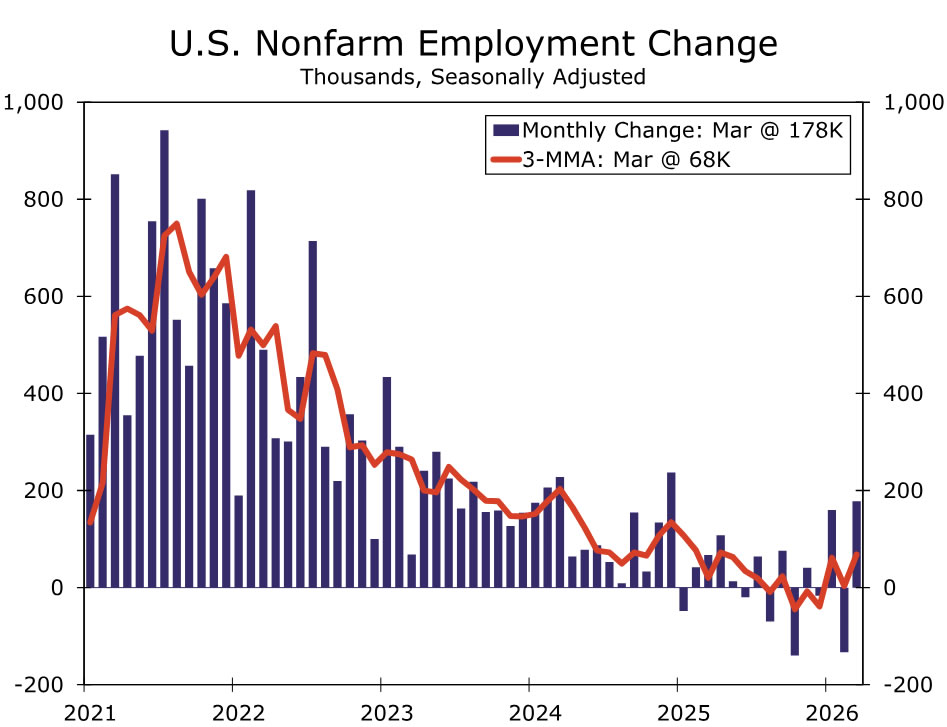
The April unemployment rate is also like to point to a slightly softer jobs market. Last month's drop to nearly 4.2% (4.26% unrounded) was driven by a swath of unemployed workers leaving the labor force. We look for a rebound in the labor force and ranks of the unemployed in April to push the unemployment rate back to 4.4%. That would leave the unemployment a tick higher than what most FOMC members estimate is full employment—uncomfortable amid an uncertain demand backdrop, but not indicative of the labor market's delicate balance tipping in April.
G10 Week Ahead
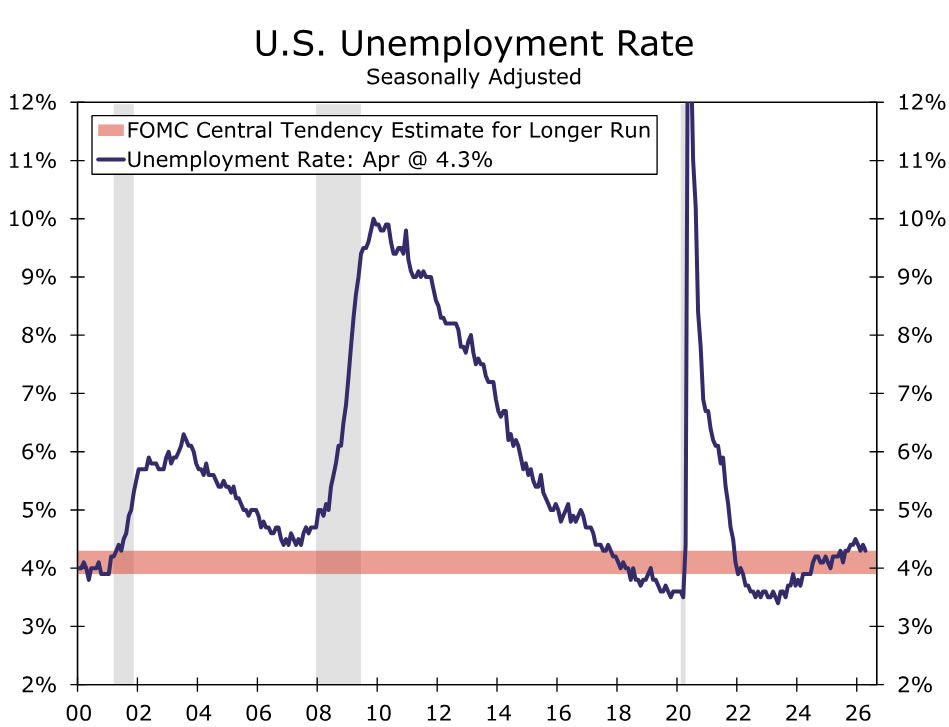
Reserve Bank of Australia Cash Rate • Wednesday
We expect a third consecutive 25 bps rate hike from the Reserve Bank of Australia (RBA) next week, lifting the Cash Rate to 4.35%. Further, we see the RBA prolonging its hiking cycle through mid-year, a shift from our prior view of rates on hold through end-2026. At its March meeting, the RBA stressed that with inflation still too high, the question of raising rates was about “timing rather than direction.” Recent communication reinforces that message, with greater emphasis on anchoring long‑term inflation expectations. Deputy Governor Hunter described this as being a central bank's ‘North Star’, while Governor Bullock, at the March meeting, stated that anchoring long-term inflation expectations depends on convincing households and firms the RBA “would take action to bring inflation back to target.” While March headline CPI rose 4.8% year-over-year due largely to fuel prices, the print undershot expectations and trimmed mean inflation held at 3.3%, pointing to moderating core inflation before the Middle East conflict. That dynamic, however, is likely to shift over the next months, with April PMIs showing the fastest rise in input costs in over four years.
With the labor market tight, inflation above target and the economy starting from a relatively strong position, policymakers appear focused on near-term action. As this meeting includes an updated Statement on Monetary Policy, it should clarify how much higher inflation is expected to run by the RBA and what that implies for the path ahead. While the outlook beyond May is less certain after three hikes, risks have shifted to the upside. We now see scope for another increase (most likely in June but could be delayed to August), taking the Cash Rate to 4.60%, with the possibility of higher rates if the conflict continues and inflation pressures intensify.
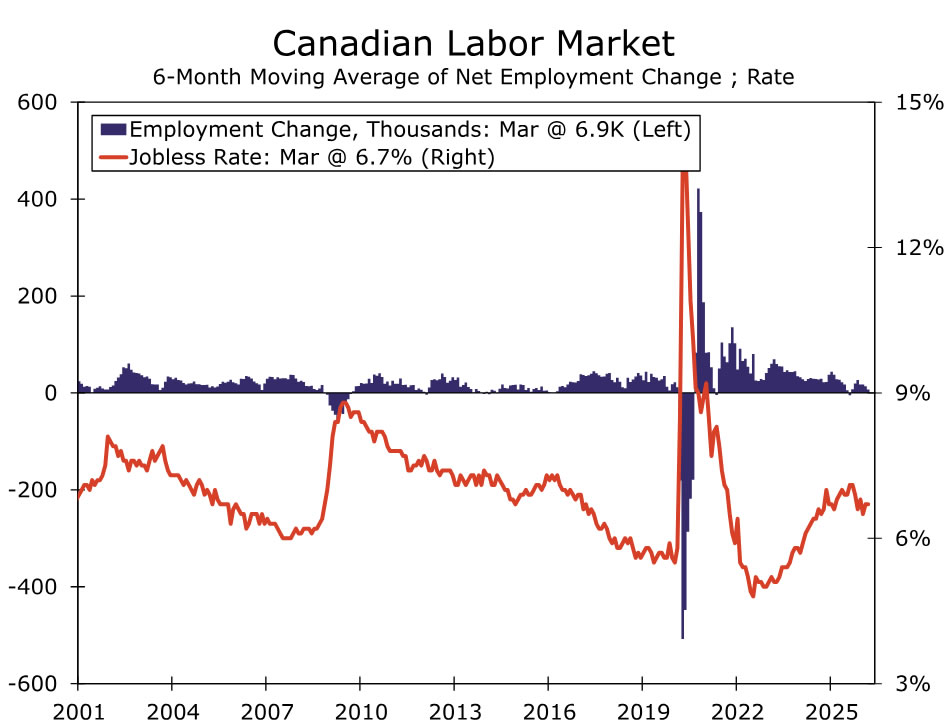
Canada Labor Force Survey • Friday
We expect further improvement in Canadian labor market data next week, with employment rising by around 25K in April and the unemployment rate ticking down to 6.6%. The April report should confirm the stabilization in labor market conditions seen in March. We expect job gains to be concentrated in full-time employment and led by goods-producing sectors, particularly energy and mining. Demographics and net migrant outflows continue to point to weak labor force growth and subdued participation rates. This is pushing down the breakeven pace of job growth needed to keep the unemployment rate stable, potentially into slightly negative territory. As a result, we expect the unemployment rate to drift gradually lower over the course of 2026.
On net, stabilization in labor market conditions shifts the balance of risks for the Bank of Canada back toward inflation. This week’s meeting emphasized USMCA-related uncertainty as a near-term dovish risk. However, we continue to expect a Bank of Canada rate hike at the July meeting, assuming the July 1 deadline passes with a muddle-through outcome, policymakers gain further evidence of inflation pass-through and the Bank delivers a refreshed July Monetary Policy Report.
EM Week Ahead
Banxico Policy Rate • Thursday
We expect Banxico to cut the policy rate by 25 bps next week to 6.50%, with the window for further easing now rapidly closing. We anticipate a 3–2 decision, with the dovish majority leaning heavily on softer activity data. Economic momentum weakened sharply in Q1, with GDP contracting 0.8% quarter-over-quarter and growth barely positive on a year-over-year basis. Retail sales, labor market indicators and downward revisions to services output all point to a loss of momentum early in the year. Q2 should improve mechanically, but this is more likely to reflect stabilization than a meaningful rebound. Inflation dynamics remain problematic. Both headline and core inflation are around 4.5% year-over-year, with core inflation having remained above 4% for nearly a year, well above the upper bound of Banxico’s 2–4% target range. Non-core inflation is likely to re-accelerate in coming months as higher food and energy prices feed through, reflecting Middle East developments and adverse agricultural conditions. Inflation risks are therefore clearly skewed to the upside, leaving Banxico’s dovish bias increasingly out of step with inflation realities.
A final rate cut in Q2 appears likely, particularly given recent comments from Governor Rodríguez and Deputy Governor Mejía. As in the March meeting, we expect Deputy Governors Borja and Heath to dissent in favor of holding rates steady. Looking beyond, the macro mix for H2 2026 is unfavorable, characterized by low trend growth, elevated inflation, limited fiscal support, and fragile monetary credibility. A key risk event later this year will be the replacement for Heath, whose term ends in December. A technocratic appointment would be viewed positively by markets and help contain risk premia in both rates and FX. Absent that, we see weak growth and Banxico’s dovish bias weighing on the peso, while credibility concerns are more likely to lift term premia in local rates.
Summary 5/4 – 5/8
Monday, May 4, 2026
| GMT | Ccy | Events | Cons | Prev |
|---|---|---|---|---|
| 01:00 | AUD | TD-MI Inflation Gauge M/M Apr | 1.30% | |
| 07:30 | CHF | Manufacturing PMI Apr | 51.9 | 53.3 |
| 07:50 | EUR | France Manufacturing PMI Apr F | 52.8 | 52.8 |
| 07:55 | EUR | Germany Manufacturing PMI Apr F | 51.2 | 51.2 |
| 08:00 | EUR | Eurozone Manufacturing PMI Apr F | 52.2 | 52.2 |
| 08:30 | EUR | Eurozone Sentix Investor Confidence May | -20.5 | -19.2 |
| 14:00 | USD | Factory Orders M/M Mar | 0.40% | 0.00% |
| 01:00 | AUD |
| TD-MI Inflation Gauge M/M Apr | |
| Consensus | |
| Previous | 1.30% |
| 07:30 | CHF |
| Manufacturing PMI Apr | |
| Consensus | 51.9 |
| Previous | 53.3 |
| 07:50 | EUR |
| France Manufacturing PMI Apr F | |
| Consensus | 52.8 |
| Previous | 52.8 |
| 07:55 | EUR |
| Germany Manufacturing PMI Apr F | |
| Consensus | 51.2 |
| Previous | 51.2 |
| 08:00 | EUR |
| Eurozone Manufacturing PMI Apr F | |
| Consensus | 52.2 |
| Previous | 52.2 |
| 08:30 | EUR |
| Eurozone Sentix Investor Confidence May | |
| Consensus | -20.5 |
| Previous | -19.2 |
| 14:00 | USD |
| Factory Orders M/M Mar | |
| Consensus | 0.40% |
| Previous | 0.00% |
Tuesday, May 5, 2026
| GMT | Ccy | Events | Cons | Prev |
|---|---|---|---|---|
| 04:30 | AUD | RBA Interest Rate Decision | 4.35% | 4.10% |
| 05:30 | AUD | RBA Press Conference | ||
| 06:30 | CHF | CPI M/M Apr | 0.40% | 0.20% |
| 06:30 | CHF | CPI Y/Y Apr | 0.30% | |
| 12:30 | CAD | Trade Balance (CAD) Mar | -2.8B | -5.7B |
| 12:30 | USD | Trade Balance (USD) Mar | -59.0B | -57.3B |
| 13:45 | USD | Services PMI Apr F | 51.3 | 51.3 |
| 14:00 | USD | ISM Services PMI Apr | 53.8 | 54 |
| 04:30 | AUD |
| RBA Interest Rate Decision | |
| Consensus | 4.35% |
| Previous | 4.10% |
| 05:30 | AUD |
| RBA Press Conference | |
| Consensus | |
| Previous | |
| 06:30 | CHF |
| CPI M/M Apr | |
| Consensus | 0.40% |
| Previous | 0.20% |
| 06:30 | CHF |
| CPI Y/Y Apr | |
| Consensus | |
| Previous | 0.30% |
| 12:30 | CAD |
| Trade Balance (CAD) Mar | |
| Consensus | -2.8B |
| Previous | -5.7B |
| 12:30 | USD |
| Trade Balance (USD) Mar | |
| Consensus | -59.0B |
| Previous | -57.3B |
| 13:45 | USD |
| Services PMI Apr F | |
| Consensus | 51.3 |
| Previous | 51.3 |
| 14:00 | USD |
| ISM Services PMI Apr | |
| Consensus | 53.8 |
| Previous | 54 |
Wednesday, May 6, 2026
| GMT | Ccy | Events | Cons | Prev |
|---|---|---|---|---|
| 22:45 | NZD | Employment Change Q1 | 0.30% | 0.50% |
| 22:45 | NZD | Unemployment Rate Q1 | 5.40% | 5.40% |
| 22:45 | NZD | Labour Cost Index Q/Q Q1 | 0.40% | 0.40% |
| 01:45 | CNY | RatingDog Services PMI Apr | 52 | 52.1 |
| 07:50 | EUR | France Services PMI Apr F | 46.5 | 46.5 |
| 07:55 | EUR | Germany Services PMI Apr F | 46.9 | 46.9 |
| 08:00 | EUR | Eurozone Services PMI Apr F | 47.4 | 47.4 |
| 08:30 | GBP | Services PMI Apr F | 52 | 52 |
| 09:00 | EUR | Eurozone PPI M/M Mar | 3.30% | -0.70% |
| 09:00 | EUR | Eurozone PPI Y/Y Mar | 1.80% | -3% |
| 12:15 | USD | ADP Employment Change Apr | 79K | 62K |
| 14:00 | CAD | Ivey PMI Apr | 49.9 | 49.7 |
| 14:30 | USD | Crude Oil Inventories (May 1) | -3.4M | -6.2M |
| 22:45 | NZD |
| Employment Change Q1 | |
| Consensus | 0.30% |
| Previous | 0.50% |
| 22:45 | NZD |
| Unemployment Rate Q1 | |
| Consensus | 5.40% |
| Previous | 5.40% |
| 22:45 | NZD |
| Labour Cost Index Q/Q Q1 | |
| Consensus | 0.40% |
| Previous | 0.40% |
| 01:45 | CNY |
| RatingDog Services PMI Apr | |
| Consensus | 52 |
| Previous | 52.1 |
| 07:50 | EUR |
| France Services PMI Apr F | |
| Consensus | 46.5 |
| Previous | 46.5 |
| 07:55 | EUR |
| Germany Services PMI Apr F | |
| Consensus | 46.9 |
| Previous | 46.9 |
| 08:00 | EUR |
| Eurozone Services PMI Apr F | |
| Consensus | 47.4 |
| Previous | 47.4 |
| 08:30 | GBP |
| Services PMI Apr F | |
| Consensus | 52 |
| Previous | 52 |
| 09:00 | EUR |
| Eurozone PPI M/M Mar | |
| Consensus | 3.30% |
| Previous | -0.70% |
| 09:00 | EUR |
| Eurozone PPI Y/Y Mar | |
| Consensus | 1.80% |
| Previous | -3% |
| 12:15 | USD |
| ADP Employment Change Apr | |
| Consensus | 79K |
| Previous | 62K |
| 14:00 | CAD |
| Ivey PMI Apr | |
| Consensus | 49.9 |
| Previous | 49.7 |
| 14:30 | USD |
| Crude Oil Inventories (May 1) | |
| Consensus | -3.4M |
| Previous | -6.2M |
Thursday, May 7, 2026
| GMT | Ccy | Events | Cons | Prev |
|---|---|---|---|---|
| 23:50 | JPY | Monetary Base Y/Y Apr | -10.50% | -11.60% |
| 23:50 | JPY | BoJ Minutes | ||
| 01:30 | AUD | Trade Balance (AUD) Mar | 4.45B | 5.69B |
| 06:00 | EUR | Germany Factory Orders M/M Mar | 1.10% | 0.90% |
| 07:00 | CHF | Foreign Currency Reserves *CHF) Apr | 721B | |
| 08:00 | CHF | Unemployment Rate M/M Apr | 3.00% | 3.00% |
| 08:30 | GBP | Construction PMI Apr | 46.2 | 45.6 |
| 09:00 | EUR | Eurozone Retail Sales M/M Mar | -0.40% | -0.20% |
| 12:30 | USD | Initial Jobless Claims (May 1) | 199K | 189K |
| 12:30 | USD | Nonfarm Productivity Q1 P | 0.70% | 1.80% |
| 12:30 | USD | Unit Labor Costs Q1 P | 2.60% | 4.40% |
| 14:30 | USD | Natural Gas Storage (May 1) | 72B | 79B |
| 23:50 | JPY |
| Monetary Base Y/Y Apr | |
| Consensus | -10.50% |
| Previous | -11.60% |
| 23:50 | JPY |
| BoJ Minutes | |
| Consensus | |
| Previous | |
| 01:30 | AUD |
| Trade Balance (AUD) Mar | |
| Consensus | 4.45B |
| Previous | 5.69B |
| 06:00 | EUR |
| Germany Factory Orders M/M Mar | |
| Consensus | 1.10% |
| Previous | 0.90% |
| 07:00 | CHF |
| Foreign Currency Reserves *CHF) Apr | |
| Consensus | |
| Previous | 721B |
| 08:00 | CHF |
| Unemployment Rate M/M Apr | |
| Consensus | 3.00% |
| Previous | 3.00% |
| 08:30 | GBP |
| Construction PMI Apr | |
| Consensus | 46.2 |
| Previous | 45.6 |
| 09:00 | EUR |
| Eurozone Retail Sales M/M Mar | |
| Consensus | -0.40% |
| Previous | -0.20% |
| 12:30 | USD |
| Initial Jobless Claims (May 1) | |
| Consensus | 199K |
| Previous | 189K |
| 12:30 | USD |
| Nonfarm Productivity Q1 P | |
| Consensus | 0.70% |
| Previous | 1.80% |
| 12:30 | USD |
| Unit Labor Costs Q1 P | |
| Consensus | 2.60% |
| Previous | 4.40% |
| 14:30 | USD |
| Natural Gas Storage (May 1) | |
| Consensus | 72B |
| Previous | 79B |
Friday, May 8, 2026
| GMT | Ccy | Events | Cons | Prev |
|---|---|---|---|---|
| 23:30 | JPY | Labor Cash Earnings Y/Y Mar | 3.20% | 3.30% |
| 00:30 | JPY | Services PMI Apr F | 51.2 | 51.2 |
| 06:00 | EUR | Germany Industrial Production M/M Mar | 0.40% | -0.30% |
| 06:00 | EUR | Germany Trade Balance (EUR) Mar | 18.9B | 19.8B |
| 12:30 | CAD | Net Change in Employment Apr | 5.1K | 14.1K |
| 12:30 | CAD | Unemployment Rate Apr | 6.70% | 6.70% |
| 12:30 | USD | Nonfarm Payrolls Apr | 60K | 178K |
| 12:30 | USD | Unemployment Rate Apr | 4.30% | 4.30% |
| 12:30 | USD | Average Hourly Earnings M/M Apr | 0.30% | 0.20% |
| 14:00 | USD | UoM Consumer Sentiment P | 49.7 | 49.8 |
| 14:00 | USD | UoM Inflation Expectations P | 4.70% |
| 23:30 | JPY |
| Labor Cash Earnings Y/Y Mar | |
| Consensus | 3.20% |
| Previous | 3.30% |
| 00:30 | JPY |
| Services PMI Apr F | |
| Consensus | 51.2 |
| Previous | 51.2 |
| 06:00 | EUR |
| Germany Industrial Production M/M Mar | |
| Consensus | 0.40% |
| Previous | -0.30% |
| 06:00 | EUR |
| Germany Trade Balance (EUR) Mar | |
| Consensus | 18.9B |
| Previous | 19.8B |
| 12:30 | CAD |
| Net Change in Employment Apr | |
| Consensus | 5.1K |
| Previous | 14.1K |
| 12:30 | CAD |
| Unemployment Rate Apr | |
| Consensus | 6.70% |
| Previous | 6.70% |
| 12:30 | USD |
| Nonfarm Payrolls Apr | |
| Consensus | 60K |
| Previous | 178K |
| 12:30 | USD |
| Unemployment Rate Apr | |
| Consensus | 4.30% |
| Previous | 4.30% |
| 12:30 | USD |
| Average Hourly Earnings M/M Apr | |
| Consensus | 0.30% |
| Previous | 0.20% |
| 14:00 | USD |
| UoM Consumer Sentiment P | |
| Consensus | 49.7 |
| Previous | 49.8 |
| 14:00 | USD |
| UoM Inflation Expectations P | |
| Consensus | |
| Previous | 4.70% |
Canada’s Jobs Market Expected to Chug Along Even as Labour Force Shrinks
Canadian labour market data for April next Friday will be in focus, and we expect employment to remain broadly consistent with a gradual improvement in per-worker conditions after controlling for an unprecedented pullback in labour force growth.
We expect about 25,000 jobs were added in April following losses in January and February that only partially recovered in March.
That would still leave employment down 70,000 in the first four months of 2026, but would also likely still be enough to push the unemployment rate down to 6.6% from 6.7%—further below the recent 7.1% peak in August and September 2025.
We have discussed before how aggressive federal immigration caps and an aging population have sharply lowered the amount of employment growth needed to push the unemployment rate (the better indicator of per-worker labour conditions) lower.
Details of recent labour market reports have also not been as soft as headline employment growth numbers imply. Specifically:
- Weakness has been largely contained to trade-exposed sectors with little evidence of spreading. Employment in sectors heavily exposed to U.S. trade (with 35% or more jobs due to demand from the U.S.) have declined 3% since February 2024, while other sectors grew by 1%.
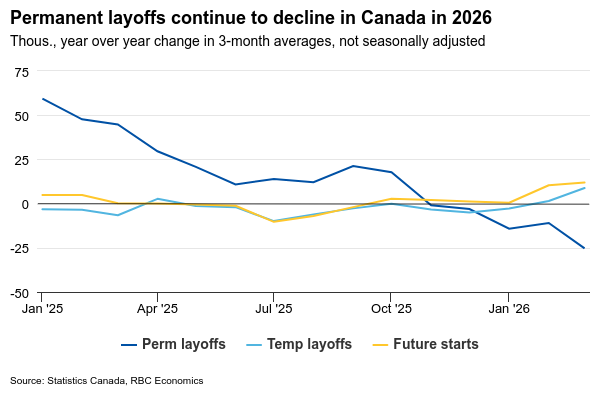
- Permanent layoffs have declined. Early 2026 job losses were not driven by permanent layoffs, which have fallen since October 2025. Instead, temporary layoffs and future starts (workers with a future job start date, but still technically unemployed) account for recent increases.
- No signs of “hidden” unemployment. The unemployment rate provides a “clean” read of per-worker conditions only if discouraged workers are not giving up their jobs or being pushed into part-time work when they would rather have full time jobs.
- Still, broader unemployment measures like R-8, which include such workers (discouraged and involuntary part-time workers) remain aligned with the official rate. Both measures have been relatively unchanged from a year ago, indicating weakness is not masked beneath the surface.
- Business sentiment is brightening. The Bank of Canada’s Business Outlook Survey, conducted in February, revealed strengthening hiring and investment intentions. Businesses reported plans focused on productivity gains and capacity expansion, reflecting a healthy rebound in household spending in 2025, and substantial improvement in trade uncertainties.
The labour market is not yet strong: Unemployment rate declines have still been modest to date, and we don’t expect a spike in wages in March will be repeated in April.
But, our base case projections assume further gradual improvements this year with the unemployment rate edging down to 6.3% by year end even with job growth softer than historically normal.
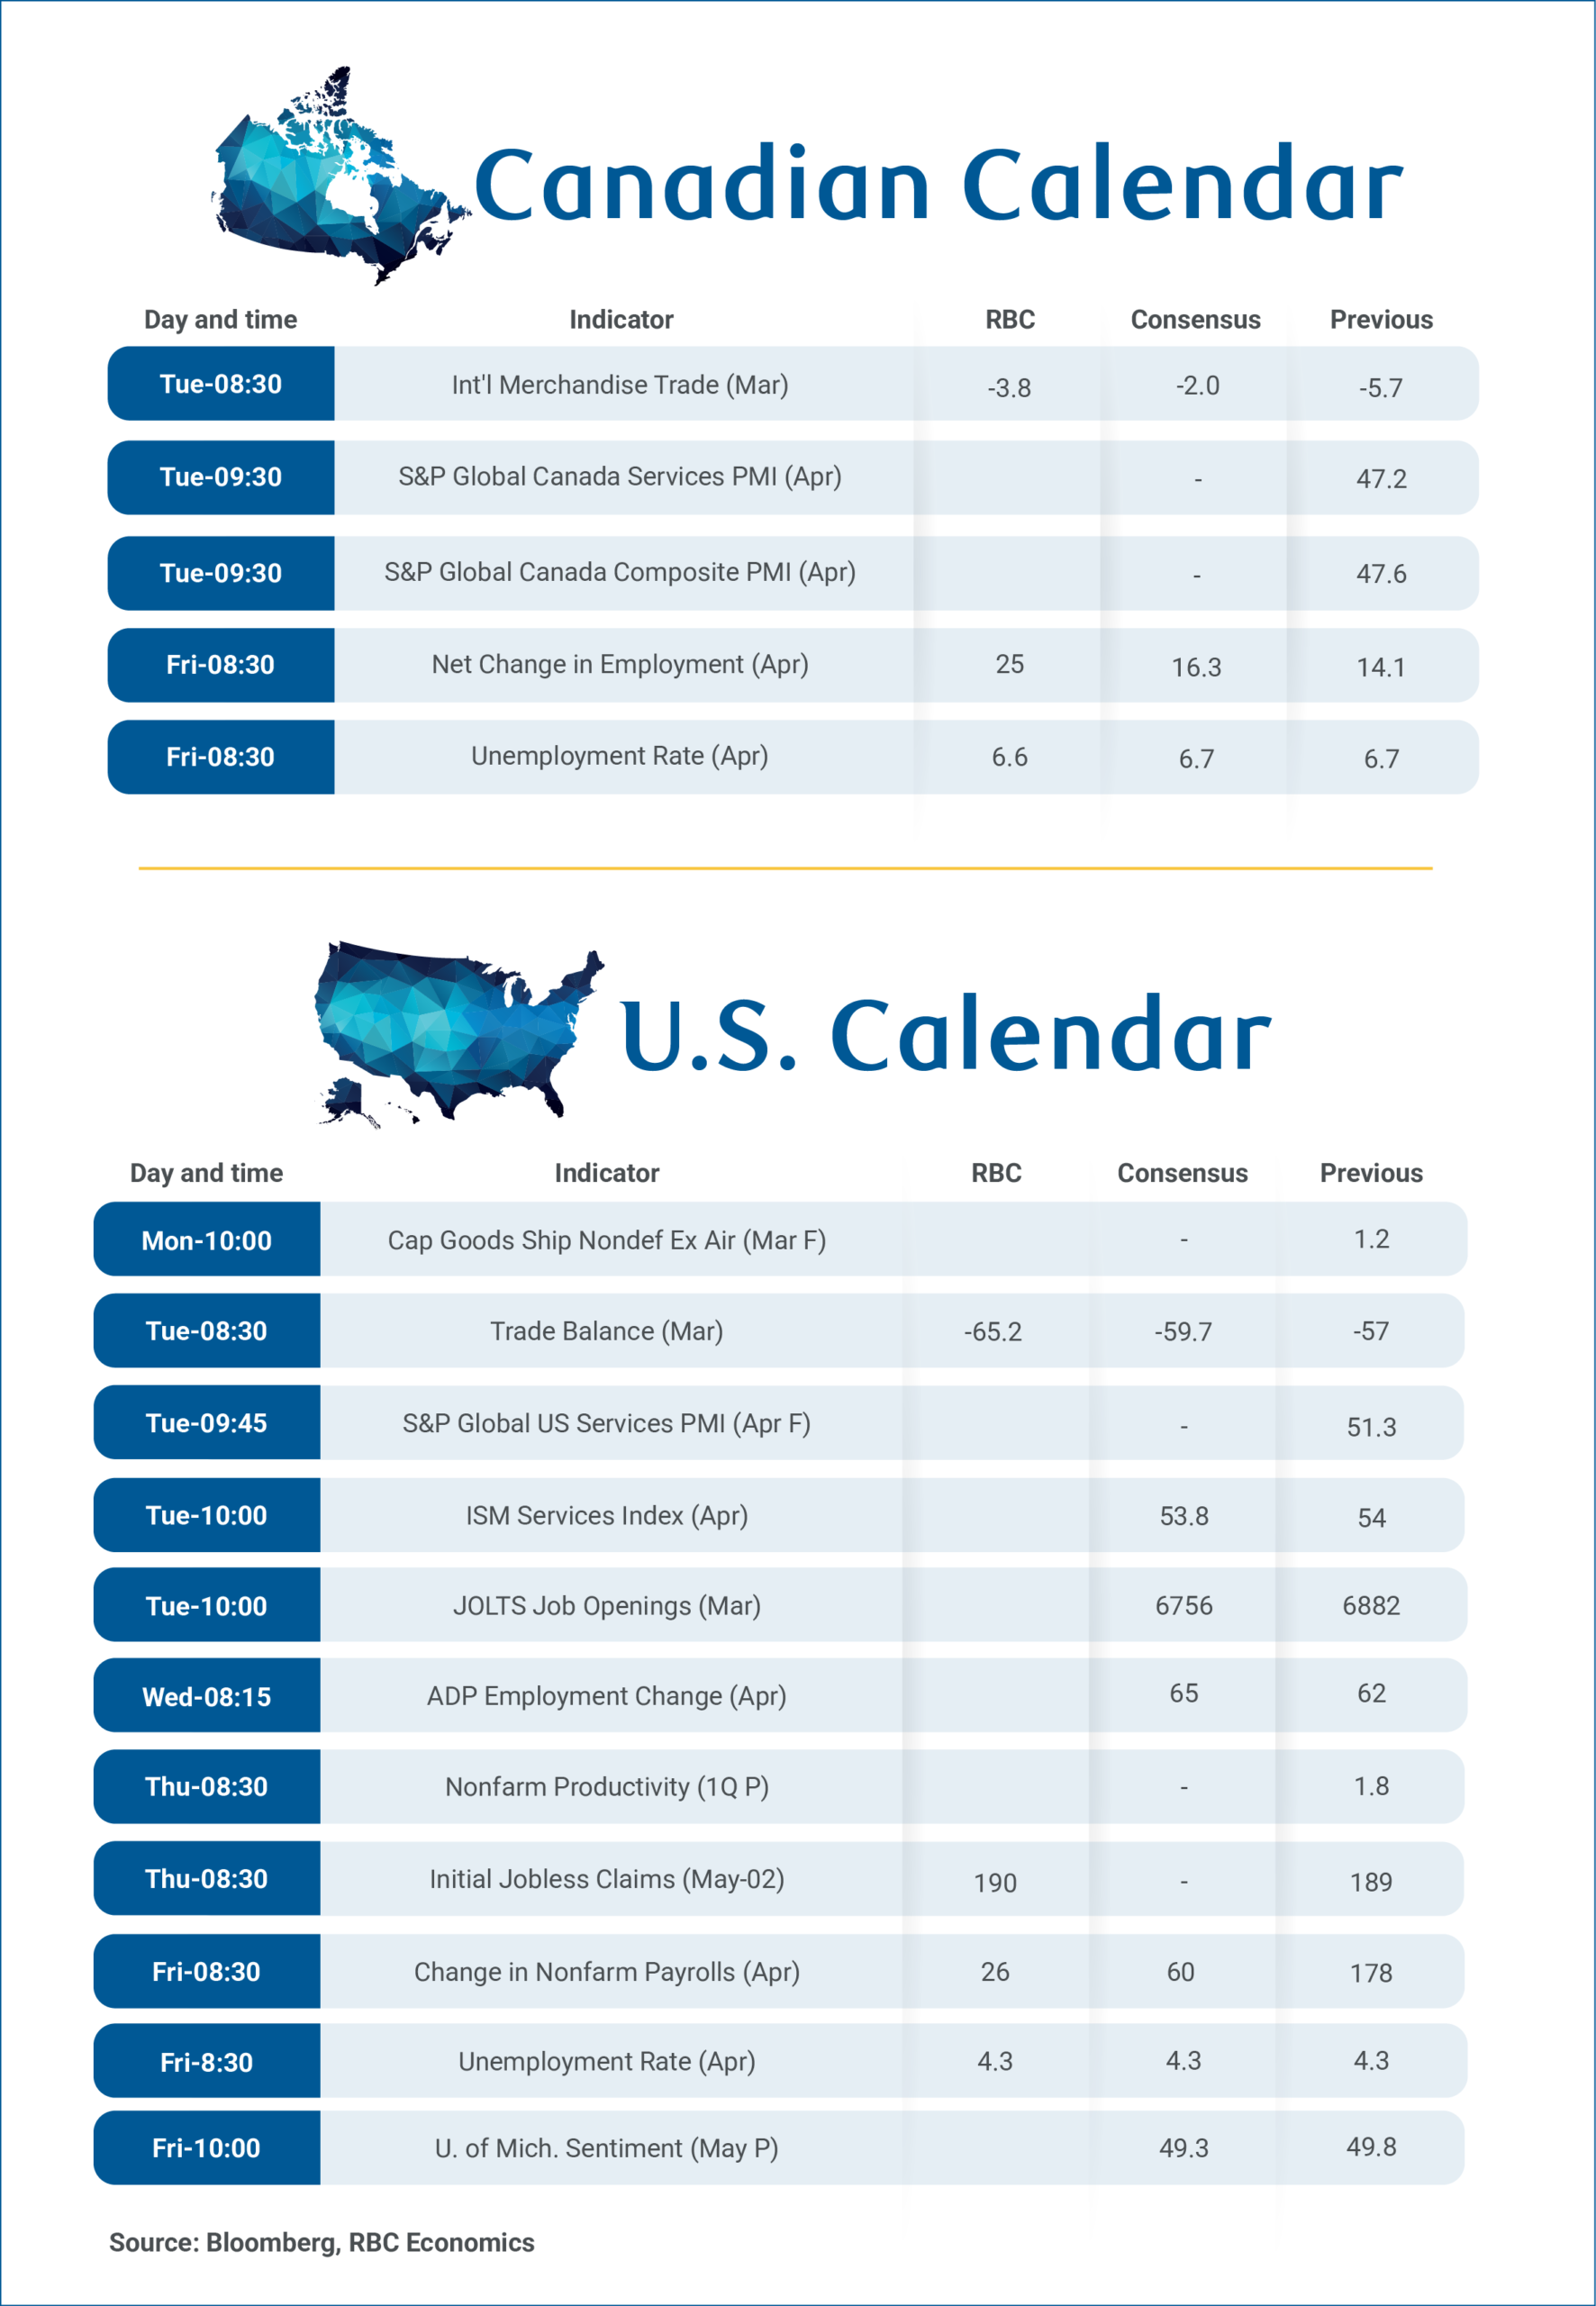
Canadian international trade data has been exceptionally volatile, but the merchandise trade deficit should narrow in March with a 40% surge in oil prices due to the Middle East conflict pushing the energy surplus higher. We look for exports to rise almost 5%, and imports to post a smaller 1.5% increase, pushing the trade deficit down to -$3.8 billion from -$5.7 billion in February.
We expect U.S. nonfarm payrolls added just 26,000 jobs in March—a number that, given current conditions, represents breakeven growth and has become routine. With shrinking labor supply, the U.S. does not need substantial job additions to maintain a steady unemployment rate. A meaningful decline in continuing claims between the March and April reference weeks supports our expectation that the unemployment rate will hold steady at 4.3% in March.
Weekly Focus – Steady Central Banks Weigh Their Options
Crude oil prices continued higher this week as the market is becoming increasingly sceptical about the prospect of a near-term opening of the Strait of Hormuz. This pushed yields higher until the peak was reached and oil prices dropped sharply again on Thursday. The oil crunch has also triggered some action in the FX market where Japanese authorities intervened to support the yen for the first time since July 2024. Looking ahead, the UAE's decision to leave OPEC creates a bearish outlook for oil prices, when oil starts to flow through the strait again.
The Fed kept rates on hold at Powell's last meeting as chair. The takeaway for markets was to the hawkish side as three participants dissented against the Fed's current easing bias and Powell decided to stay on as governor which blocks Trump from nominating a dovish replacement. This means the exit of Stephen Miran, when Kevin Warsh replaces Powell as Fed chair after the Senate Banking Committee finally advanced his nomination this week. Further, Powell specified that the majority of the FOMC did not want to send a signal that a hike would be equally likely as a cut.
Growth was slightly on the weak side of expectations in Q1, as US q/q GDP growth, fuelled by a reopening of the public sector, ended up at 0.5%, on steady but cooling private consumption. The euro area almost came to a standstill at 0.1% on the back of disappointing French growth and volatile Irish data.
The EU Commission's April surveys highlighted the dilemma the ECB is faced with, and which the PMIs also reflected last week. They showed inflation expectations have surged among businesses and consumers, but confidence is declining. Noticeably service sector employment expectations recorded the steepest decline since the early pandemic shutdowns. So far, actual inflation shows no signs of broader price pressures. Core inflation even edged lower to 2.2% in April as service inflation declined to 3% for the first time in four years. Headline inflation on the other hand increased to 3%, digging into consumers' purchasing power. ECB president Lagarde is "certainly not seeing second-round effects" as she put it after the decision to keep rates on hold. A rate hike was debated but the decision was unanimous.
The Bank of England also held rates steady with an "active hold" decision, as Governor Bailey phrased it and did not push back on the hawkish market pricing as tighter financial conditions push the breaks on economic activity. Japan has for long been on a very slow-moving hiking cycle. The uncertain implications for the big energy importer caused the Bank of Japan to postpone further tightening for now. We expect them to hike their policy rate to 1% for the first time since 1995 in June. Elsewhere in Asia, Chinese exports remain the key growth engine highlighted by solid April manufacturing PMIs above 50 from both official and private measures. The non-manufacturing PMI on the other hand fell below 50 and the construction sector slowdown accelerated further, leaving the economy vulnerable to a global downturn.
Next week a whole string of labour market reports is published in the US, concluding with the jobs report on Friday, where we expect a solid 80K new jobs. We expect unemployment, which is more important for the Fed, to be unchanged at 4.3%.
Ethereum (ETH) on Path to a Continued Breakout – Will It Pull Other Altcoins?
Ethereum has slowly broken out of its October downtrend that had led to its progressive, but brutal 64% correction.
Global disinterest for high-beta, AI and Tech assets had shun interest for Cryptocurrencies but with the Conflict turning the script on Energy prices, hence normal consumption, traders slowly turned away from traditional assets.
The idea is that Digital Assets are fairly isolated from any rise on Crude Oil or Nat Gas, quite the contrary. Crypto mining is energy intensive; hence, with higher costs, mining gets less interest, so that provides a temporary supply restriction which has a boosting effect on Cryptos.
Since the beginning of the conflict, Bitcoin and Ethereum are up 20%, while the Total Market Cap is up just a bit less (~18%) – While there is still a lot to cover to return to all-time highs, this is strong progress; Bulls will want to keep pushing and they might just turn the trend around.
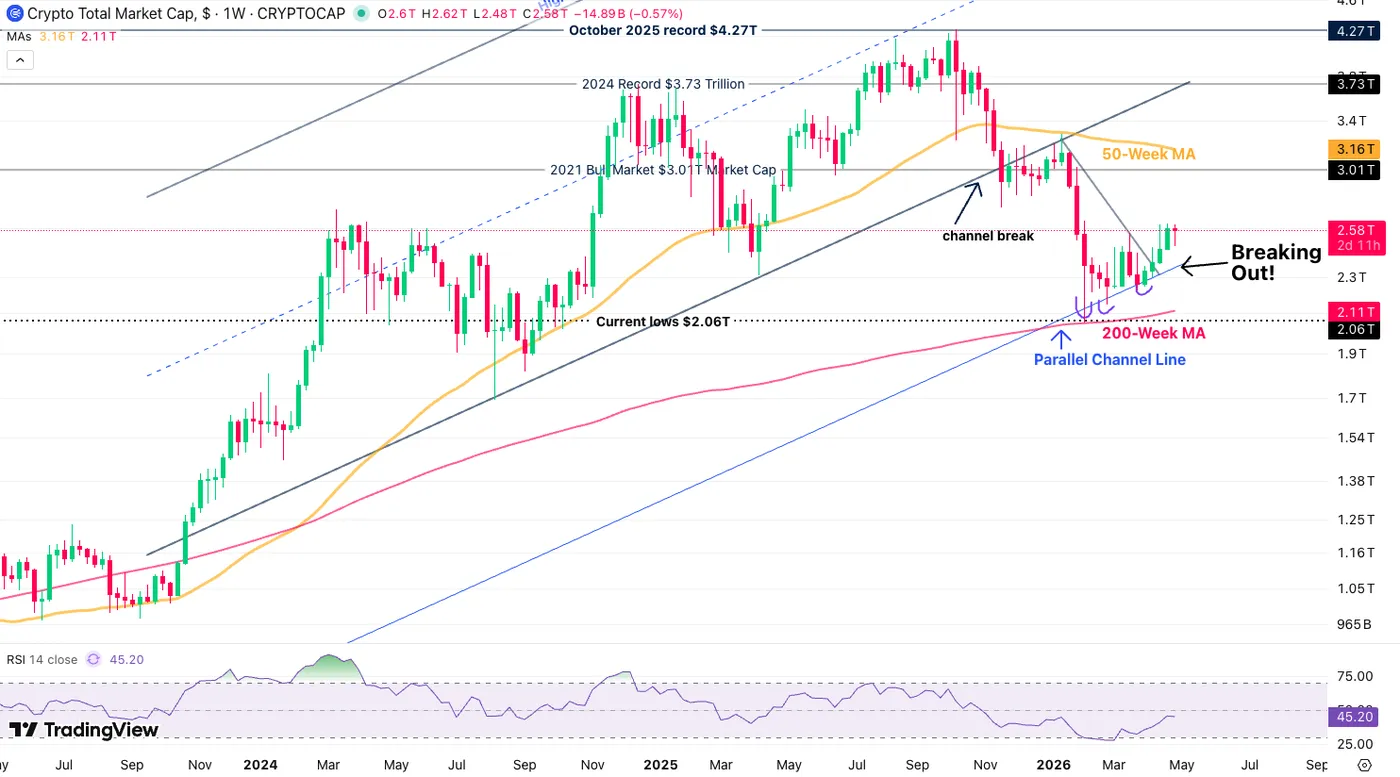
Crypto Total Market Cap – Source: TradingView. May 1, 2026
ETH/BTC – Bull flag formation?
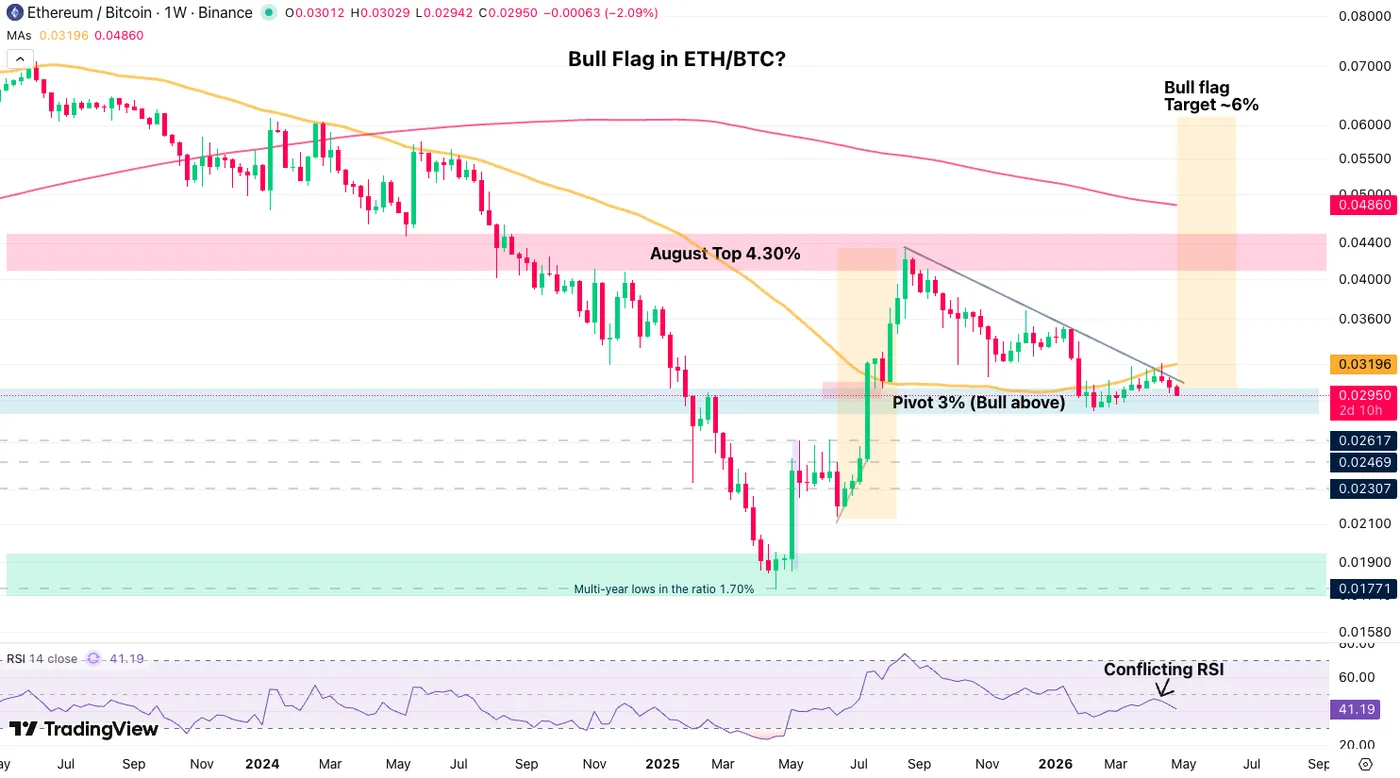
ETH/BTC – Source: TradingView. May 1, 2026
The Second to First Crypto ratio is essential to track the appetite for Altcoins, key to depth in the Digital Asset Market as Bitcoin had taken a significant advantage since it started rallying to its first $100,000 trip – The initial drop in ETH in August 2025 marked a top in the ratio
Today, ETH/BTC is hanging right around the 3% level, which itself does not imply much about the state of the Crypto Market, however, a bull flag formation could bring some happy days for Alternative Coins.
Its target is at 6% of the Bitcoin price, hence that would signify a significant rally in Ethereum which tends to trigger altcoin rallies (except if Bitcoin slashes its value, but in the past, that often reduced the ratio in a flight to Crypto Safety).
Ethereum Technical Analysis
ETH Daily Timeframe
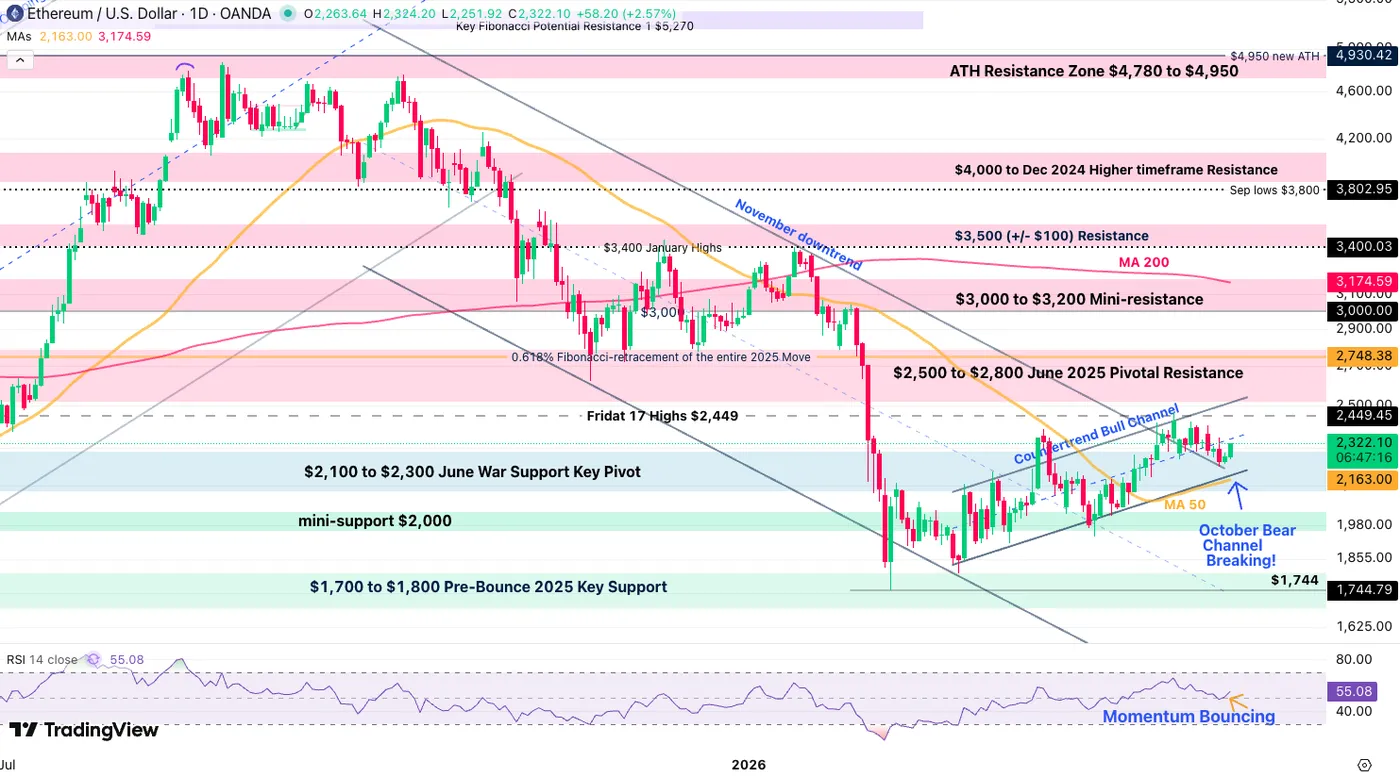
Ethereum Daily Chart, May 1, 2026 – Source: TradingView
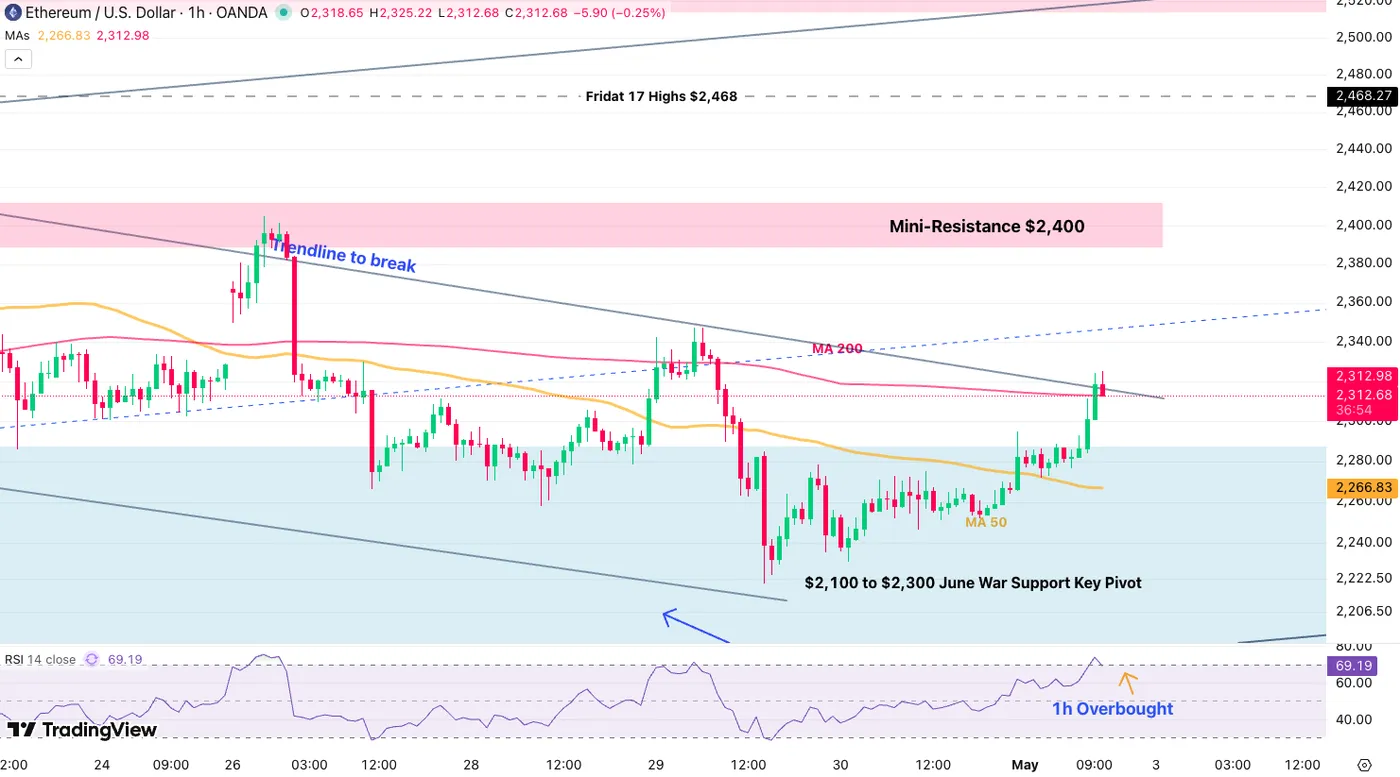
Ethereum has now officially consolidated above its key $2,100 to $2,300 Pivot Zone and pushed above its downward Channel.
While momentum is still timid, a bounce from Neutral RSI, confirming with a nascent bull channel brings back higher odds to retest the $2,500 level (not seen since January).
ETH 4H Timeframe and Technical Levels
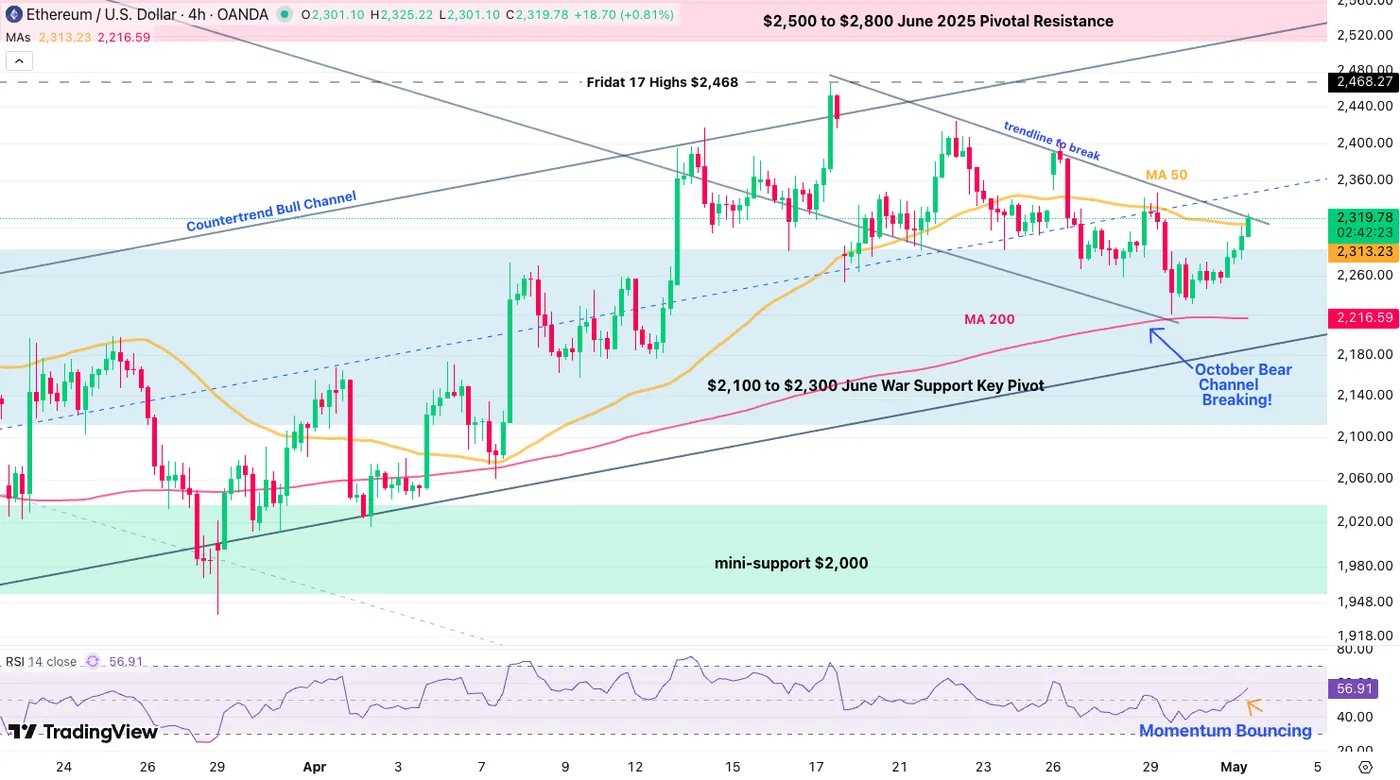
Ethereum 4H Chart, May 1, 2026 – Source: TradingView
Ethereum is forming an intraday tight bull channel after finding its bottom at the FOMC, right around the 4H 200-period MA.
Currently testing a break of a short-term top-line, bulls are already pushing above the 50-period MA and that provides the needed signs for continued upside.
To confirm, look for an hourly close above $2,330 which would hint to a rally to the top of the counter-trend bull channel ($2,520).
Levels of interest for ETH trading:
Support Levels:
- $2,100 to $2,300 June War Support Key Pivot
- $2,215 4H 200-period MA
- Channel lows $2,000
- $1,700 to $1,800 Pre-Bounce 2025 Key Support (testing)
- $1,744 February 6 lows
Resistance Levels:
- Trendline top $2,330
- $2,400 mini-resistance
- $2,500 to $2,700 June 2025 Key Support now Resistance (Channel Highs)
- $3,000 to $3,200 Major momentum Pivot (Test of the $3,000)
- $4,950 Current new All-time highs
Ethereum 1H Chart
Ethereum 1H Chart, May 1, 2026 – Source: TradingView
The shorter timeframe points to momentum slightly exhausting with a short-term double top and overbought RSI, but with this price action, the pull back should not extend much beyond $2,300.
Breaking the 50-Hour MA ($2,266) cancels out the bull attempt in would imply further consolidation in times ahead.
Safe Trades!
US ISM Manufacturing Holds at 52.7 as Price Pressures Surge and Employment Weakens
US ISM Manufacturing PMI held steady at 52.7 in April, signaling continued expansion in the sector and broadly aligning with a moderate growth outlook. Based on historical relationships, the reading corresponds to around 1.8% annualized GDP growth, suggesting that manufacturing is still contributing positively to overall economic activity.
Beneath the headline, the details were mixed. New orders improved from 53.5 to 54.1, indicating firm demand conditions, while production eased from 55.1 to 53.4, pointing to some moderation in output momentum. The labor market remains a weak spot, with the employment index falling further from 48.7 to 46.4, highlighting ongoing softness in hiring within the sector.
The most notable development was the sharp rise in price pressures. The Prices Index surged from 78.3 to 84.6, extending a three-month increase of 25.6 points and reaching its highest level since April 2022. This reflects intensifying cost pressures, driven in part by supply disruptions and higher energy prices linked to the ongoing Middle East conflict.
Sentiment among manufacturers remains cautious. During the second month of the Iran War, 69% of comments were negative compared to 31% positive, with nearly half referencing the conflict and others highlighting tariffs.
| Indicator | March | April | Change |
|---|---|---|---|
| PMI | 52.7 | 52.7 | — |
| New Orders | 53.5 | 54.1 | ↑ +0.6 |
| Production | 55.1 | 53.4 | ↓ -1.7 |
| Employment | 48.7 | 46.4 | ↓ -2.3 |
| Prices | 78.3 | 84.6 | ↑ +6.3 |
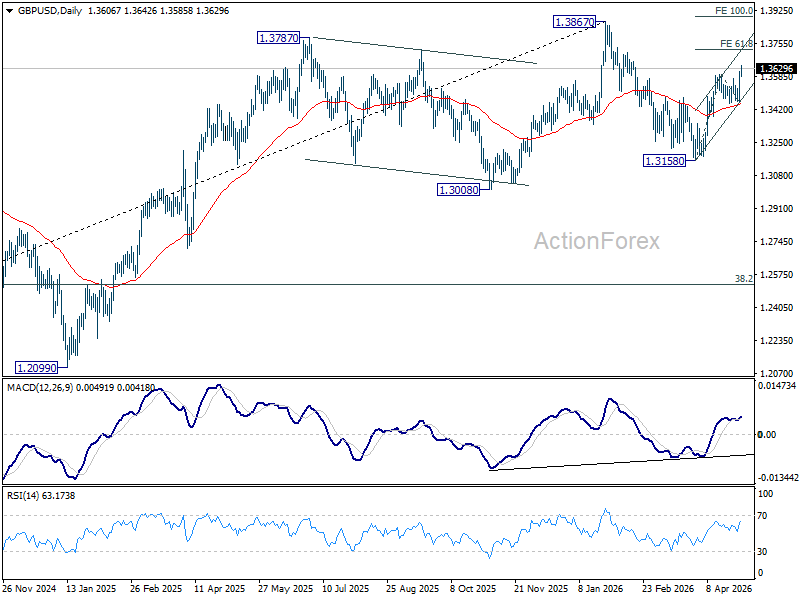
GBP/USD Mid-Day Outlook
Daily Pivots: (S1) 1.3502; (P) 1.3557; (R1) 1.3660; More...
Intraday bias in GBP/USD remains on the upside for the moment. Rise from 1.3158 is in progress for 61.8% projection of 1.3158 to 1.3598 from 1.3453 at 1.3725 first. Firm break there will target a retest on 1.3867 high. For now, risk will stay on the upside as long as 1.3453 support holds, in case of retreat.
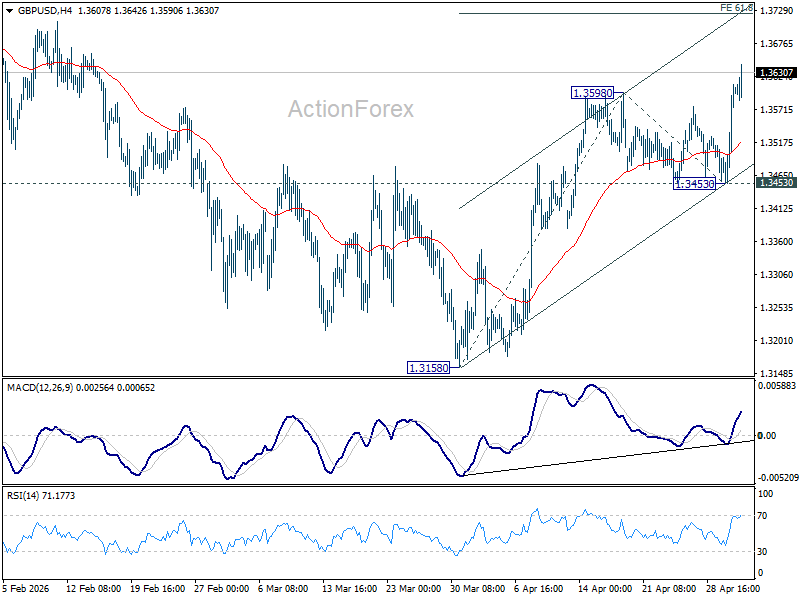
In the bigger picture, current development suggests that price actions from 1.3867 are merely a corrective pattern within the broader up trend from 1.0351 (2022 low). With 1.3008 support intact, medium term bullishness is maintained and break of 1.3867 is back in favor for a later stage, towards 1.4248 key resistance (2021 high).
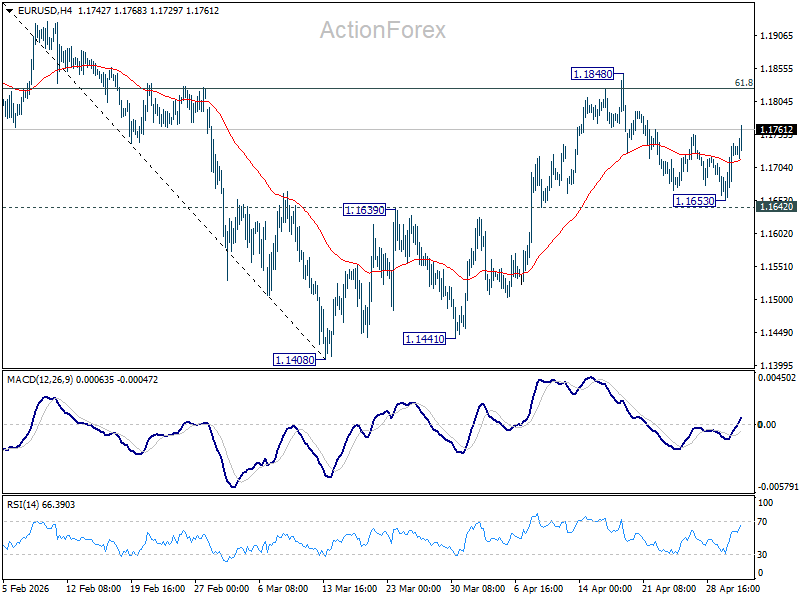
EUR/USD Mid-Day Outlook
Daily Pivots: (S1) 1.1677; (P) 1.1709; (R1) 1.1764; More….
Intraday bias in EUR/USD stays neutral, and further rise is in favor with 1.1642 support intact. On the upside, sustained trading above 61.8% retracement of 1.2081 to 1.1408 at 1.1824 will pave the way to retest 1.2081 high. However, firm break of 1.1642 support will indicate the the rebound from 1.1408 has completed, and bring deeper decline back towards this low instead.
In the bigger picture, the strong support from 38.2% retracement of 1.0176 to 1.2081 at 1.1353 suggests that the pullback from 1.2081 is more likely a corrective move. Strong support was also found in 55 W EMA (now at 1.1530). Focus is back on 1.2 key cluster resistance level. Decisive break there will carry long term bullish implications. Nevertheless, break of 1.1408 support will revive the case of medium term bearish trend reversal.