Sample Category Title
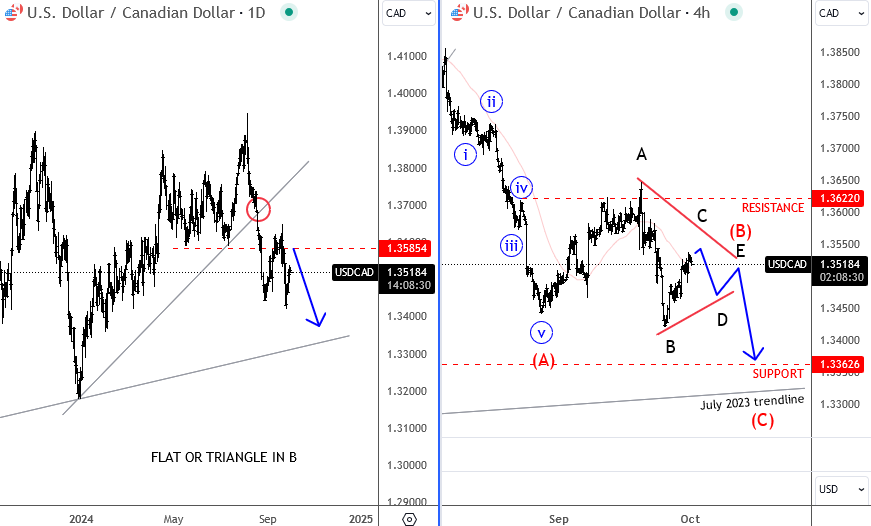
USD/CAD Can Be Trapped in a Triangle – More Weakness After Completed A-B-C-D-E Waves
USDCAD is reversing south after an unsuccessful push above 2022 highs, so it appears that pair is back in the range after making the first impulsive drop to 1.3450 back in August. Notice that after that drop in A, price rallied in wave (B) as expected, and stoped perfectly at 1.36 area as discussed in past updates. But notice that pair is actually now sideways, and back in 200 pip range, rather than bearish, so it appears that this can be a triangle with more weakness in view, but after A-B-C-D-E legs are completed. We still think that sooner or later USDCAD can drop to July 2023 trendline.
https://www.youtube.com/watch?v=Voo9o1iJZSQ
Fed Powell Implicitly Defends the Base Case in September Dot Plot
Markets
Fed Chair Powell implicitly defended the base case as set out in the updated September dot plot. This year’s median suggested an additional 50 bps of cumulative Fed rate cuts, being 25 bps in November and 25 bps in December with the Fed taking its time after the bumper liftoff. Powell indicated that the economy is in a solid shape. If it performs as expected that would mean two more (25 bps) cuts this year. The committee isn’t in a hurry to cut rates quickly. With two economic updates and one inflation print between now and the next, November 7, policy meeting, Powell nevertheless kept his options open. “Ultimately we will be guided by the incoming data. And if the economy slows more than we expect, then we can cut faster. If it slows less than we expect, we can cut slower.” The market implied probability of a 50 bps November step dropped from 50% to 37% in the wake of the comments (EUR/USD bumped again into 1.12 resistance), but we expect more and wilder swings to come. Starting this week, but likely lasting throughout the month as we fear that the debate won’t be settled any time soon. We stick to our 50 bps rate cut call. The September Chicago PMI kicked off this week’s flurry of eco data with a near consensus print (46.6 from 46.1 vs 46 expected). Things become more interesting today with JOLTS job openings and the manufacturing ISM. The first is on a steady decline since hitting peak levels in Q1 2022. A continuation could bring JOLTS for the first time below the pre-pandemic peak (7.6mn) and raise more questions about the shape of the labour market. The second is mired in recession territory since Q4 2022 with no signs of revival expected. The combination of the both can immediately contrast with Powell’s baseline scenario as set out yesterday. The start of the first East and Gulf port strikes since 1977 as dockworkers contracts’ expired without new deal are a wildcard for trading. The longer the shutdown takes, the bigger the negative impact on the economy but also the higher the impact on prices. Port employers raised their offer from a 40% to 50% increase over six years, but unions stand by their demands for a 77% pay bump as condition to restart negotiations.
Today’s EMU September CPI print is especially interesting for core CPI and services CPI metrics as ECB President Lagarde yesterday suggested that she also sees a downward trend (in core) with services inflation beginning to abate. She will take increased disinflation confidence into stride at the October policy meeting while the suppressed level of some survey indicators suggests that the recovery is facing headwinds. Both boost chances that the ECB could pull the trigger in October. We keep a close eye on speeches by individual ECB members as well to see whether everybody’s on the same line as the ECB president.
News & Views
Japan’s Tankan survey signaled a strong business sentiment in Q3, especially in services. The non-manufacturing gauge polling for current conditions unexpectedly rose to 34, matching the March top which was the highest in 33 years. Its outlook gauge grinded higher to a 33-year high as well, though came in a bit below estimates (28 vs 30, from 27). Manufacturing stabilized at the Q2 levels of 13 (current conditions) and 14 (outlook), defying expectations for a slight decline to 12 of the both. Industries across the spectrum plan to increase investments by 10.6% in the fiscal year ending March 2025. That’s slightly less than the 11.1% in Q2 and below a 11.9% consensus estimate. Businesses expect CPI inflation at 2.2% in five years’ time, the same as in the previous edition and above the Bank of Japan’s 2% target. The combination with solid business sentiment effectively greenlights further monetary policy normalization. Another rate hike isn’t priced in by markets before January of next year though. JPY loses some ground today (USD/JPY 144.3) but that had to do with the release of relatively dovish BoJ September Minutes.
Australian retail sales rose 0.7% in August, picking up from a near-flat 0.1% in July. Head of business statistics at the Australian Bureau of Statistics Ewing attributed the solid rise to warmer-than-usual weather. Retail turnover rose in most industries with department stores in the non-food segment showing the largest rise (+1.6%), followed by clothing, footwear and personal accessory retailing (1.5%) and other retailing (1.3%). The warmer end to the winter months also boosted dining out at cafes and restaurants as well as alcohol consumption at home. The Aussie dollar gains some territory this morning in the wake of the release. AUD/USD is testing recent highs around 0.693.
Graphs
GE 10y yield
The ECB cut policy rates by 25 bps in June and in September. Stubborn inflation (core, services) make follow-up moves less evident. We expect the central bank to stick with the quarterly reduction pace. Disappointing US and unconvincing-to-outright-weak EMU activity data dragged the long end of the curve down. The move accelerated during the early August market meltdown.
US 10y yield
The Fed kicked off its easing cycle with a 50 bps move. It is headed towards a neutral stance now that inflation and employment risks are in balance. Conservative SEP unemployment forecasts risk being caught up by reality and with it the dot plot (50 bps more cuts in 2024). We hold our call for two more 50 bps cuts this year. Pressure on the front of the curve and weakening eco data keeps the long end in the defensive for now as well.
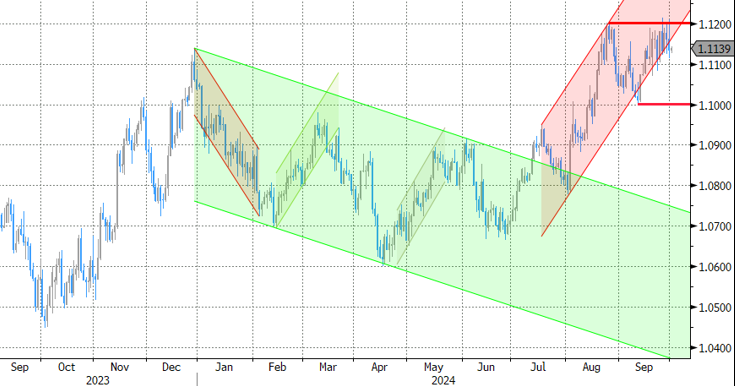
EUR/USD
EUR/USD moved above the 1.09 resistance area as the dollar lost interest rate support at stealth pace. US recession risks and bets on fast and large rate cuts trumped traditional safe haven flows into USD. An ailing euro(pean economy) only briefly offset some of the general USD weakness. EUR/USD’s dollar-driven ascent is nearing resistance around 1.12 again.
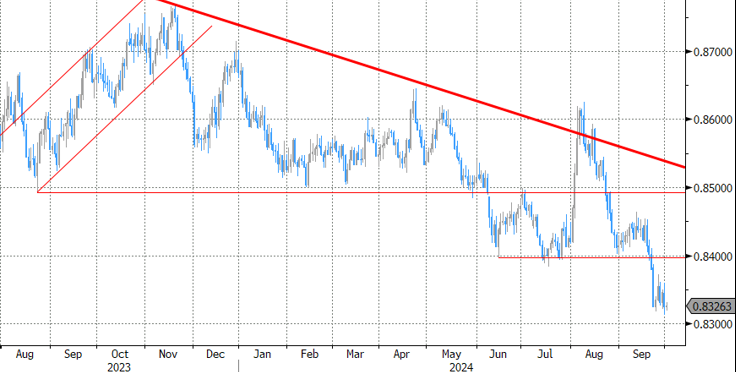
EUR/GBP
The BoE delivered a hawkish cut in August. Policy restrictiveness will be further unwound gradually on a pace determined by a broad range of data. The strategy similar to the ECB’s balances out EUR/GBP in a monetary perspective. But the economic picture is increasingly diverging to the benefit of sterling. EUR/GBP succumbed to horrible European September PMI’s. Support at 0.84 broke and brings the 2022 low (0.8203) on the radar.
Euro Area Inflation and US Labour Market Data in Focus
In focus today
Today, focus is on euro area HICP inflation from September. We expect headline inflation to decline to 1.6% y/y from 2.2%, below consensus of a decline to 1.8%, due to the lower-than-expected prints from Spain and France. Energy inflation drives most of the downtick while core inflation should only decline to 2.7% y/y. The most important part of the print will be the monthly increases in services inflation, which remain high, but momentum is clearly coming down as per the released country data so far.
At 16.00 CET, both US ISM Manufacturing index for September and JOLTs job openings for August will be due for release. The flash manufacturing PMI released earlier signalled weakening demand amid declining new orders and rising inventories. Job openings are a key gauge of labour demand for the Fed, and any further declines would indicate a rising chance of a more pronounced uptick in unemployment rate. Overnight, Republican J. D. Vance and Democrat Tim Walz will face off in the US Vice Presidential debate.
At 09.30 CET, the Riksbank Minutes from last week's meeting will be released. The minutes will be interesting given the somewhat mixed message regarding the next step. The rate path, the press conference, and the day-after analyst meeting at the Riksbank signalled a bias toward a 25bp rate cut. However, the press release clearly and explicitly opened the door for a 50bp rate cut.
Economic and market news
What happened yesterday
In the US, Fed Chair Jerome Powell stated that the Fed is in no rush to cut rates quickly, signalling two more 25bp rate cuts this year if the economy evolves as expected. Powell also emphasized that risks are two-sided and decisions will be made on a meeting-by-meeting basis. Atlanta Fed President Raphael Bostic indicated support for another 50bp rate cut in November if job growth slows faster than expected, but his baseline stance is for an "orderly" easing cycle over the next 15 months, bringing the policy rate to 3.00-3.25% by the end of 2025. We share a similar view, expecting rate cuts of 25bp at each meeting until June, with the policy rate reaching 3.00-3.25% by end-2025.
In the euro area, ECB president Christine Lagarde said that the ECB is becoming more optimistic that they can bring inflation down to the 2% target, which will be reflected at the next monetary policy meeting in October. At the same time, she also highlighted that September's inflation data for the euro zone would be below the ECB's baseline projections. We expect the ECB to deliver a rate cut of 25bp in October, bringing the deposit rate to 3.25% -
In Germany, CPI inflation for September was slightly below expectations, declining to 1.6% y/y from 1.9% y/y in August, while HICP fell to 1.8%, as expected. The downtick was primarily due to energy inflation, while the core measure also edged lower to 2.65% y/y from 2.75% y/y. The important services inflation declined to 3.79% y/y from 3.87% y/y on the back of a monthly rise of around 0.25% m/m s.a. While the yearly growth rate remains high, momentum is now cooling when looking at different measures.
In Switzerland, as expected, the SNB largely remained sidelined with FX intervention selling just 103mn CHF in Q2 2024 down from 281m in Q1. We have repeatedly highlighted that the SNB will commence on FX intervention as the policy rate nears zero. We anticipate intervention later this year if the CHF continues to strengthen in real trade-weighted terms. This week's focus is on Swiss inflation data for September, due Thursday, where monthly pressures are set to ease even further. We expect a final 25bp cut in December from the SNB, bringing the policy rate to 0.75%.
Equities: Global equities were lower yesterday amidst a highly mixed global setting. Chinese markets continued their ascent, bolstered by broad policy support. In contrast, Japan experienced a sharp decline following the election of the new Prime Minister. European markets also dipped, an occurrence that raises questions about whether this was due to or despite very low inflation figures. In the US, markets moved higher following comments from Powell indicating that the Federal Reserve is not in a rush to cut rates. Sector performance was as mixed as the regional outcomes, albeit with a slight inclination towards defensive outperformance.
In the US yesterday, the Dow closed up by +0.04%, the S&P 500 by +0.4%, the Nasdaq by +0.4%, and the Russell 2000 by +0.2%. China has commenced their Golden Week holiday today; consequently, there was no significant market activity this morning. South Korea is also closed today, and their PMIs will not be published until tomorrow. Japanese equities are catching up this morning after the big underperformance yesterday. European futures are positive, while US futures are showing a mixed performance this morning.
FI: US bond yields rose modestly on the back of slightly hawkish comments from Fed Chairman Powell. Hence, 2yr Treasuries rose almost 10bp yesterday, while 10Y Treasuries rose 3bp yesterday.
FX: US yields rose as Powell pointed to two more 25bp cuts this year, contingent on the US economy performing as expected. The greenback found support in rising yields, but EUR/USD remains in the 1.11-1.12 range. Scandies traded on the backfoot and the same goes for CHF, with EUR/CHF breaking back above 0.94.
ECB Can Afford to Take a More Dovish Stance
The Chinese stocks extended gains on Monday as China announced more stimulus measures and investors rushed to buy before the markets closed for national holiday today. The CSI 300 index jumped more than 8% on Monday and was up by a whopping 26% in six sessions. The Chinese stimulus measures would normally bring joy to the global markets, say 5 years ago. But interestingly, the US markets have barely reacted to the Chinese stimulus measures. The S&P500 gained barely 1% over the same period. The message is that investors think that what happens in China has increasingly less impact on the health of the global economy.
But overall, the month of September wasn’t as bad as everybody feared. The S&P500 finished the month with a 2% advance, at fresh ATH, the Dow Jones gained 1.85% and Nasdaq 100 gained 2.50% over the same month, all thanks to the Federal Reserve (Fed) which delivered a surprise 50bp cut to an economy that didn’t need it. And now Jerome Powell looks like he is willing to take a bit of that pressure off the market. He said at a speech yesterday that the US economy remains strong and that the Fed is in no rush to cut the interest rates. Maybe the Fed Chief is worried about the ripple effects of the Chinese stimulus measures on inflation? Iron ore prices recovered nearly half of this year’s losses in just six sessions, and copper futures were sent higher during the Chinese stock rally, even though the positive move was not as straightforward as the one we saw on iron ore prices. Good news – for inflation expectations - is that oil bulls were not in attendance over the past week. But if the Chinese stimulus measures work, energy and commodity prices should continue to see the benefits and that’s inflationary.
US port strikes
45’000 people are expected to walk out of their jobs in the US East and Gulf coasts today, and that could impact about 50% of US imports, including bananas, other exotic fruits, packaged food, retail items, medicine, meat, marine transportation and carmakers, etc… The cost of the US port strikes on the US economy are estimated between $4.5 to 7.5bn every week, according to Oxford Economics. That kind of pressure on supply chains is also inflationary.
The bad news is that the Biden administration is not willing to take a side in this dispute. Supply chain disruptions will cost the US economy big and put pressure on prices at a time the Fed had half-declared victory over inflation, but the administration is not willing to side with the ocean carriers either that made record profits on the back of Covid disruptions over the past 4 years. There may not be a quick fix.
More hawkish Fed, more dovish ECB
The US 2-year yield jumped above the 3.60% level on worry that the Fed may not pull out another 50bp from its that when it meets next month, and the probability of a 50bp cut declined sharply to 38%, from above 55% before Powell’s cautious speech on Monday. The US dollar index rebounded from the lowest levels in a year, and the EURUSD was offered near the 1.12 mark. The selloff wasn’t only triggered by a broadly stronger US dollar but also by the Eurozone’s own news and data. French PM announced plans to increase taxes and the latest CPI update showed that the German inflation also dipped below the European Central Bank’s (ECB) 2% target (as it has been the case for France and Spain). The aggregate CPI update for the Eurozone is due this morning and is expected to confirm that inflation in the Eurozone has well slipped below the 2% policy target. In other words, the ECB has little reason not to announce another rate cut in the October meeting. The ECB Chief Lagarde is giving a few hints that there will be more in the store for this month. She said that the ECB is becoming ‘more optimistic to get inflation under control’ and that we will see that in the October decision. As such, the markets now price in an 80% chance for a 25bp reduction from the ECB on 17th of October.
The rising dovish expectations for the ECB combined to a more balanced outlook for the Fed should keep the EURUSD under pressure. The next bearish targets stand at 1.1070, the minor 23.6% Fibonacci retracement on April to now rally, 1.10 psychological support and 1.0980, the major 38.2% Fibonacci retracement that should distinguish between the actual positive trend and a medium-term bearish reversal. Potentially soft US jobs numbers are the biggest risk to the bearish EURUSD outlook. Any weakness in the US jobs data will revive the Fed cut expectations and send the US dollar lower across the board and the latter could prevent the EURUSD from trading lower.
Intraday Elliott Wave View Favors More Downside in USDJPY
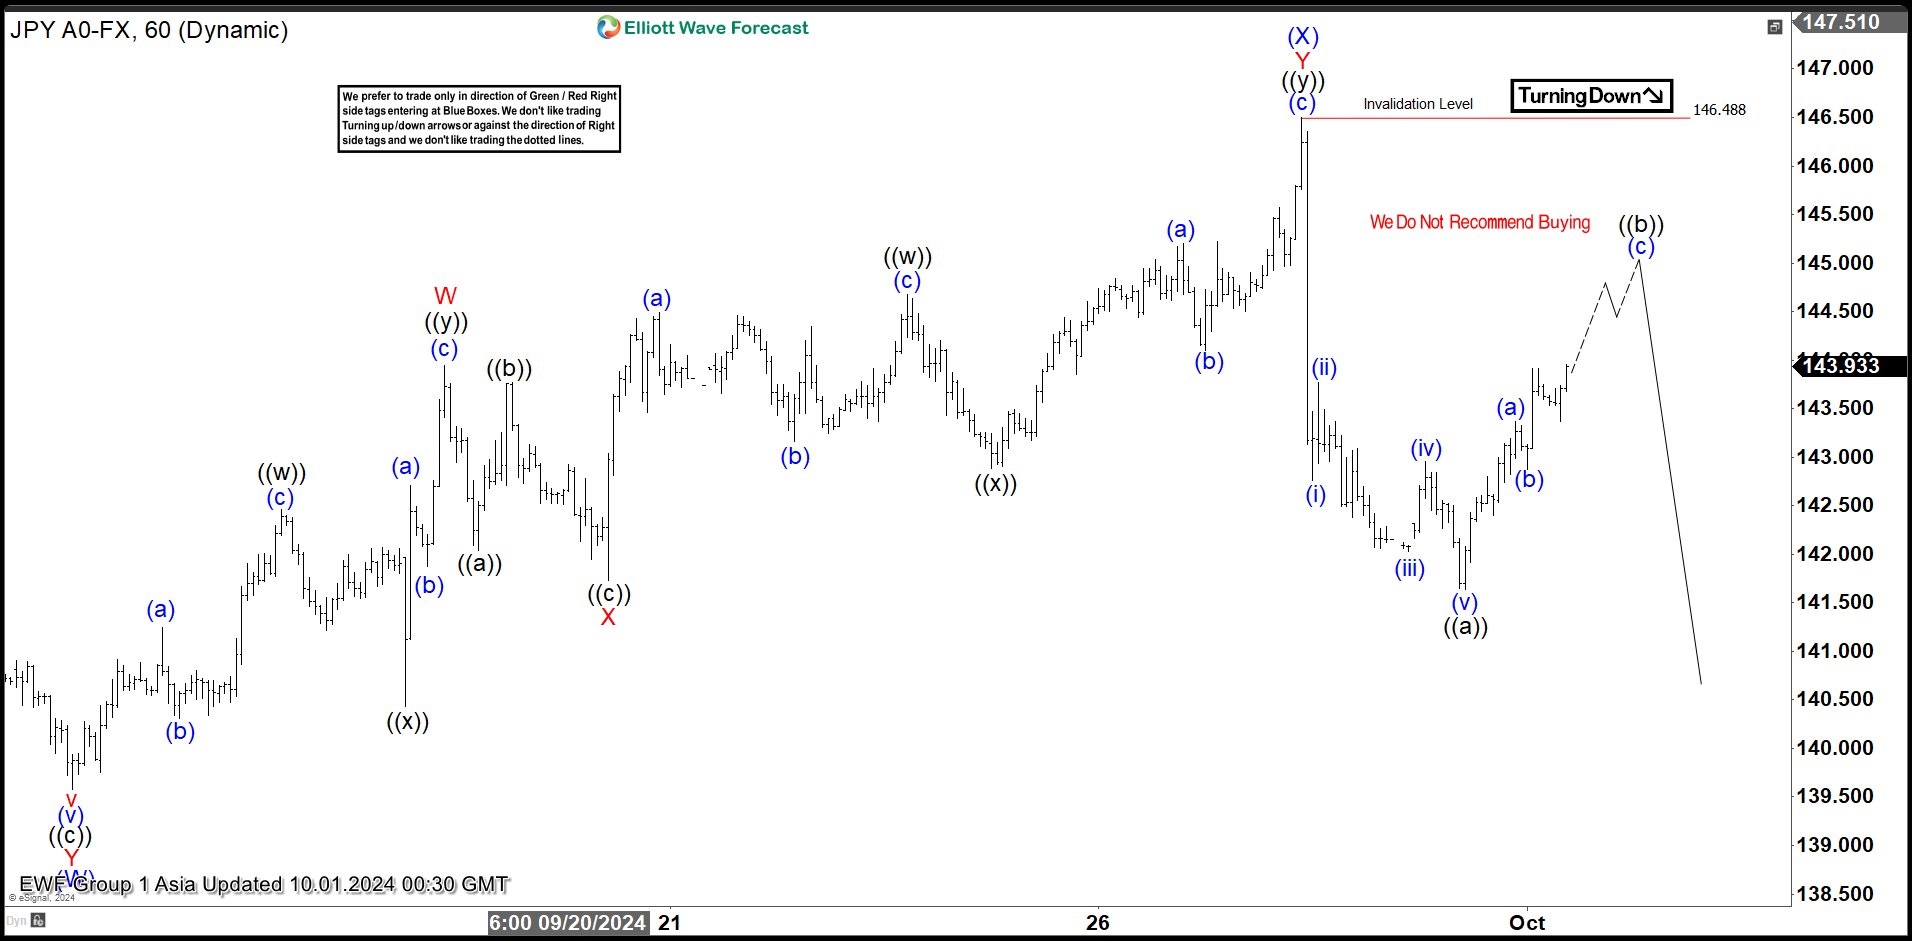
Short Term Elliott Wave View in USDJPY suggests decline to 139.57 ended wave (W). Pair then corrected in wave (X) with internal subdivision as a double three Elliott Wave structure. Up from wave (W), wave ((w)) ended at 142.46 and pullback in wave ((x)) ended at 140.43. Rally in wave ((y)) ended at 143.94 which completed wave W in higher degree. Pullback in wave X ended at 141.73 with internal subdivision as a zigzag structure.
Up from wave X, pair resumed higher in wave ((w)) towards 144.68 and pullback in wave ((x)) ended at 142.88. Final leg wave ((y)) ended at 146.48 which completed wave Y of (X) in higher degree. Pair has since turned lower in wave (Y). Down from wave (X), wave (i) ended at 142.76 and wave (ii) ended at 143.76. Wave (iii) lower ended at 142.2, and wave (iv) ended at 142.95. Wave (v) lower ended at 141.63 which completed wave ((a)) in higher degree. Rally in wave ((b)) is in progress to correct cycle from 9.27.2024 high before it resumes lower. Near term, as far as pivot at 146.48 high stays intact, expect rally to fail in 3, 7, or 11 swing for more downside.
USDJPY 60 Minutes Elliott Wave Chart
USDJPY Elliott Wave Video
https://www.youtube.com/watch?v=-wRi1wFfbn4
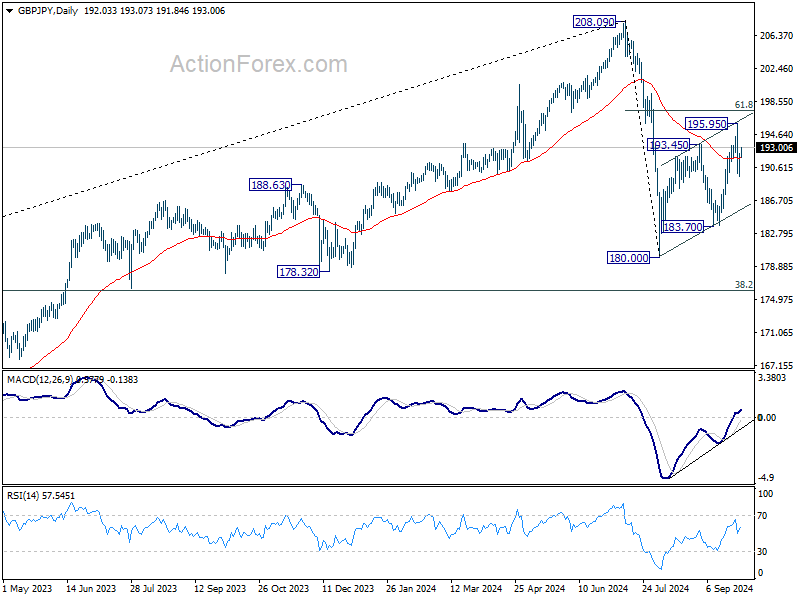
GBP/JPY Daily Outlook
Daily Pivots: (S1) 190.33; (P) 191.33; (R1) 193.09; More...
Intraday bias in GBP/JPY is turned neutral first with current recovery. Outlook is unchanged that corrective rebound from 180.00 might have completed with three waves up to 195.95. Risk will stay on the downside as long as 195.95 resistance holds. Below 189.54 will target 183.70 support. However, break of 195.95 will resume the rebound form 180.00 instead.
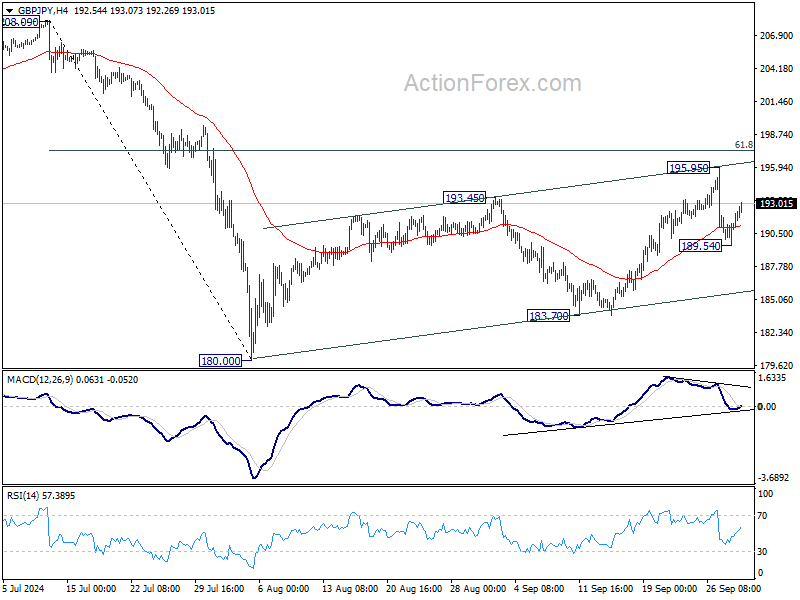
In the bigger picture, price actions from 208.09 are seen as a correction to whole rally from 123.94 (2020 low). The range of consolidation should be set between 38.2% retracement of 123.94 to 208.09 at 175.94 and 208.09. However, decisive break of 175.94 will argue that deeper correction is underway.
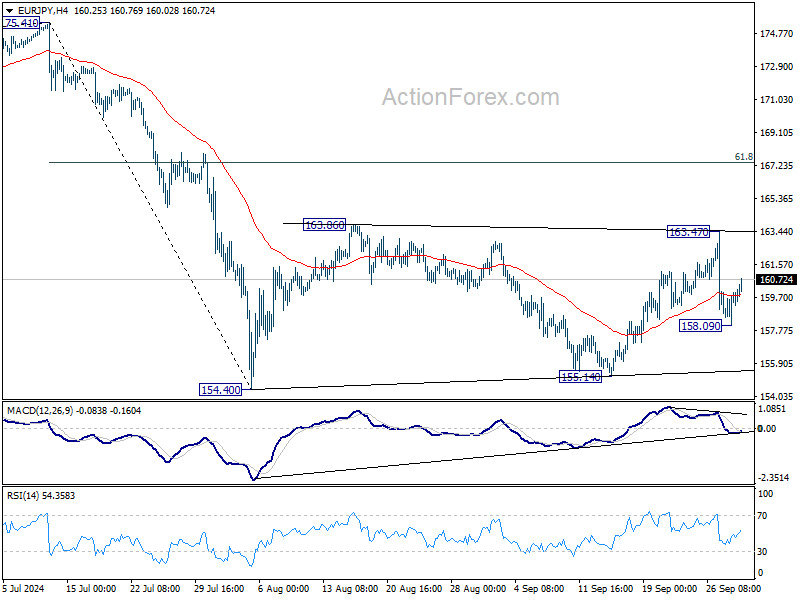
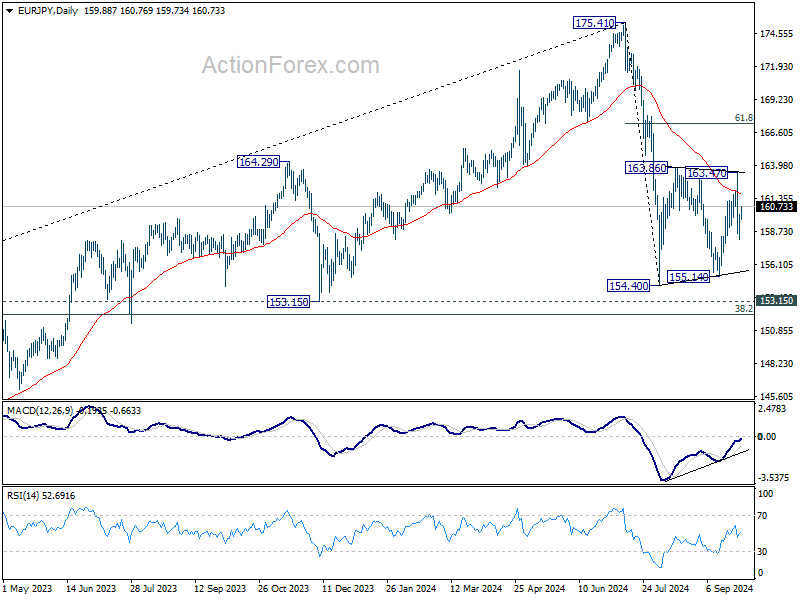
EUR/JPY Daily Outlook
Daily Pivots: (S1) 158.65; (P) 159.39; (R1) 160.67; More....
Intraday bias in EUR/JPY is turned neutral with current recovery. Outlook is unchanged that corrective pattern from 154.40 might have completed with three waves to 163.47 already. Risk will stay mildly on the downside as long as 163.47 resistance holds. Below 158.09 will target 154.40/155.14 support zone.
In the bigger picture, price actions from 175.41 are seen as correction to rally from 114.42 (2020 low). The range of consolidation should have been set between 38.2% retracement of 114.42 to 175.41 at 152.11 and 175.41 high. However, decisive break of 152.11 would argue that deeper correction is underway.
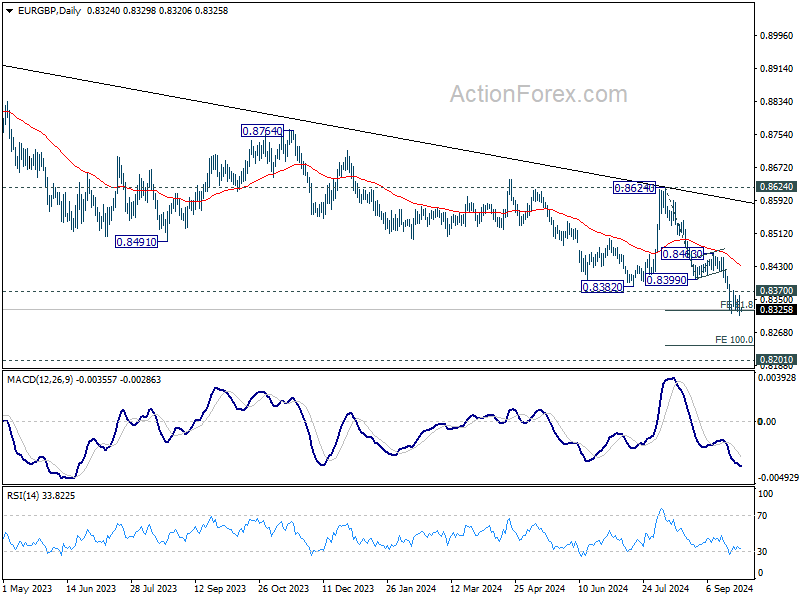
EUR/GBP Daily Outlook
Daily Pivots: (S1) 0.8305; (P) 0.8332; (R1) 0.8352; More...
Intraday bias in EUR/GBP is back on the downside with breach of 0.8316 temporary low. Sustained break of 0.8316 will resume the fall from 0.8624 to 100% projection of 0.8624 to 0.8399 from 0.8463 at 0.8237 next. On the upside, though, above 0.8370 minor resistance will turn bias back to the upside for stronger recovery.
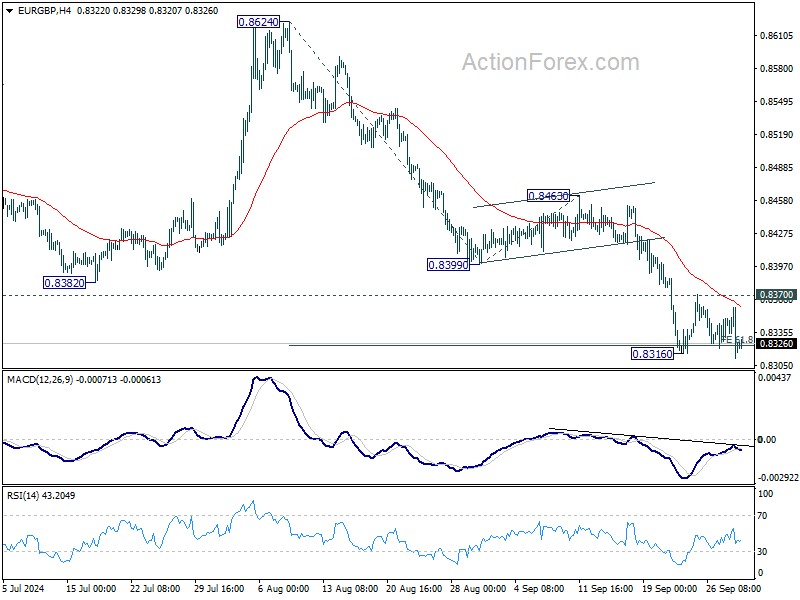
In the bigger picture, down trend from 0.9267 (2022 high) is in progress. Next target is 0.8201 (2022 low), but strong support should be seen there to bring rebound. However, outlook will remain bearish as long as 0.8624 resistance holds even in case of strong rebound.
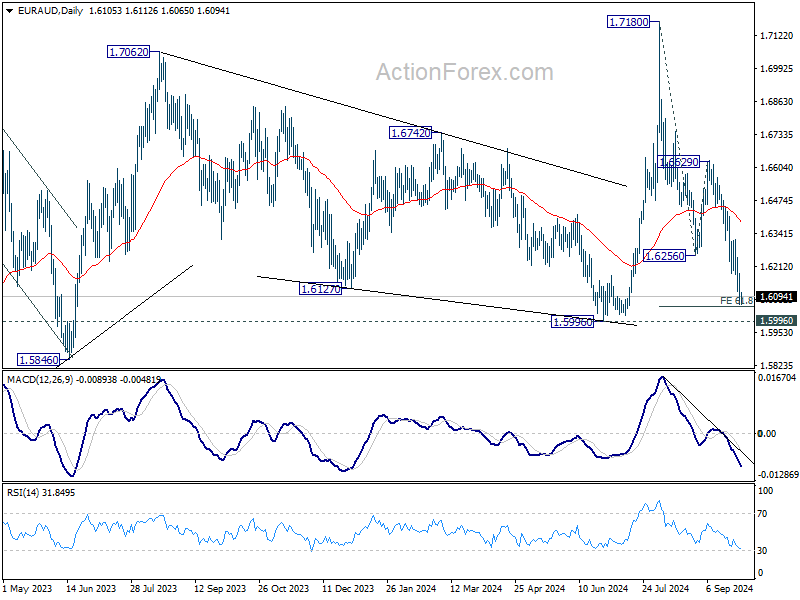
EUR/AUD Daily Outlook
Daily Pivots: (S1) 1.6050; (P) 1.6119; (R1) 1.6173; More...
Intraday bias in EUR/AUD stays on the downside as fall from 1.7180 is in progress for 61.8% projection of 1.7180 to 1.6256 from 1.6629 at 1.6058, and possibly below. But strong support should be seen from 1.5996 to contain downside and bring rebound. On the upside, above 1.6249 minor resistance will turn intraday bias neutral first.
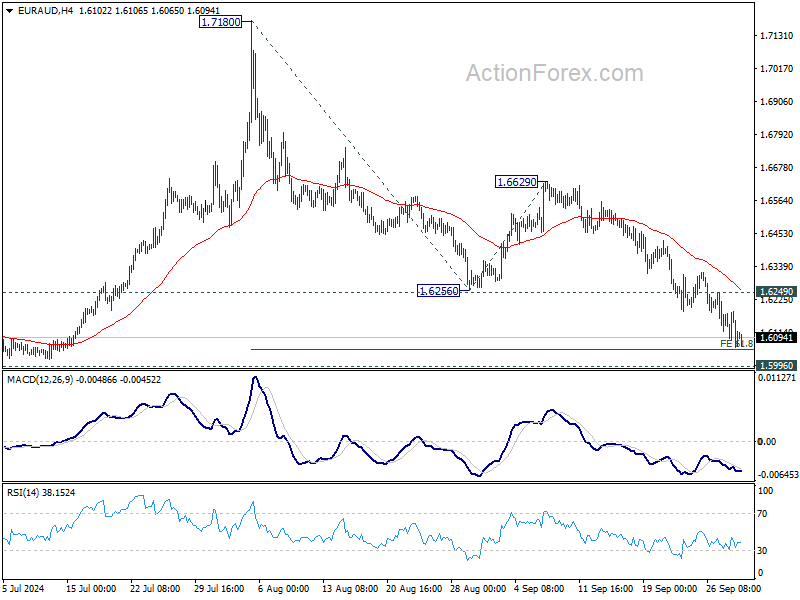
In the bigger picture, outlook is mixed up by the deeper than expected fall from 1.7180. Yet as long as 1.5996 support holds, up trend from 1.4281 (2022 low) is still in favor to resume at a later stage. However, decisive break of 1.5996 will argue that the medium term trend has reversed.
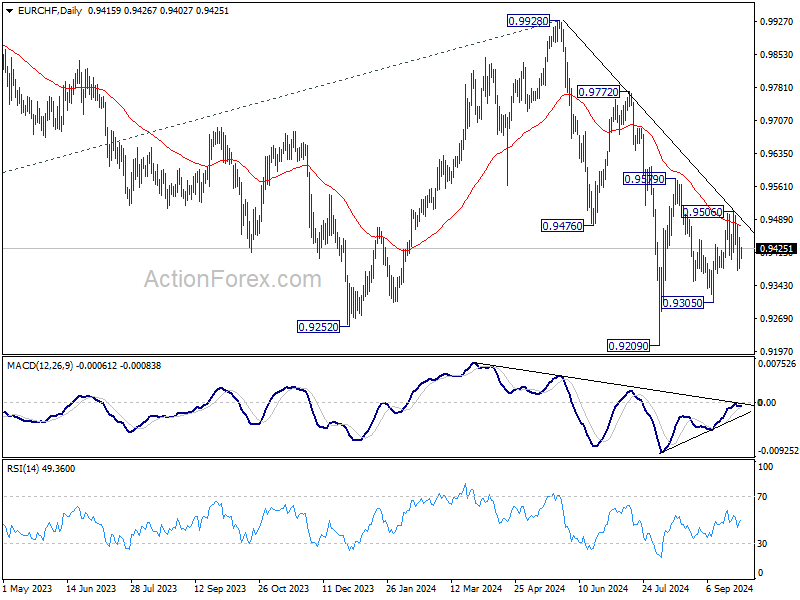
EUR/CHF Daily Outlook
Daily Pivots: (S1) 0.9382; (P) 0.9416; (R1) 0.9452; More....
Intraday bias in EUR/CHF remains neutral and outlook is unchanged. On the upside, above 0.9506 will resume the rebound from 0.9305 to 0.9579 resistance. However, break of 0.9305 will resume the fall for 0.9579 to retest 0.9209 low.
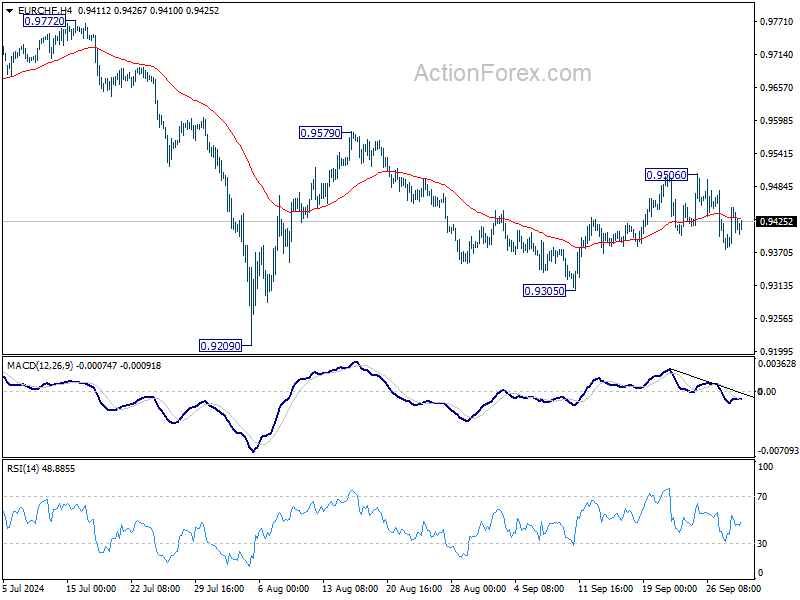
In the bigger picture, medium term corrective pattern from 0.9407 (2022 low) might have completed with three waves to 0.9928. Decisive break of 0.9252 (2023 low) will confirm long term down trend resumption. Next target will be 61.8% projection of 1.1149 to 0.9407 from 0.9928 at 0.8851. For now, outlook will stay bearish as long as 0.9928 resistance holds, even in case of strong rebound.