Sample Category Title
Fed Preview: Dovish 25bp
- We expect the Federal Reserve to cut rates by 25bp in the next week's meeting. Markets price in around 40% probability of a larger 50bp move. We do not expect changes to the pace of QT despite the Fed now initiating rate cuts.
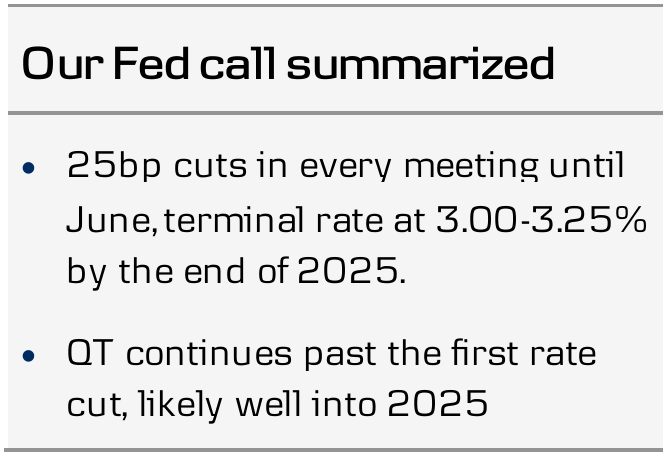
- We expect the updated dots to signal a total of 3x25bp cuts in 2024 (prev. 1) followed by 6x25bp cuts in 2025 (prev. 4). We expect no policy rate changes in 2026 (terminal rate at 3.00-3.25%, unchanged from June forecast). We foresee modest downward revisions to inflation forecast for 2024-2025 and slight upward revisions to unemployment rate forecast for 2024-2026.
- We expect Powell to communicate a series of rate cuts and to maintain the door open for larger cuts, even if they are not our base case. The combination of 25bp cut and dovish forward guidance should lead to relatively muted market reaction, but we see risks skewed towards stronger USD and higher short-end UST yields.
Markets have remained divided over the Fed's September rate decision for unusually long. We were surprised to hear both Williams and Waller explicitly avoiding giving any concrete guidance last Friday, when the Fed had just received the final piece of labour market data before of the blackout (see RtM USD: NFP left the markets hanging - we still see 25bp in Sep, 10 September).
This week's slightly faster-than-expected core CPI reading appeared to tilt the balance towards a smaller cut, markets price in around 40% of a larger move. (see Global Inflation Watch - Inflation expectations heading lower, 11 September, for details). The economy is inarguably cooling, but with no signs of rapid weakening, we still think the Fed will opt for only a 25bp reduction. And to some extent, markets have also converged towards pricing in more, but not necessarily larger rate cuts over the past few weeks.
To us, the lack of guidance signals preference for avoiding stirring up changes in current financial conditions. In other words, the Fed appears to largely agree with markets' assessment on the rates outlook.
In our view, the decision that would most likely minimize post-meeting volatility would be a 25bp cut delivered with dovish forward guidance. We expect Powell to emphasize that the cut marks a beginning of a series of rate reductions, and that the door for larger cuts remains open (even if they are not our base case).
We expect the updated median dot to signal 25bp cuts in the two remaining meetings of the year (total of 75bp of cuts in 2024, prev. 25bp), followed by six more 25bp cuts in 2025 (total of 150bp, prev. 100bp). We expect no rate cuts in 2026, which would leave the Fed's terminal rate estimate at the end of 2026 (3.00-3.25%) unchanged from June.
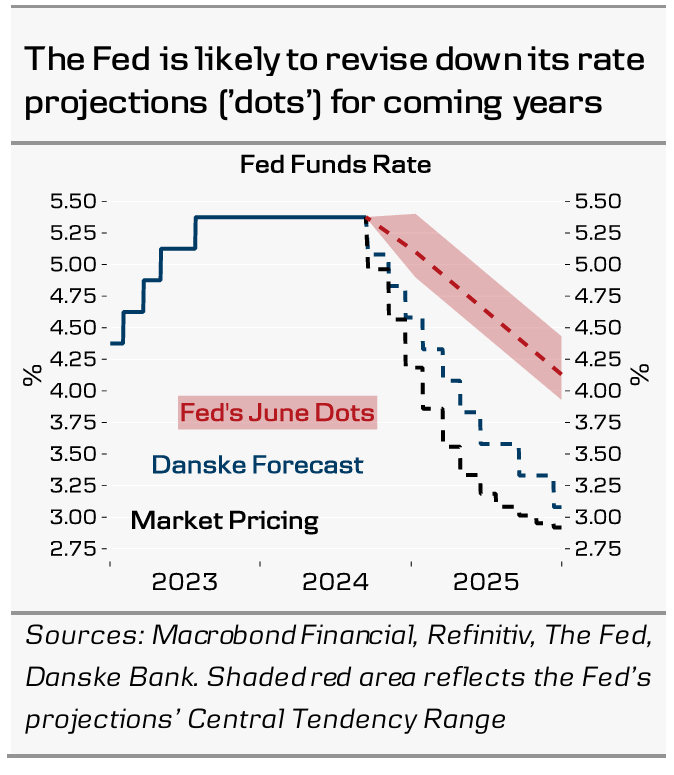
Risks are skewed towards modest downward revisions in 2025 GDP forecasts. We expect downward revisions to inflation forecasts for 2024-2025 and modest upward revisions on unemployment rate forecasts for 2024-2026. Note that we do not expect changes to the pace of QT despite the Fed now initiating its rate cutting cycle.
Markets: Modest downside potential in EUR/USD
Although the likelihood of a 50bp rate cut has gradually declined over the past week, it remains a possibility, especially after several news articles on Friday indicated a close call between the two options, which increased the market pricing for a jumbo cut to around 34bp (OIS pricing). If our call for a 25bp cut materializes, the USD could strengthen following the announcement. However, the potential for significant USD appreciation is likely limited, as a 25bp cut appears to be the base case for markets heading into the meeting. Hence, any potential USD rally will likely be contained, especially if Powell signals openness to larger cuts if necessary.
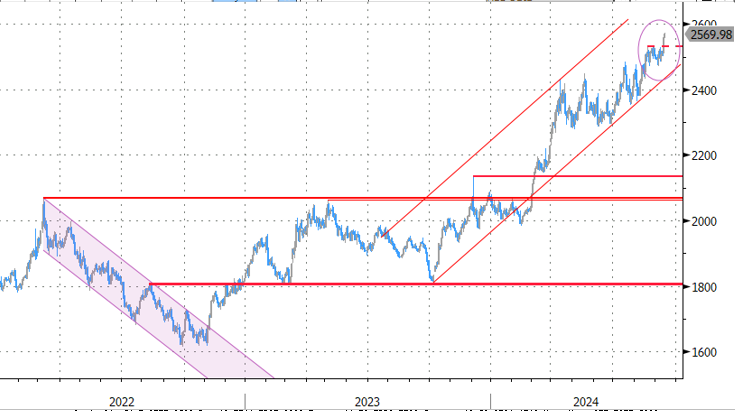
XAU/USD Outlook: Gold Extends Its Sharp Rally into Uncharted Territory and Approaches $2,600 Target
Gold continued to trend higher on Friday and hit new all-time highs, being the top performer in the market for the second consecutive day and on track for a weekly gain of around 3.3%.
Fresh acceleration higher was sparked by almost certain Fed rate cut next week, with renewed rise in expectations for more aggressive 50 basis points cut, adding to strong bullish sentiment.
Bullish technical studies contribute to favorable fundamentals, with psychological $2600 barrier coming in focus.
Meanwhile, the price may ease on profit taking as many traders prefer to close their positions at the end of the week, with overbought conditions on daily and weekly chart supporting the notion.
Dips should be shallow, as the price gained strong positive momentum and near-term sentiment is very bullish and should provide better levels to re-enter bullish market.
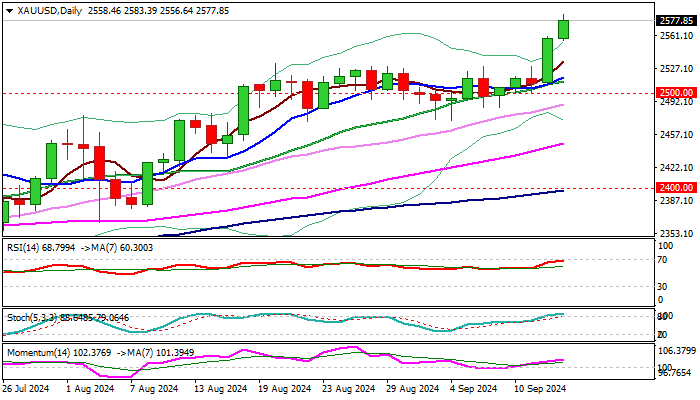
Session low ($2556) marks initial support, with former consolidation range ceiling ($2531) now acting as solid support, expected to contain corrective dips and guard lower pivots at $2500/$2480.
Weekly close above $2531 to confirm signal of continuation of larger uptrend.
Res: 2591; 2600; 2614; 2628.
Sup: 2556; 2531; 2528; 2517.
Gold Broke Through the Ceiling
After three weeks of consolidation, gold moved decisively upwards, hitting a record above $2572 per troy ounce on the spot market on Friday. The price rise has approached 3% since the beginning of the week and 25% since the beginning of the year, well ahead of the major stock market indices and against the general decline in base metals.
In terms of technical analysis, the latest spurt was an acceleration of growth after a prolonged consolidation with an upward bias since April. This pattern is called a rising bullish wedge, the upper boundary of which the price overcame yesterday. Although gold has been gaining steadily, the extended consolidation at the end of last month removed excessive local overbought conditions, clearing the way for a rally, some of which we saw this week.
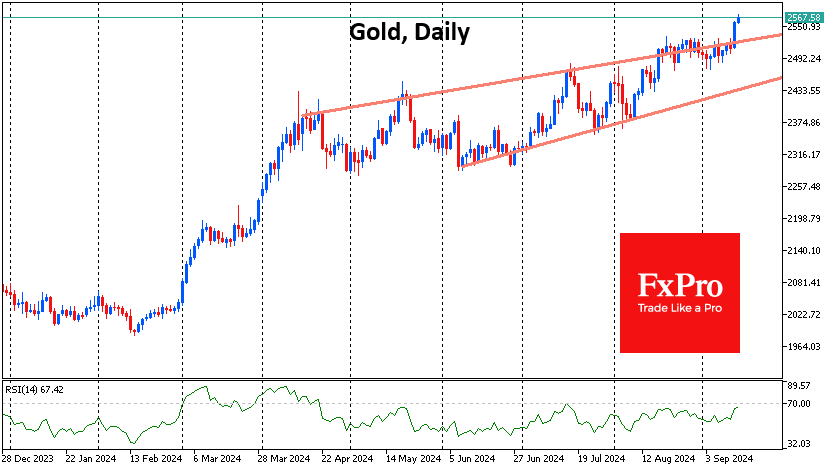
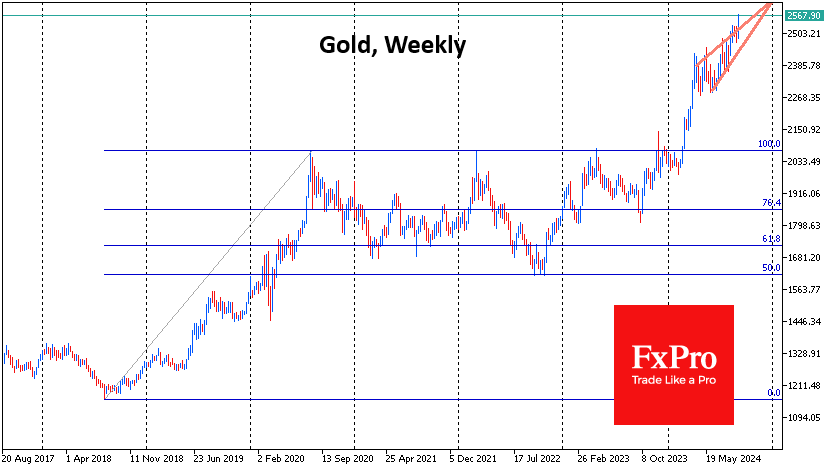
The realisation of this pattern indicates the possibility of a rise to the $2660 area, which is about $100 above current levels. A longer-term upside pattern to 161.8% of the initial two-year rise from August 2018, followed by a correction to 50% of that rise at the September 2022 lows, leads us to $2640.
Due to the triggering of abundant stop-outs, a quick rise into this area is possible, and this process could develop in an active US session on Friday or at the start of trading on Monday. However, the sharp growth may well be a suitable reason for the arrival of real sellers capable of turning the price.
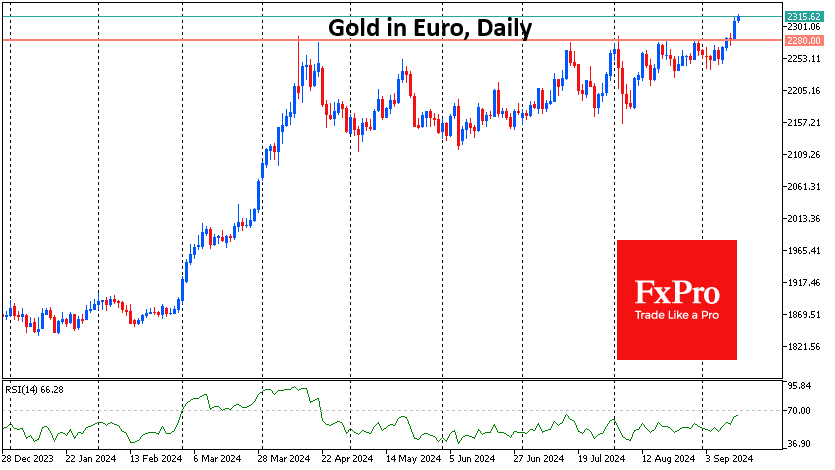
Separately, it is worth mentioning the dynamics of gold against the euro. From April to the end of August, the price bounced from the horizontal resistance on the approach to 2300 euros per ounce but overcame it with a sharp movement on Thursday. The prolonged consolidation after the rally of March and April suggests that we are only seeing the beginning of a rally.
The decline in bond interest rates is returning some of the appeal of gold to retail investors. From this perspective, it is worth being prepared that the expected Fed rate cut next week could reverse the trend. In 2015, we saw a similar situation, but in the other direction. Back then, gold fell for many months in anticipation of the first Fed rate hike, and the bottom was reached on the day of the hike. It is possible that this time, too, the fact may trigger a long profit taking, especially if it turns out that the Fed is not ready to soften policy so actively in the coming months, as investors expect.
Sunset Market Commentary
Markets
After Wednesday’s slightly higher than expected August (core) CPI , for a brief while it seemed that the debate on the magnitude of the inaugural Fed rate cut had been concluded in favour of a 25 bps step. However, it isn’t. Money markets again seen an almost even chance between a 25 and 50 bps step. Market talk at this stage isn’t about data anymore. Next week’s US retail sales or other second tier data probably also won’t be gamechangers anymore. The debate now is a about appropriate central bank tactics. It is fueled by high profile columns in the Financial Times (Fed Wrestles with how aggressively to cut interest rates) and the Wall Street Journal (The Fed rate cut dilemma: Start big or Small?). The articles bring an in extenso list of tactical arguments pro and contra a 50 bps start. We retain just a few. Pro 25 bps. A cautious start allows the Fed to assess the impact. It might adjust as necessary further out in the economic cycle. A 50 bps step also risks markets wondering whether the Fed has become worried that the hoped for soft landing is at risk, causing markets to position for an outright recession/risk-off scenario. Pro 50 bps. Policy is currently highly restrictive. If the Fed wants to avoid the risk of a further deterioration of the labour market as Powell highlighted at Jackson Hole, it makes sense to swiftly bring the policy rate closer to neutral. The Fed then avoids the risk of being accused of having been behind the curve if the economy unexpectedly cools more than expected. If the soft landing materializes, it can then slow its easing or take a pause somewhere next year. The new dots plot also might support the logic of a 50 bps step. Why start with 25 bps if a majority of governors expects 100 bps + easing to be warranted still this year. We don’t have any reason to assume that this new press debate during the black-out period is ‘originated’ from inside the Fed. Even so, most of the authorities ‘closely linked to the Fed’ in the articles (former NY Fed president Dudley, ex Powell adviser Jon Faust) are tilting toward a 50 bps step. As said, it’s about tactics and psychology rather than analyzing data. In this respect, we add another argument. Can the Fed on Wednesday take the risk of not doing 50 bps when markets by that time are positioned for a big step? Admittedly, this smells like a circle reasoning, but that’s often how markets work. In this exercise of tactics we think the Fed takes the least risk with a 50 bps step, paving the way for 150 bps cumulative easing still this year. Whatever the driver, US yields today again decline 7 bps (2-y) to 1 bp (30-y). German Bunds still underperform as the ECB didn’t commit to any rate path (2-y -2.5 bps; 30-y -0.5 bp). The dollar also prepares for an aggressive Fed-start with EUR/USD testing the 1.11 area. DXY dropped back to the 101 reference. USD/JPY (140.7) is about to test key 140.25 support (Dec 2023 low).
News & Views
In the Bank of England’s quarterly survey, UK households for the first time since November 2008 on balance expect interest rates to decline in the next 12 months. 38% of the respondents anticipated such a scenario vs 29% expecting higher rates still. The survey was conducted between August 2 and 6, after the BoE’s first rate cut to 5%. Inflation at that time hit the 2% mark on a headline basis. Households experience a much higher 5.2%, although that’s further down from 5.5% in the May survey. Their inflation expectations for the year ahead eased further from 2.8% to 2.7%, a three-year low and a significant improvement from the series high of 4.9% seen in August 2022. Inflation in two years’ time is seen at 2.6%, unchanged from previously, with the 5-yr gauge rising slightly to 3.2%. UK families also for the first time since February 2022 were satisfied in the way the central bank was controlling inflation. The net balance shifted from -4% to +4%, compared to a post-pandemic low of -21% in August 2023.
Polish rate setter Wnorowski said it’s likely that the central bank will cut rates in the second quarter of 2025. That’s a slight dovish change of tac compared to end July, when the council member only noted that discussions about the topic could begin. His comments dovetail with those made by NBP governor Glapinski last week. Wnorowski ruled out any cuts before the March inflation projections but said there may be “additional arguments coming from the biggest central banks” for a first reduction a bit later. If the scale of ECB and Fed easing becomes significant, it would accelerate their own decisions, he added. Wnorowski didn’t rule out that rates coming down 100 bps in total over 2025 from a current rate of 5.75%. Arguing against easing, he cited the government’s loose budget plan, which envisages another deficit of more than 5%.
Graphs
US 2-y yield: ST US yields holding near cycle lows as debate on 50 bps Fed inaugural rate cut continues
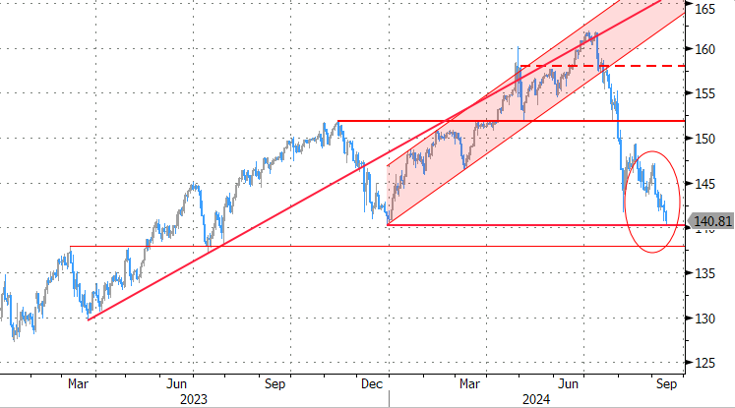
USD/JPY: testing end 2023 low as markets continue betting on further FED-BoJ policy divergence
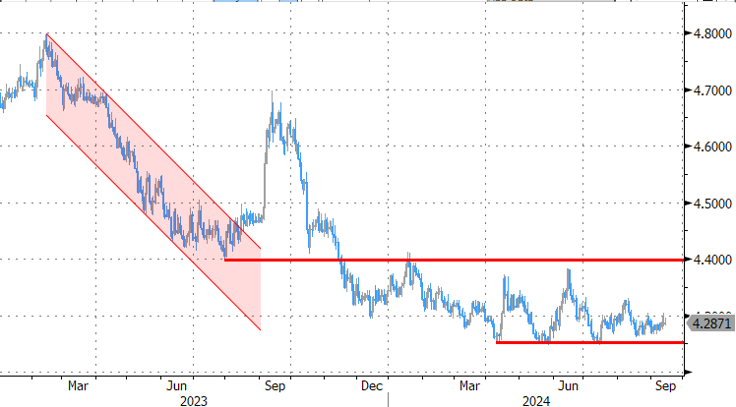
EUR/PLN: zloty holding strong even as NBP starts debate on timing of first rate cut (admittedly still well in 2025).
Gold at all time high driven by lower yields, a weak dollar and investors hedging against glabal political and economic uncertainty
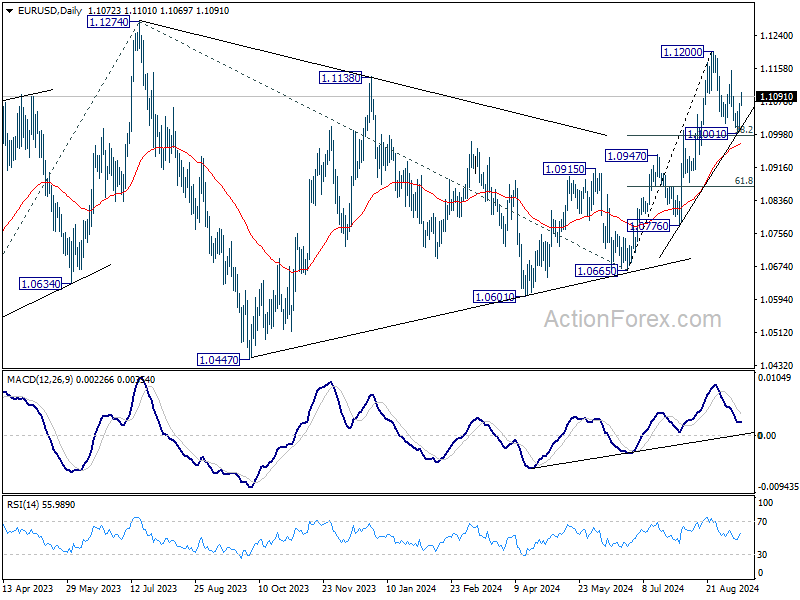
EUR/USD Mid-Day Outlook
Daily Pivots: (S1) 1.1028; (P) 1.1052; (R1) 1.1099; More....
Intraday bias in EUR/USD stays neutral at this point. Outlook stays bullish with 38.2% retracement of 1.0665 to 1.1200 at 1.0996 intact. Break of 1.1153 will suggest that larger rally is resuming through 1.1200 to 1.1274 key resistance. Nevertheless, sustained break of 1.0996 will indicate reversal and turn bias to the downside for 1.0947 resistance turned support next.
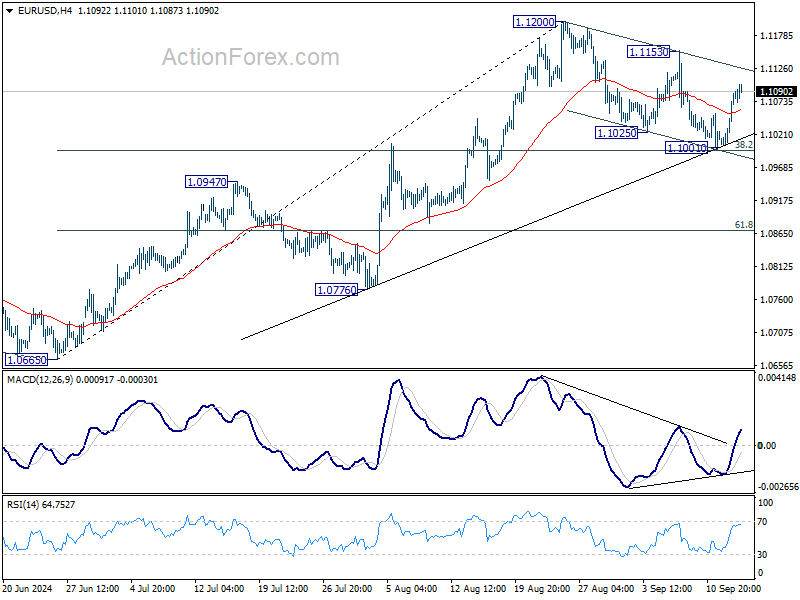
In the bigger picture, prior break of 1.1138 resistance indicates that corrective pattern from 1.1274 might have completed at 1.0665 already. Decisive break of 1.1274 (2023 high) will confirm whole up trend from 0.9534 (2022 low). Next target will be 61.8% projection of 0.9534 to 1.1274 from 1.0665 at 1.1740. This will now be the favored case as long as 1.0947 resistance turned support holds.
GBP/USD Mid-Day Outlook
Daily Pivots: (S1) 1.3063; (P) 1.3095; (R1) 1.3159; More...
Intraday bias in GBP/USD remains neutral for the moment. On the upside, firm break of 1.3265 resistance will resume larger rally to 1.3364 projection next. Nevertheless, break of 1.3000 will extend the correction from 1.3265 to 55 D EMA (now at 1.2962) and possibly below.
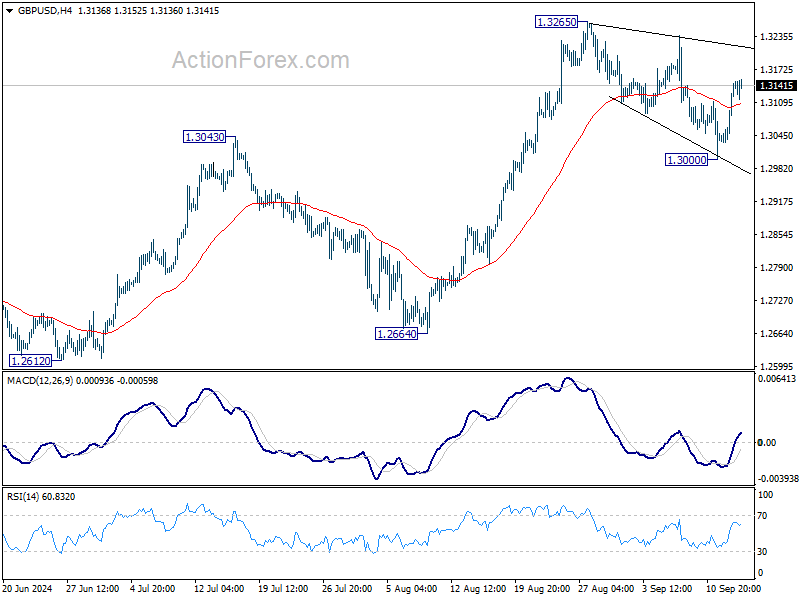
In the bigger picture, up trend from 1.0351 (2022 low) is in progress. Next target is 38.2% projection of 1.0351 to 1.3141 from 1.2298 at 1.3364. For now, outlook will stay bullish as long as 1.2664 support holds, even in case of deep pullback.
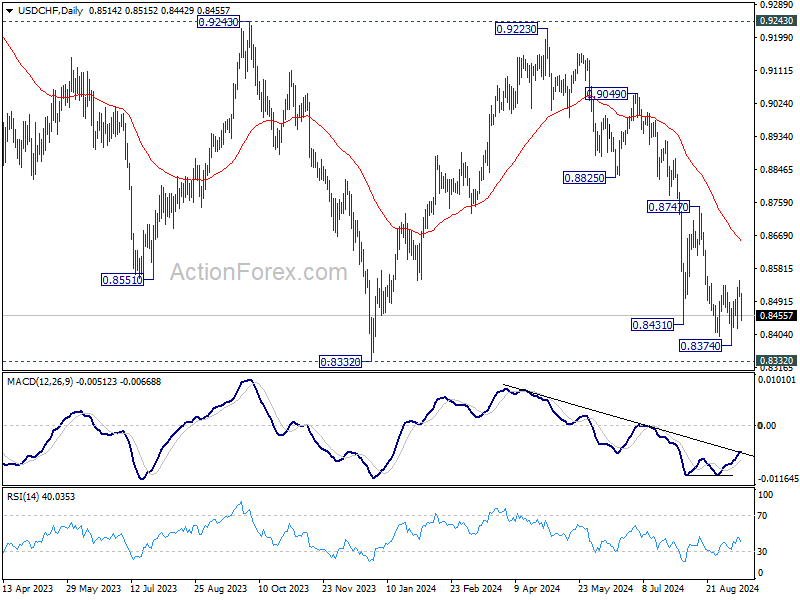
USD/CHF Mid-Day Outlook
Daily Pivots: (S1) 0.8495; (P) 0.8523; (R1) 0.8539; More…
Intraday bias in USD/CHF remains neutral for the moment. As long as 0.8548 resistance holds, further decline is expected. On the downside, firm break of 0.8374 will resume the fall from 0.9223 to retest 0.8332 low. Decisive break there will indicate larger down trend resumption. However, considering bullish convergence condition in 4H MACD, break of 0.8548 resistance will now confirm short term bottoming, and turn bias back to the upside for 0.8747 resistance.
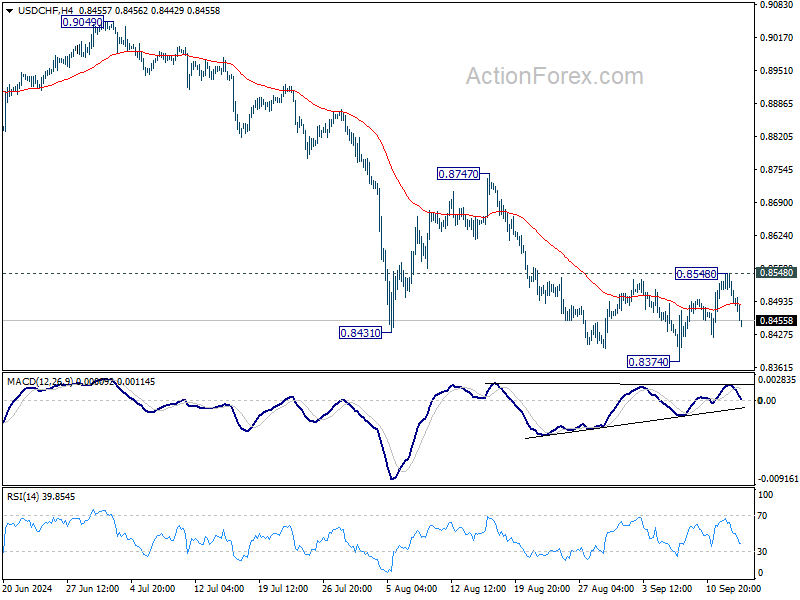
In the bigger picture, price actions from 0.8332 (2023 low) are currently seen as a medium term corrective pattern, with fall from 0.9223 as the second leg. Strong support could be seen from 0.8332 to bring rebound. Yet, overall outlook will continue to stay bearish as long as 0.9243 resistance holds. Firm break of 0.8332, however, will resume larger down trend from 1.0146 (2022 high).
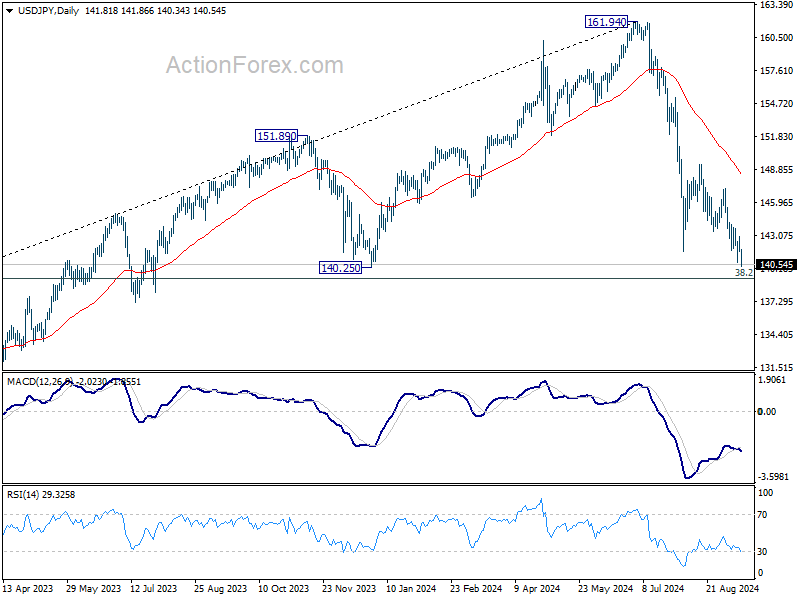
USD/JPY Mid-Day Outlook
Daily Pivots: (S1) 141.35; (P) 142.20; (R1) 142.66; More...
USD/JPY's decline resumed by breaking through 140.70 and intraday bias is back on the downside. Further fall should be seen to 139.26 fibonacci level. Decisive break there would carry larger bearish implications. On the upside, above 143.03 minor resistance will turn intraday bias neutral again first. But outlook will stay bearish as long as 147.20 resistance holds.
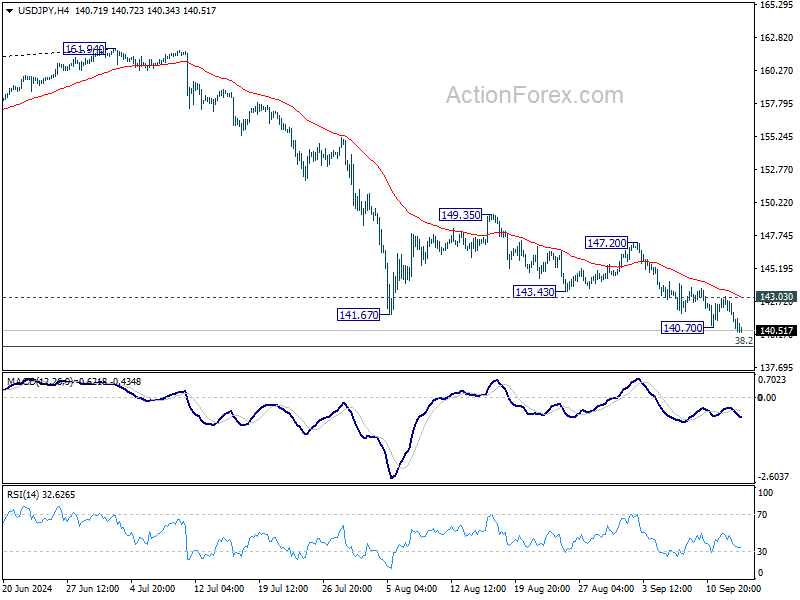
In the bigger picture, fall from 161.94 medium term top is seen as correcting whole up trend from 102.58 (2021 low). Deeper decline could be seen to 38.2% retracement of 102.58 to 161.94 at 139.26, which is close to 140.25 support. Strong support could be seen there to bring rebound. But in any case, risk will stay on the downside as long as 55 W EMA (now at 148.93) holds. Sustained break of 139.26 would open up deeper medium term decline to 61.8% retracement at 125.25.
Yen Leads Weekly Gains While France Stages Come Back
Yen continues to strengthen broadly today, maintaining its position as the best-performing currency of the week so far. Renewed speculation around a possible 50bps rate cut by the Fed has provided an extra lift to the Japanese currency. Additionally, renewed weakness in US and European benchmark yields further supports the Yen's rally.
BoJ is widely expected to keep interest rates unchanged at its upcoming meeting, though the long-term path suggests rates could eventually target a neutral level of 1%. However, the BoJ's slow pace of tightening means that Yen's movement is likely to remain driven by the pace of policy easing in other major economies.
Swiss Franc is also showing strength today, although it remains the weakest currency for the week. The recent rebounds in EUR/CHF and GBP/CHF seem to be losing momentum, signaling potential completion of these recoveries. However, a stronger risk-off sentiment would be needed for Franc to resume its recent rally.
Elsewhere, Australian Dollar follows Yen as the second strongest currency of the week, with US Dollar edging out Euro for third place. Canadian Dollar and New Zealand Dollar are competing for the second-worst position, just ahead of Swiss Franc. Sterling is positioned in the middle of the performance chart for now.
In Europe, at the time of writing, FTSE is up 0.19%. DAX is up 0.59%. CAC is up 0.24%. UK 10-year yield is down -0.0072 at 3.776. Germany 10-year yield is down -0.008 at 2.148. Earlier in Asia, Nikkei fell -0.68%. Hong Kong HSI rose 0.75%. China Shanghai SSE fell -0.48%. Singapore Strait Times rose 0.17%. Japan 10-year JGB yield fell -0.020 to 0.846.
Eurozone industrial production falls -0.3% mom in Jul, weighed down by capital and durable consumer goods
Eurozone industrial production fell by -0.3% mom in July, missing expectations of 0.2% mom rise. The decline was driven by significant drops in production across key sectors: intermediate goods fell by -1.3%, capital goods by -1.6%, and durable consumer goods by -2.8%. On the positive side, energy production saw a slight increase of 0.3%, while non-durable consumer goods rose by 1.8%.
In the broader EU, industrial production slipped by -0.1% momh. Notably, Malta (-5.5%), Estonia (-4.8%), and Romania (-3.4%) reported the largest production declines. Conversely, Ireland led gains with a robust +9.2% increase, followed by Croatia at +8.0% and Belgium at +7.3%.
ECB officials stress data-driven approach as inflation and growth weigh on policy
ECB officials shared varied perspectives on the economic outlook and monetary policy today, following yesterday's 25bps rate cut. This move was largely anticipated as ECB continues its cautious approach to address both inflation and slowing growth.
ECB Deputy Governor Olli Rehn highlighted the "good reasons" behind the rate cut, amid declining inflation. He also stressed that "current uncertainties further emphasize the dependence on fresh data and analysis" to guide policy decisions.
Bundesbank President Joachim Nagel, another member of the Governing Council, struck a positive tone, stating, "We assume that core inflation will improve, especially with the declining wage trend in the eurozone." He added that in Germany, "things are moving in the right direction."
Meanwhile, Bank of France President François Villeroy de Galhau acknowledged the challenges posed by weaker-than-expected activity data, particularly in France. However, he maintained a cautious outlook, noting the potential for "a very gradual recovery" beyond the short-term boost from the Olympics. He emphasized that the pace of monetary easing "has to be highly pragmatic" and that ECB "keeps full optionality" for future meetings.
Bank of Slovenia President Bostjan Vasle reiterated ECB's data-dependent approach, adding that "we are not committed to any predetermined rate path," with inflation still largely driven by core components and services.
Bank of Estonia Governor Madis Muller, echoing these views, expressed concerns over services inflation but noted growing confidence in the broader inflation outlook, despite expectations of a temporary acceleration.
NZ BNZ manufacturing rises to 45.8, 18th month of contraction
BNZ Performance of Manufacturing Index for New Zealand edged higher in August, rising from 44.4 to 45.8. Despite the improvement, the sector remains in deep contraction, well below its long-term average of 52.6, marking the 18th consecutive month of declining activity.
A closer look at the data reveals that production increased from 44.2 to 46.3, while employment also saw a slight rise, moving from 43.5 to 46.6. New orders climbed from 43.3 to 46.8, signaling some improvement in demand. However, finished stocks dipped slightly from 46.3 to 46.2, while deliveries improved marginally from 44.7 to 45.6.
BusinessNZ's Director of Advocacy, Catherine Beard, commented on the situation, noting that while the PMI is "heading back in the right direction," the sector's return to expansion is still distant after 18 months in contraction.
The ongoing challenges in the manufacturing sector were reflected in the proportion of negative comments, which, although improved, remained high at 64.2% in August, down from 71.1% in July and 76.3% in June. These negative sentiments were largely driven by concerns over the broader economic recession, with manufacturers citing weak demand and rising living costs as significant hurdles to recovery.
USD/JPY Mid-Day Outlook
Daily Pivots: (S1) 141.35; (P) 142.20; (R1) 142.66; More...
USD/JPY's decline resumed by breaking through 140.70 and intraday bias is back on the downside. Further fall should be seen to 139.26 fibonacci level. Decisive break there would carry larger bearish implications. On the upside, above 143.03 minor resistance will turn intraday bias neutral again first. But outlook will stay bearish as long as 147.20 resistance holds.
In the bigger picture, fall from 161.94 medium term top is seen as correcting whole up trend from 102.58 (2021 low). Deeper decline could be seen to 38.2% retracement of 102.58 to 161.94 at 139.26, which is close to 140.25 support. Strong support could be seen there to bring rebound. But in any case, risk will stay on the downside as long as 55 W EMA (now at 148.93) holds. Sustained break of 139.26 would open up deeper medium term decline to 61.8% retracement at 125.25.
Economic Indicators Update
| GMT | CCY | EVENTS | ACT | F/C | PP | REV |
|---|---|---|---|---|---|---|
| 22:30 | NZD | Business NZ PMI Aug | 45.8 | 44 | ||
| 04:30 | JPY | Industrial Production M/M Jul F | 3.10% | 2.80% | 2.80% | |
| 09:00 | EUR | Eurozone Industrial Production M/M Jul | -0.30% | 0.20% | -0.10% | 0.00% |
| 12:30 | CAD | Capacity Utilization Q2 | 79.10% | 78.40% | 78.50% | 78.60% |
| 12:30 | CAD | Wholesale Sales M/M Jul | 0.40% | -1.10% | -0.60% | -0.50% |
| 12:30 | USD | Import Price Index M/M Aug | -0.30% | -0.20% | 0.10% | |
| 14:00 | USD | Michigan Consumer Sentiment Index Sep P | 68 | 67.9 |
Gold Sets a New Record as Prices Rise Higher
Gold prices surged to 2,570 USD per troy ounce on Friday. New record highs became possible amid the weakening position of the US dollar and declining yields on US government bonds.
Gold prices began to rise after the release of another package of US macroeconomic statistics. The weekly initial jobless claims increased compared to the previous week and remained above average values. This signals a weakening employment market, which is confirmed by weak wage figures for August. Meanwhile, US producer prices increased slightly more than expected in August due to high maintenance costs. The overall trend still confirms easing inflationary pressures, which will allow the Federal Reserve to lower interest rates next week.
According to the CME FedWatch tool, the odds of a 25-basis-point interest rate cut is 59% now, while the likelihood of a 50-basis-point rate cut is estimated at 41%. Yesterday, the ECB lowered its interest rate by 60 basis points to 3.65% per annum, which is a good signal for gold prices.
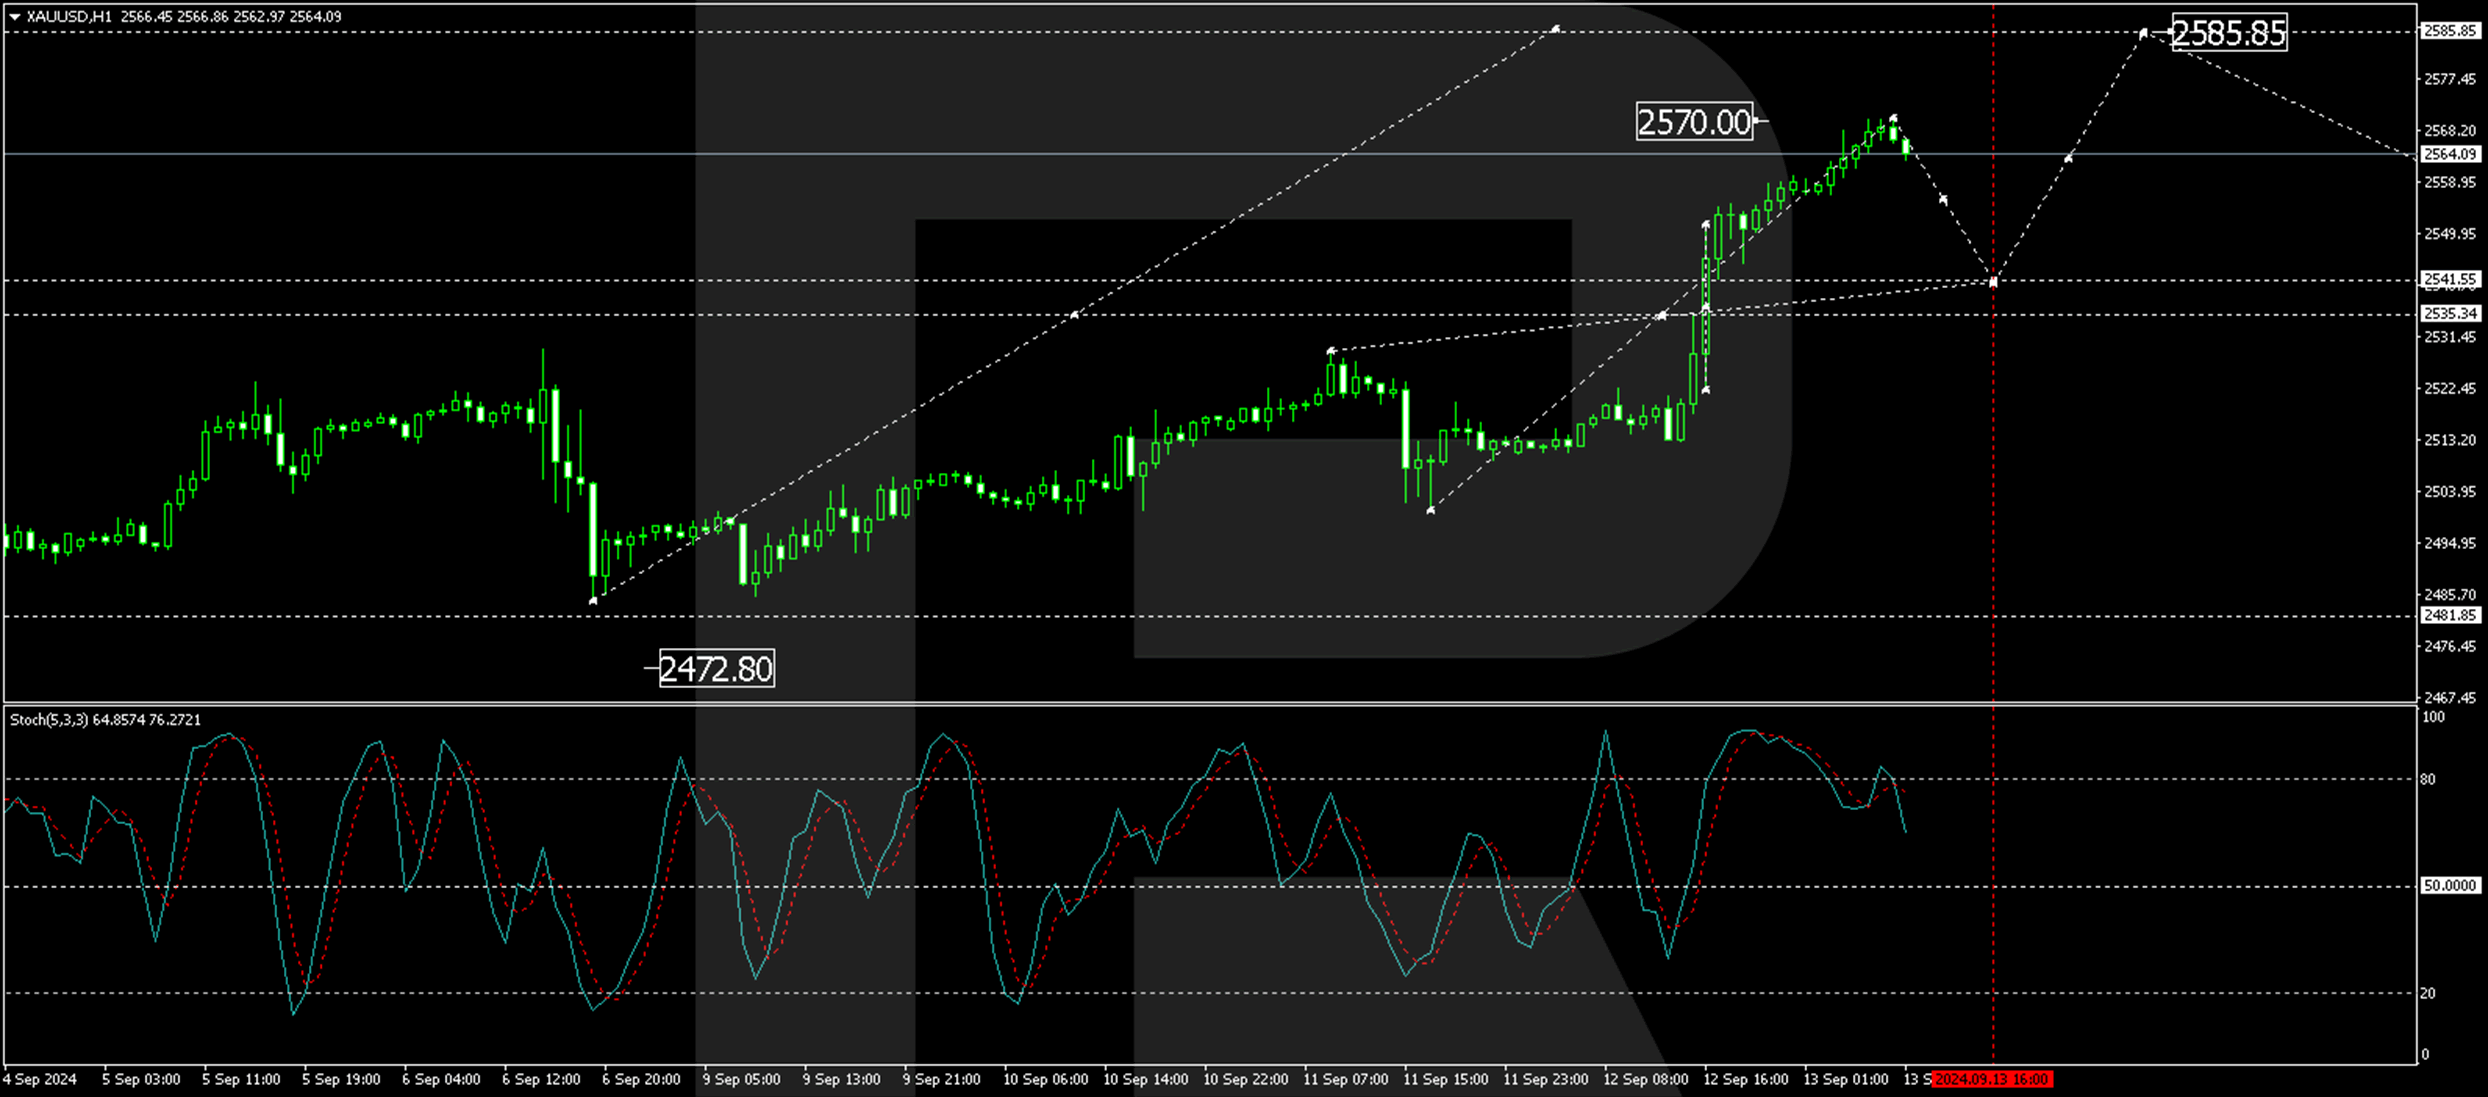
XAU/USD technical analysis
On the XAU/USD H4 chart, the market has broken above the consolidation range. A breakout of the 2,535.35 level can be considered as a market proposal to extend the growth wave to 2,570.00 and potentially further to 2,585.85. Today, the market has completed a wave, reaching 2,570.00. Subsequently, a technical decline to at least 2,541.55 (testing from above) could follow. Once the price hits this level, a growth structure might develop, aiming for the local target of 2,585.85. It is worth noting that breaking through the 2,535.35 level may result in a continuous growth structure to the 2,595.95 level, without a significant correction. This is the main target. This scenario is technically supported by the MACD indicator, whose signal line is above zero and pointing strictly upwards.
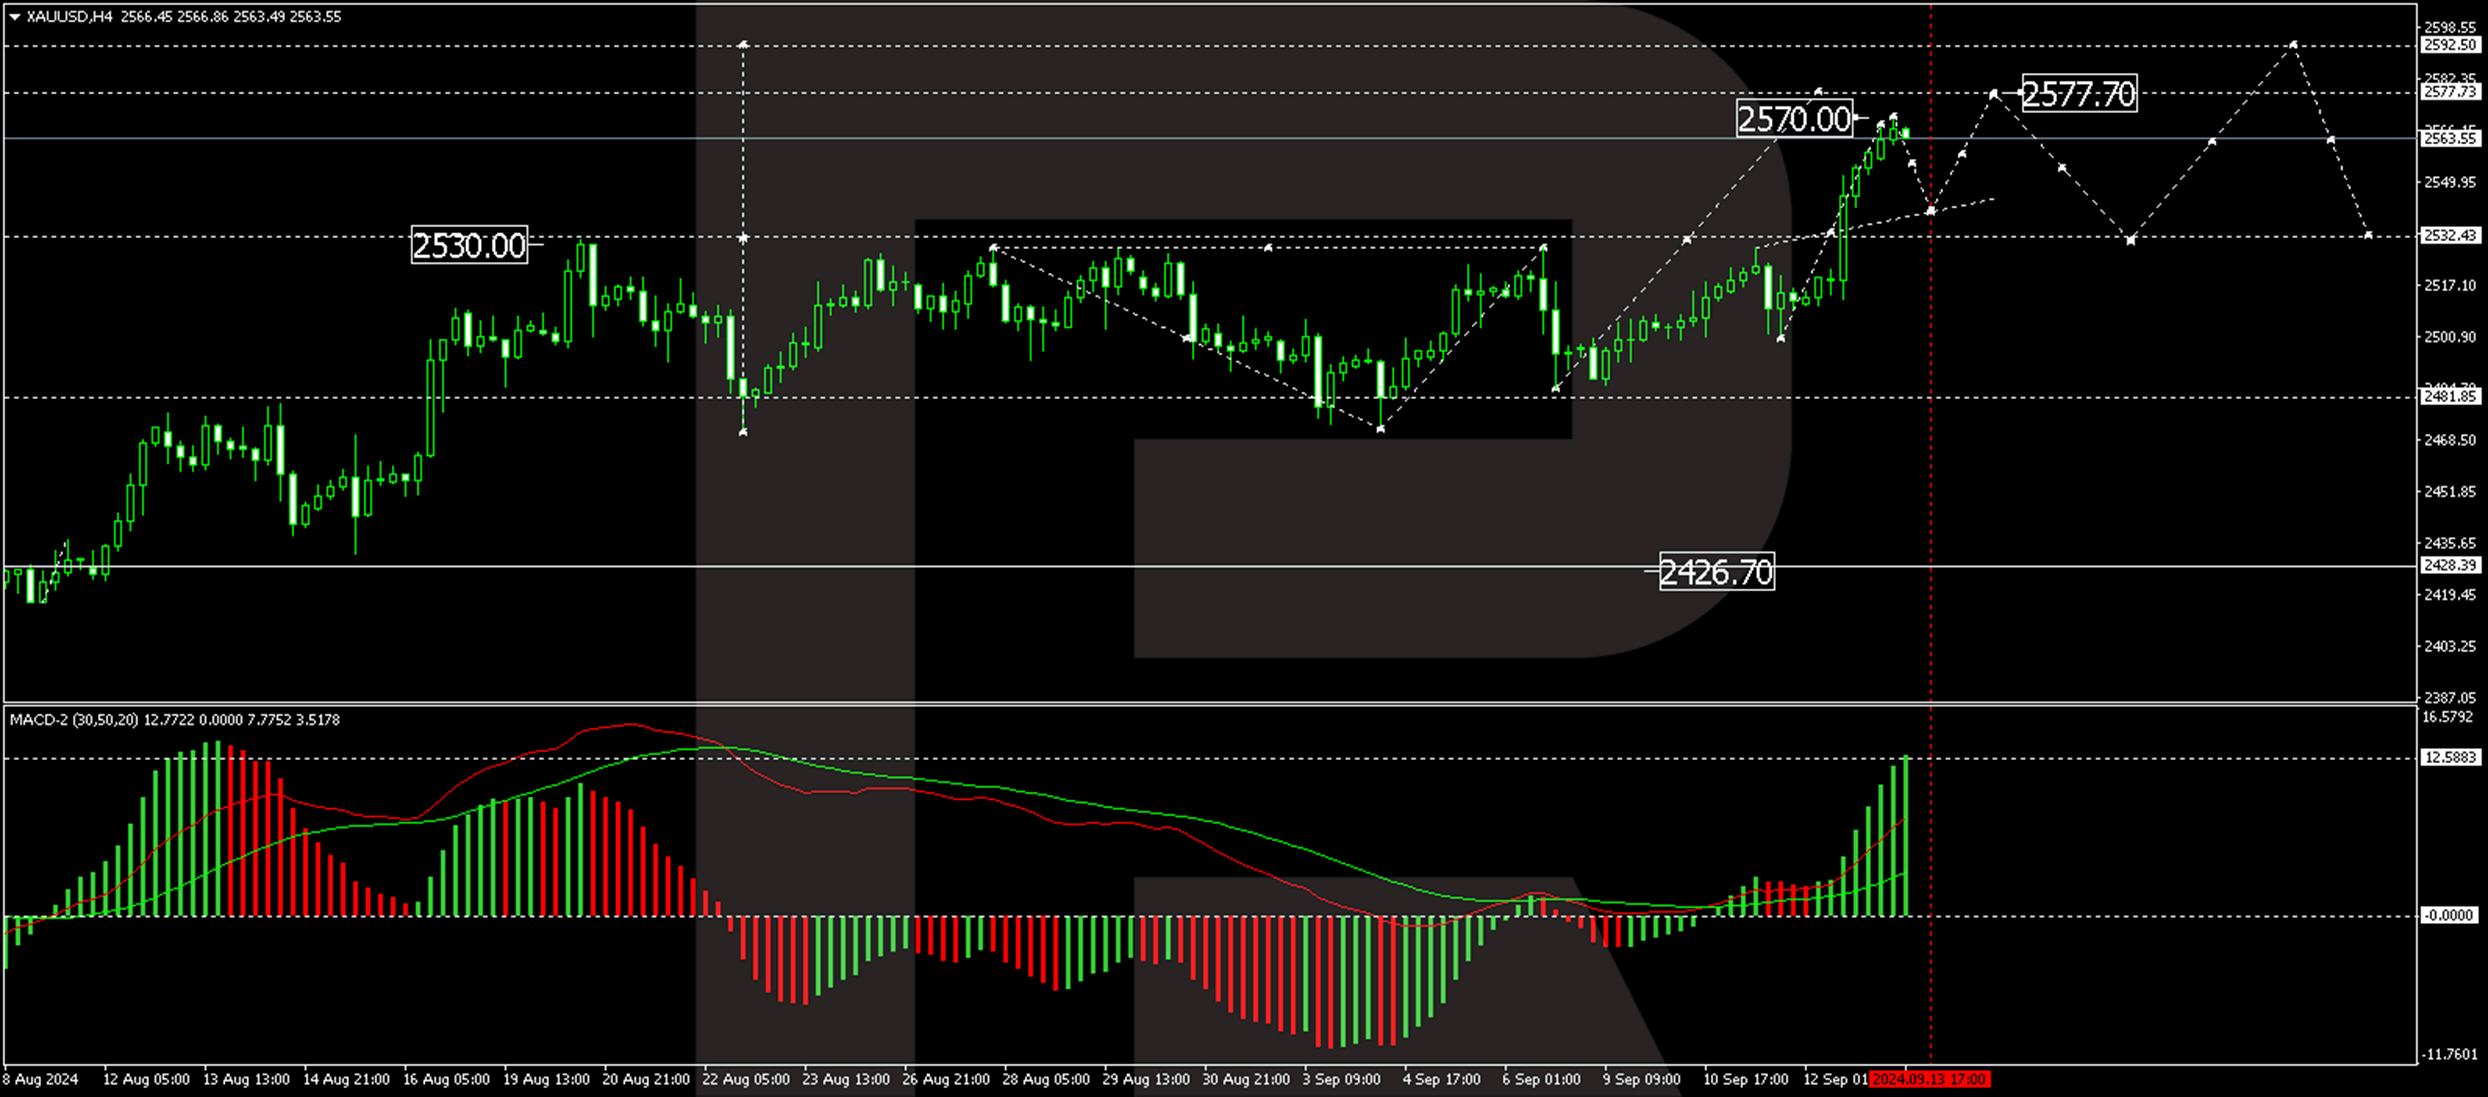
On the XAU/USD H1 chart, the market has completed a growth wave, reaching 2,570.00. A consolidation range is currently forming below this level. With a downward breakout, the price could decline to 2,541.55. An upward breakout will open the potential for a continuation of the trend to 2,585.85. This scenario is also technically supported by the Stochastic oscillator, whose signal line is around 80 and poised for a decline to 20.