Sample Category Title
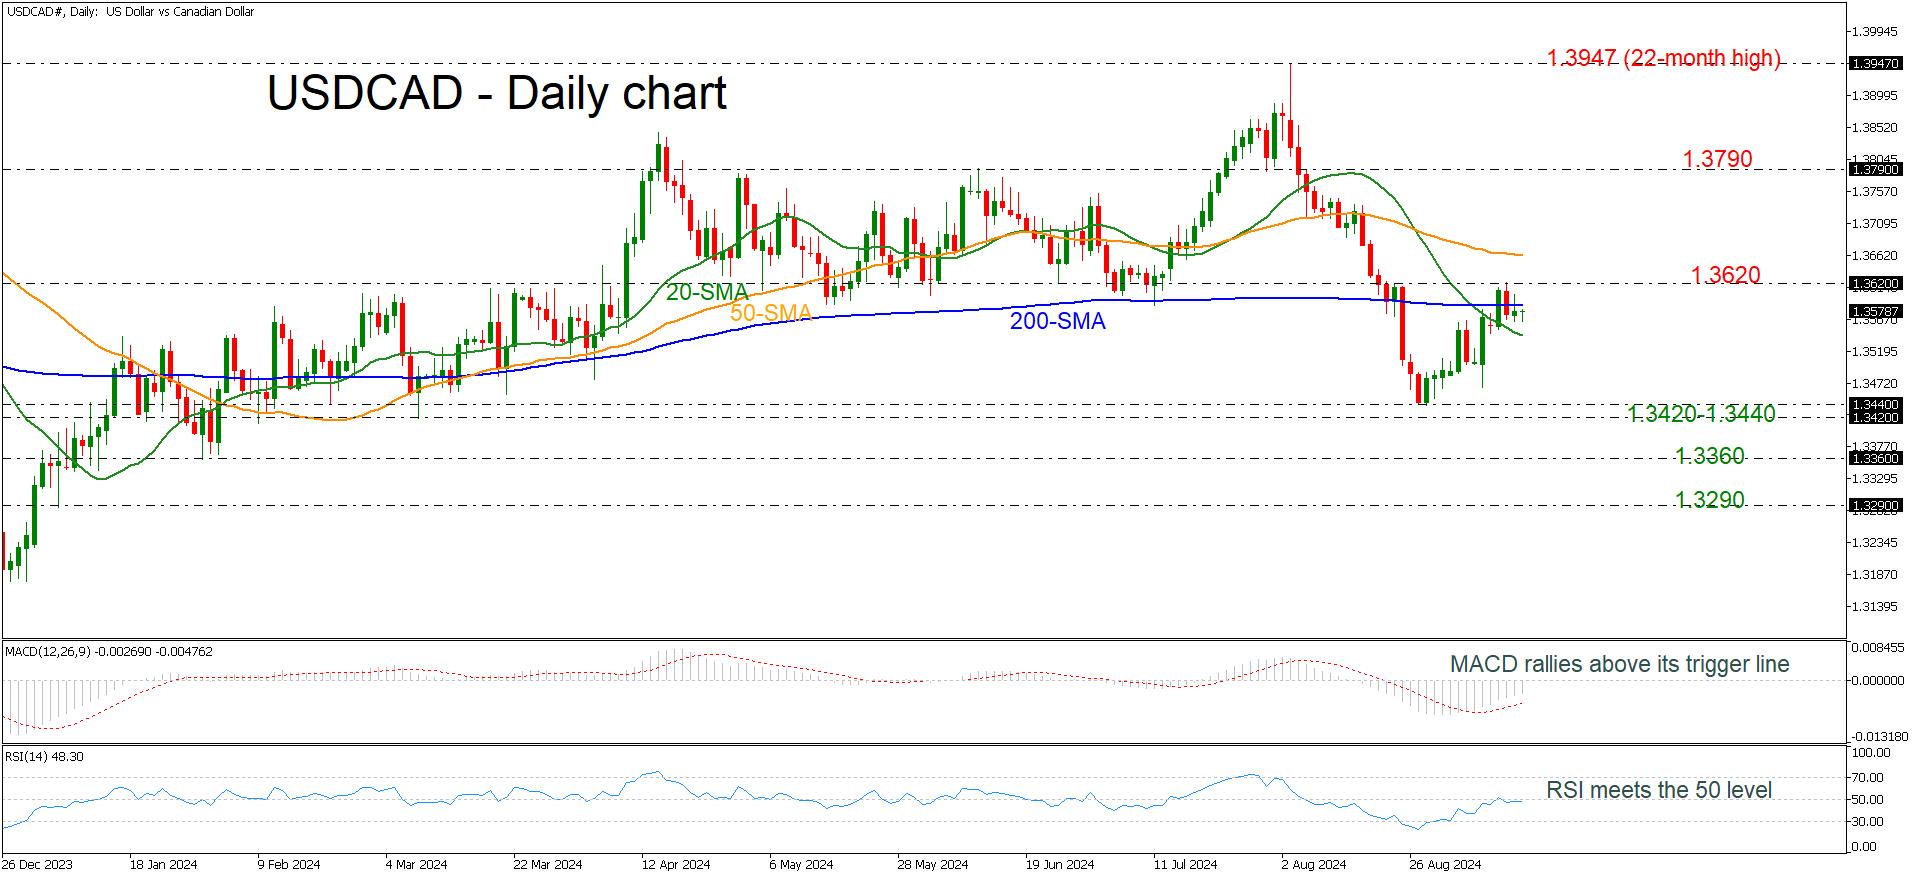
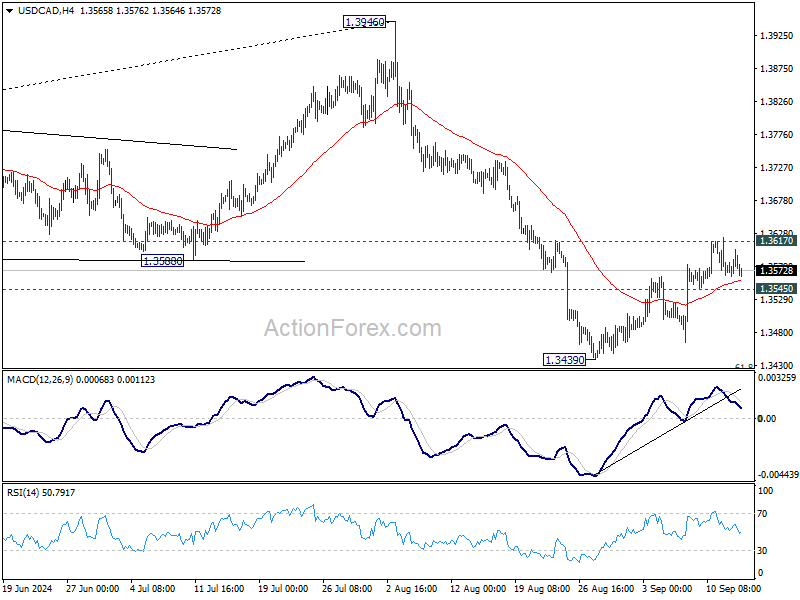
USDCAD Flirts With 200-Day SMA Again
- USDCAD remains below 1.3600
- MACD and RSI indicate upside recovery
USDCAD is moving back and forth of the 200-day simple moving average, which is standing marginally beneath the 1.3600 round number. Earlier in the week, the market successfully travelled towards the 1.3620 bar, adding optimism for more bullish actions.
The technical oscillators are confirming an upside recovery after prices bounced off the 1.3440 support level. The MACD is holding above its trigger line in the negative region, while the RSI is trying to cross above the neutral threshold of 50.
If the pair maintains the buying interest, it may re-challenge the 1.3620 resistance level before touching the 50-day simple moving average (SMA) at 1.3660. Traders may also hit the 1.3790 resistance, taken from the inside swing low on July 31.
On the other hand, a dive beneath the 20-day SMA, which is currently near 1.3545, could send the bears towards the 1.3420-1.3440 support region. More downside pressure could endorse the bearish tendency, flirting with 1.3360.
All in all, USDCAD has been in a negative trend in the short term since the beginning of August, particularly after it printed a new low at 1.3420.
US Treasuries Rally Overnight With Front End of the Curve Outperforming.
Markets
The ECB cut its deposit rate by 25 bps to 3.5% while narrowing the gap between the deposit rate and the main refinancing rate from 50 bps to 15 bps as flagged in March. New growth and inflation forecasts barely changed from June. The ECB plots the same 2.5%-2.2%-1.9% average inflation path for the 2024-2026 period while marginally downwardly revising the now 0.8%-1.3%-1.5% growth trajectory for the same period. ECB Lagarde offered no guidance for the remaining two policy meetings, but a simple copy-paste from Q3 suggests skipping the October meeting to reduce key rates by 25 bps again when new growth/inflation forecasts are available. The short, 5-week, intermeeting period to October 17 provides the ECB with only one additional PMI survey and CPI report. The ECB president also acknowledged that inflation dynamics would accelerate going into year-end because of energy-related base effects (huge drops in energy prices in Q4 2023). EMU money markets currently attach a 50 bps probability to an October rate cut which we don’t expect to unfold. German Bunds underperformed US Treasuries yesterday as the ECB stuck to its very gradual approach. German yields rose by 3 bps (30-yr) to 7.3 bps (2-yr) while US yield changes ranged between -0.1 bp (2-yr) and +2.3 bps (30-yr). Relative short term interest rate dynamics lifted EUR/USD away from the psychologic 1.10 barrier to a close at 1.1075.
US Treasuries rally overnight with the front end of the curve outperforming. Placed (?) articles on the FT (“Fed wrestles with how aggressively to cut interest rates”) and the WSJ (“The Fed’s rate-cut dilemma: start big or small?”) reignite the debate which seemed to have been settled in favour of a 25 bps rate cut after this week’s upward core CPI surprise. US money markets are again completely split between 25 bps and 50 bps with US yields slipping 2.5 bps (30-yr) to 6.1 bps (2-yr) this morning. While the content of the articles shows arguments for both cases, it’s the timing that matters (in blackout period with markets positioned at 25 bps). We still favour a 50-50-50 scenario for the September-November-December meetings. USD loses more ground this morning with the trade-weighted dollar at risk of slipping below 101 and testing important support around 100.50.
News & Views
The UK’s Office for Budget Responsibility (OBR) yesterday issued its annually updated Fiscal Risks and Sustainability Report. It painted a dire long-term future for the country’s public finances, warning that debt will nearly triple from below 100% (relative to GDP) this year to over 270% in 50 years in a situation of no policy changes. The OBR said that higher spending on healthcare, pensions, the climate transition and interest costs combined with falling revenue from fuel duties will drive borrowing substantially higher. In the first decades of the 50 year forecasts, its especially the ageing population that drives up spending, with spiraling costs causing a snowball effect on debt interest. The fiscal watchdog estimates that this would result in a 19 ppt increase in the budget deficit between 2028-29 and 2073-74, with some 8.5 ppts of that rise attributed to higher interest costs. Health and pensioner spending add another 9.9 ppts. The gloomy report also dived into the matter of productivity growth. The OBR admitted in November last year that it has consistently been overoptimistic on potential productivity, producing economic and fiscal forecast errors. The baseline scenario assumes 1.5% productivity growth in the long term. But in an alternative scenario debt to GDP could rise to +/- 650% if productivity would only rise by 0.5%, slightly below the post-GFC 2010-2019 average.
The Indian central bank governor Shaktikanta Das signaled he’s in no rush to lower interest rates even as inflation has re-entered the 2-6% target range since September of last year. Das this morning said while that is the case, their target is 4%. Inflation over the past two months have dipped below that figure. August CPI released yesterday came in at 3.65% but that was largely due to statistical reasons. Das said that the central bank should not get carried away by these dips in inflation and warned against premature cuts given worries over food costs, even as last quarter’s growth dip to 6.7% raised the pressure somewhat. The RBI has been keeping rates steady for more than 18 months straight now. The weak Indian rupee is another reason to be cautious with the easing cycle. While strengthening a tad against the USD (USD/INR 83.93) this morning, the currency still trades just inches away from the record lows.
Graphs
GE 10y yield
The ECB cut policy rates by 25 bps in June and in September. Stubborn inflation (core, services) make follow-up moves less evident. We expect the central bank to stick with the quarterly reduction pace. Disappointing US and unconvincing EMU activity data dragged the long end of the curve down. The move accelerated during the early August market meltdown.
US 10y yield
The Fed in its July meeting paved the way for a first cut in September. It turned attentive to risks to the both sides of its dual mandate as the economy is moving to a better in to balance. The pivot weakened the technical picture in US yields. A string of weak eco data and a risk-off market climate pushed and kept the 10-yr sub 4%. We think we could be up to three 50 bps rate cuts this year.
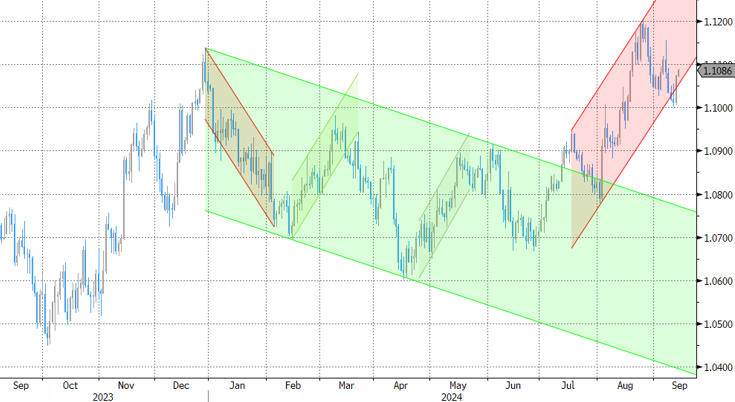
EUR/USD
EUR/USD moved above the 1.09 resistance area as the dollar lost interest rate support at stealth pace. US recession risks and bets on fast and large rate cuts trumped traditional safe haven flows into USD. EUR/USD 1.1276 (2023 top) serves as next technical references.
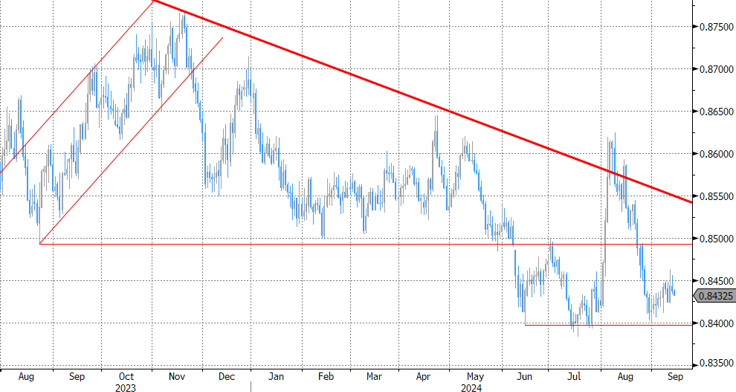
EUR/GBP
The BoE delivered a hawkish cut in August. Policy restrictiveness will be further unwound gradually on a pace determined by a broad range of data. The strategy similar to the ECB’s balances out EUR/GBP in a monetary perspective. Recent better UK activity data and a cautious assessment of BoE’s Bailey at Jackson Hole are pushing EUR/GBP lower in the 0.84/0.086 range.
Industrial Production and Inflation Expectations in the Spotlight
In focus today
In the US, the University of Michigan's preliminary consumer sentiment survey for September is due. With underlying inflation moderating and short-term market-based inflation expectations declining with global oil prices it will be interesting to see if the reading reflects these trends. In August, 1y and 5y inflation expectations stood at 2.8% and 3.0%, respectively.
Focus in the euro area is on the industrial production data for July, which has been declining for over a year now - with PMIs suggesting this trend continues coupled with weak national data. This will be the first hard data point on production for Q3 and offers a hint of expected GDP growth.
Economic and market news
What happened yesterday
In the US, US PPI data aligned with expectations, with the core figure coming in at 0.3% m/m SA, slightly above the consensus of 0.2% m/m. Meanwhile, jobless claims held steady at around 230k.
On the election front, Donald Trump announced he will not take part in another presidential debate with Kamala Harris before the November 5th election.
In the euro area, the ECB delivered a 25bp cut, as widely expected, bringing the deposit rate to 3.5%. ECB President Lagarde provided no guidance on the timing of the next policy move yet given that she did not see the need to impact the market pricing, we believe that the ECB is overall content with the current market pricing of 25bp/quarter through the end of next year, as domestic inflation pressure remains elevated due to high wage growth. Lagarde also highlighted the further confidence of the 2% inflation target being met in the medium-term, while the accompanying staff projections only saw cosmetic changes. For more details, please see Flash: ECB Review, 12 September.
In Norway, the regional network survey showed that capacity utilisation surprisingly continued to rise, a key concern for Norges Bank (NB) back in June, indicating more sticky domestic inflation. This likely means that NB will not provide any signals for a rate cut next week- at least not to any meaningful extent. While the growth outlook remains weak, slightly below NB's assumptions, the report does not support a dovish turn given the bank's cautious stance on premature rate cuts. Wage expectations for next year remained at 4.3%, slightly below NB's June MPR forecast of 4.5%, while 2024 expectations held at 5.2%. Overall, the report confirms moderate growth with some weak details, aside from higher capacity utilization.
In Sweden, CPIF inflation for August came in at 1.2% y/y (consensus: 1.3%, Danske Bank: 1.1%), while CPIF excluding energy was 2.2% y/y - slightly above our 2.1% forecast but in line with the Riksbank and market expectations. The lower-than-expected headline figure could influence the Riksbank's thinking about the pace of rate cuts.
In commodities space, the International Energy Agency (IEA) has reduced its global oil demand forecast for 2024 by 7.2%, primarily due to a slowdown in the Chinese oil demand. The forecast for 2025 remains unchanged. The revision follows OPEC's announcement earlier this week, in which the cartel also cut its demand growth forecast for 2024 and 2025, also citing weak economic growth in China. The discrepancy between OPEC's and the IEA's 2024 projections corresponds to over 1% of world demand (OPEC: 2,030k/bd, IEA: 900k/bd). As of this morning brent is trading around USD72.30/bbl.
Equities: Global equities were higher yesterday, with broad-based gains across sectors, styles, and regions. Yes, cyclicals did outperform slightly, but the outperformance versus defensives was not sizeable, considering the significant lift in risk appetite. In the US yesterday, the Dow was up +0.6%, the S&P 500 +0.8%, the Nasdaq +1.0%, and the Russell 2000 +1.2%. The picture is more mixed in Asia this morning. However, it is much more interesting with short-end US yields dropping, following former Fed member William Dudley's strong case for a 50bp cut by the Fed next. This reaction is not visible in futures in Europe or the US, which are both higher at the time of writing.
FI: Lagarde was on a clear mission not to rock the boat at yesterday's meeting, and she succeeded. The deposit rate cut of 25bp was in line with forecasts, while the ECB highlighted its flexible stance on monetary policy, avoiding explicit forward guidance. Movements in EGB yields were relatively subdued, with the 10Y Bund yield rising 5bp and the 2Y segment rising by 7bp throughout the session. The aggregate expectation for ECB rate cuts through end-2025 slightly decreased, settling around 180bps after accounting for yesterday's 25bp. Following yesterday's remarks from Lagarde, the ECB seems satisfied with the current market expectations.
FX: Cyclically sensitive currencies were the clear outperformers yesterday with especially NOK doing well in G10 space. EUR/USD edged somewhat higher during the US session while both JPY and CHF underperformed amid green equity markets. EUR/SEK moved back below the 11.40 mark while EUR/GBP erased Wednesday's gains.
Euro Rebounds on Lack of Hint for Further Cuts
The European Central Bank (ECB) yesterday lowered its deposit facility rate by 25bp for the second time this year (and its other two rates by 60bp, but that was just a technical twist that meant to narrow the spread between the deposit facility and the main refinancing rate from 50 to 15bp, so don’t be confused: it was not an additional easing and didn’t see any sharp reaction from the market).
But ECB Chief Christine Lagarde kept a poker face for what’s next and said that there is no commitment to a particular rate path.
And the updated forecasts didn’t help much either. The European officials revised their growth projections lower for the next two years and kept their inflation forecasts unchanged, but they increased their core inflation forecast for this year and the next. It was like tightening the belt on one side but loosening it on the other.
As such, the ECB meeting ended with a lot of unanswered questions. It is now widely believed that the ECB will refrain from cutting rates again in October – that probability fell from 40% to 20% after yesterday’s decision. The 10-year German bund yield rebounded from August lows and the euro gained strength on hint that the ECB will do less to save the economy and more to make sure that prices are stable than... the Federal Reserve (Fed). The EURUSD rebounded from 1.10 and is trading at 1.1086 at the time of writing.
In equities, the ECB decision resonated well for the Stoxx 600. The index gained 0.80% yesterday, but the news flow wasn’t enchanting, mind you. Stellantis announced to suspend the production of the electric Fiat 500 in Italy due to a lack of orders in Europe. The shares fell.
Draghi’s plan
Ex-ECB chief Mario Draghi came up this week with an almost 400-page proposal across the EU targeting key sectors such as defense, digitalization, and clean energy. Draghi wants the Europeans to invest massively in these three sectors and finance this massive investment by issuing joint bonds. The plan aims to make Europe more competitive and less dependent on external resources, make it better compete with giants like the US and China while creating an EU-wide treasury bond to help finance these initiatives. It is an excellent initiative, really, it would not only give Europe a bigger posture in the global platform but it could also help the old continent get up to date in these sectors.
Such a big co-investment could indeed boost inflation in the short-run and pressure the yields to the upside, but faster, healthier and sustainable growth, and improved productivity are the best known remedies for inflation in the medium to long run.
But there is a problem. Draghi’s plan demands a lot of political effort within the EU that the countries like Germany and France – that are sliding to the right – will not be ready to make.
Elsewhere
US PPI came in higher-than-expected on a monthly basis, but lower-than-expected on a yearly basis. The US 2-year yield remains under a decent pressure, the US dollar remains sold across the board, and equities continue to recover. The S&P500, Nasdaq, Dow Jones and the Russell 2000 index extended gains yesterday. Nvidia gained nearly 2% on news that OpenAI is preparing the release of ‘Strawberry’ – a new AI model that’s ‘designed to handle advanced problem-solving tasks better by focusing on step-by-step human-like reasoning, which enhances the quality of its responses, especially for difficult queries’. This is how ChatGPT describes the new ‘Strawberry’. Combined with Nvidia CEO Jensen Huang’s complaints about ‘too strong demand for its chips’ yesterday, the AI fatigue seems to have eased this week. VanEck’s semiconductor ETF held ground at the 200-DMA this week, and its MACD – which indicates short-term trend – is about to turn positive.
Gold rallied to a fresh ATH on falling yields and softening US dollar, while crude oil tested the $70pb resistance despite unsupportive news from the IEA. The agency said that global demand growth is slowing ‘sharply’, that the world consumption increased by 800’000 barrels per day in H1 – a third of the expansion in the same period last year, and its head Fatih Birol said that ‘the Chinese economic growth is slowing down, and the penetration of the transportation system by electric cars is going at a very strong pace’. Yesterday’s rebound in oil prices was certainly refreshing but the rising demand concerns will likely limit the topside in oil prices. Topsellers will likely remain in charge within the $70/72pb range.
GBP/JPY Daily Outlook
Daily Pivots: (S1) 185.39; (P) 186.07; (R1) 186.84; More...
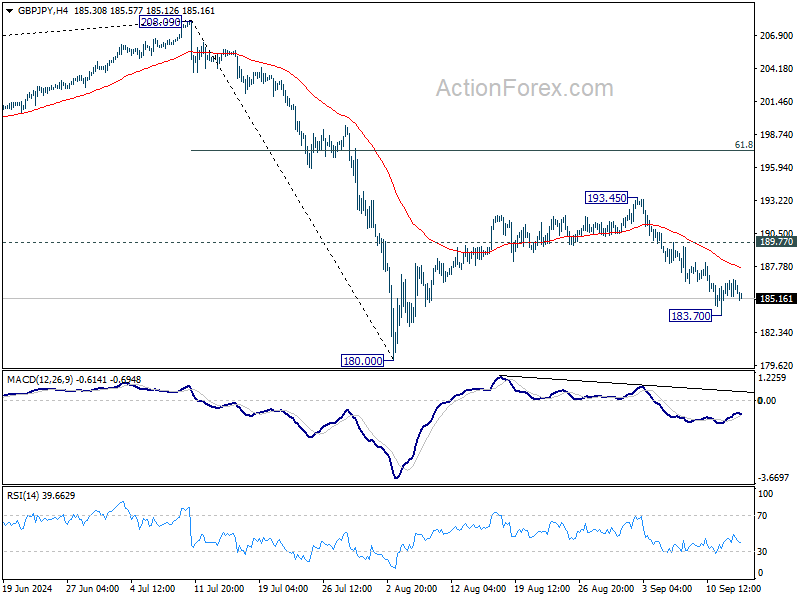
Intraday bias in GBP/JPY remains neutral for the moment. Further decline is expected as long as 189.77 resistance holds. Below 183.70 will bring retest of 180.00 low. Break there will resume whole fall from 208.09 to 175.94 fibonacci level.
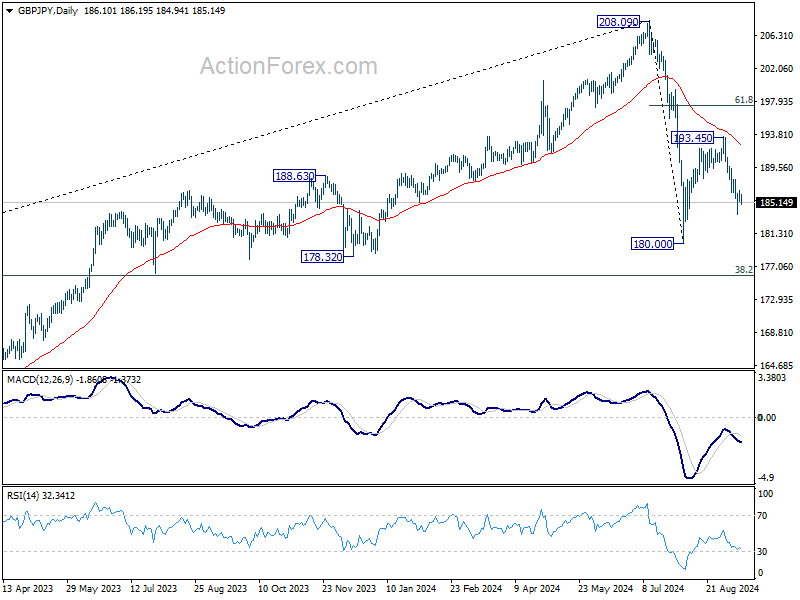
In the bigger picture, price actions from 208.09 are seen as a correction to whole rally from 123.94 (2020 low). The range of consolidation should be set between 38.2% retracement of 123.94 to 208.09 at 175.94 and 208.09. However, decisive break of 175.94 will argue that deeper correction is underway.
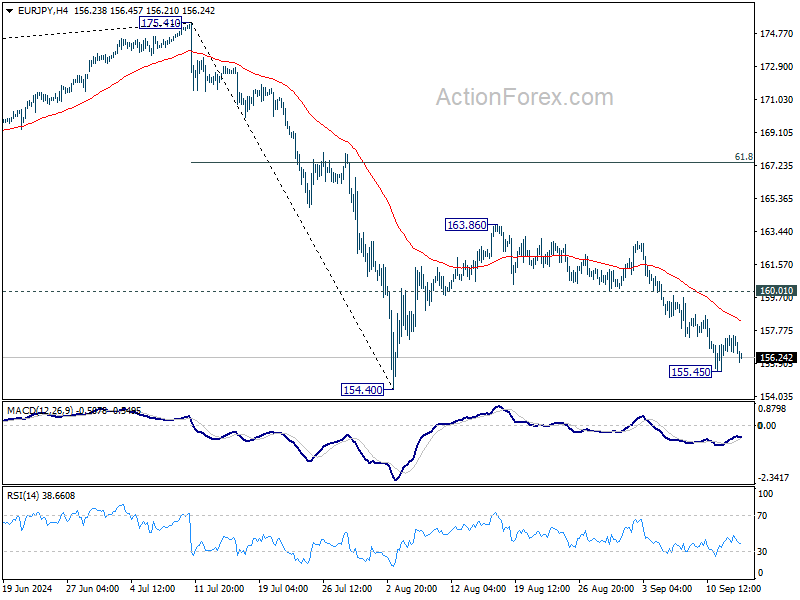
EUR/JPY Daily Outlook
Daily Pivots: (S1) 156.56; (P) 157.04; (R1) 157.55; More....
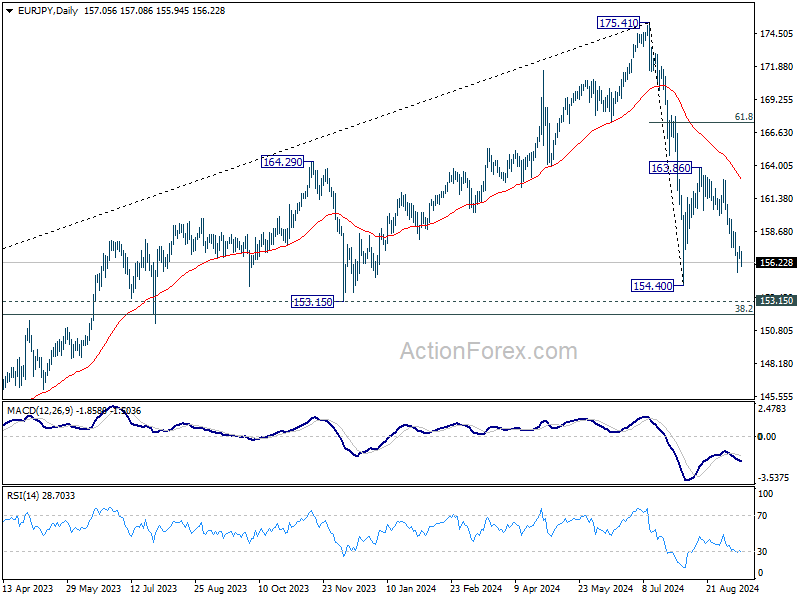
Intraday bias in EUR/JPY remains neutral and further decline is expected as long as 160.01 support turned resistance holds. Below 155.45 will bring retest of 154.40 low. Firm break there will resume whole decline from 175.41 to 153.15 support.
In the bigger picture, price actions from 175.41 are seen as correction to rally from 114.42 (2020 low). The range of consolidation should have been set between 38.2% retracement of 114.42 to 175.41 at 152.11 and 175.41 high. However, decisive break of 152.11 would argue that deeper correction is underway.
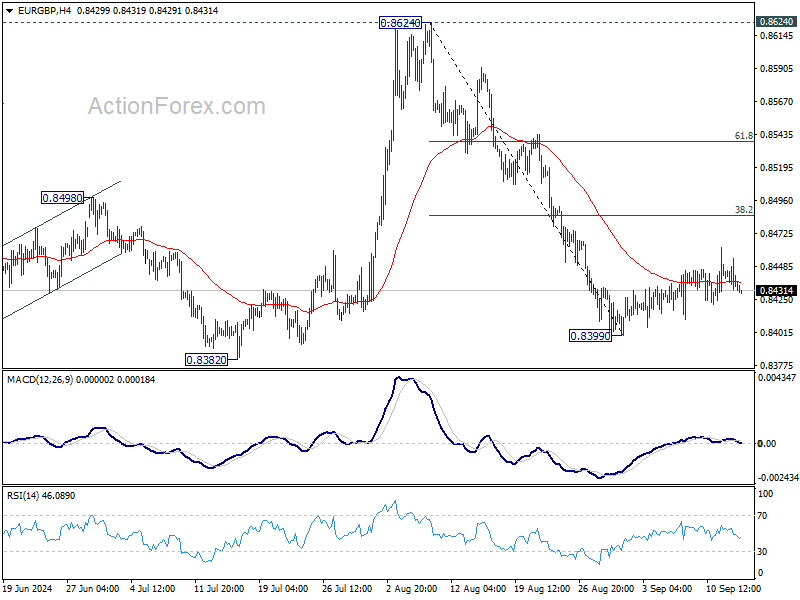
EUR/GBP Daily Outlook
Daily Pivots: (S1) 0.8429; (P) 0.8443; (R1) 0.8451; More...
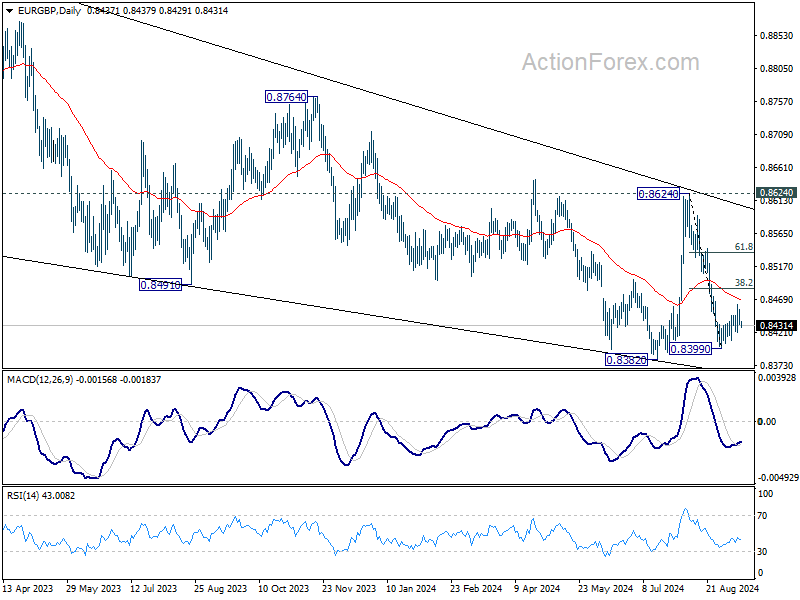
EUR/GBP is still bounded in consolidation from 0.8399 and intraday bias remains neutral. Stronger recovery might be seen but upside should be limited by 38.2% retracement of 0.8624 to 0.8399 at 0.8485. Break of 0.8399 will bring retest of 0.8382 low. Firm break there will resume larger down trend. However, sustained break of 0.8485 will bring stronger rally to 61.8% retracement at 0.8538 and possibly above.
In the bigger picture, as long as 0.8624 resistance holds, down trend from 0.9267 is expected to continue. Firm break of 0.8382 will target 0.8201 (2022 low). However, decisive break of 0.8624 will indicate that such down trend has completed, and turn outlook bullish for 0.8764 resistance next.
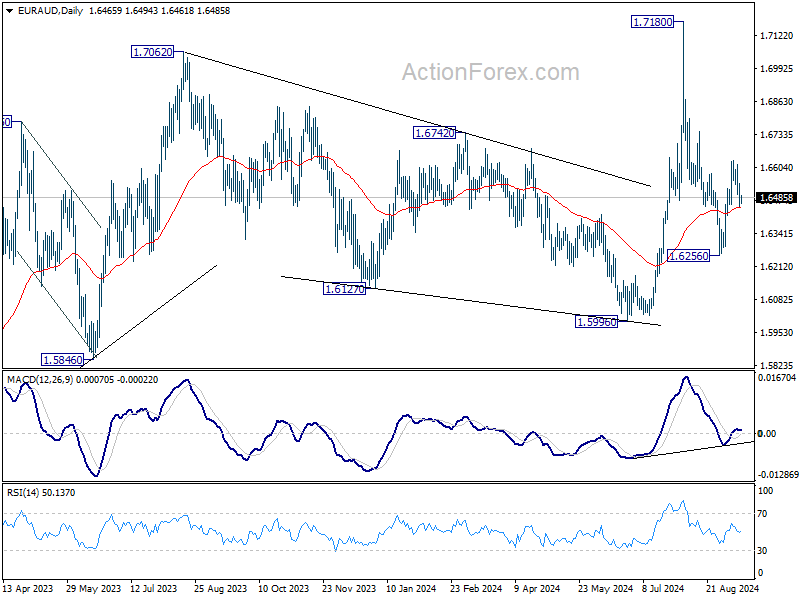
EUR/AUD Daily Outlook
Daily Pivots: (S1) 1.6437; (P) 1.6488; (R1) 1.6524; More...
Intraday bias in EUR/AUD remains neutral at this point. Rebound from 1.6256 is still in favor to continue as long as 1.6457 support holds. Above 0.6629 will turn bias back to the downside for retesting 1.7180 high. However, firm break of 1.6457 support will suggest that the rebound has completed already, and turn bias back to the downside for 1.6256 again.
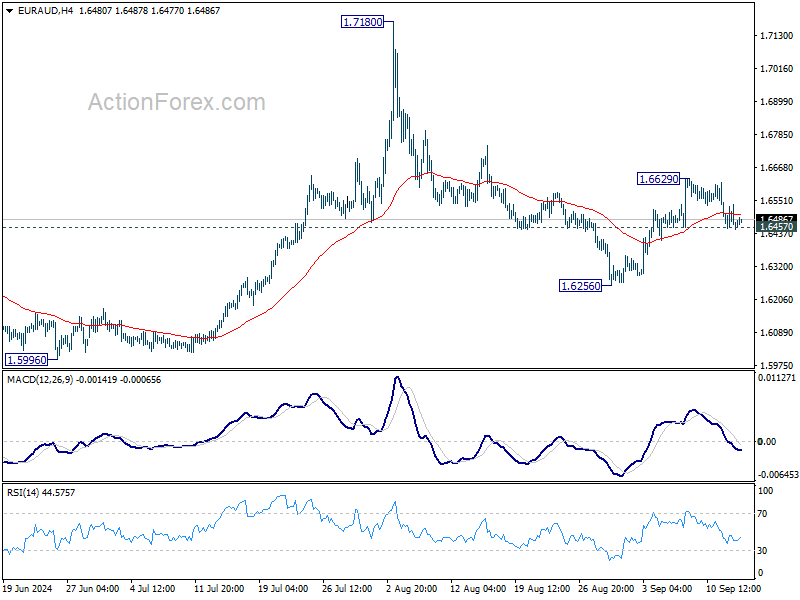
In the bigger picture, outlook is mixed up by the deeper than expected fall from 1.7180. Yet as long as 1.5996 support holds, up trend from 1.4281 (2022 low) is still expected to resume at a later stage. Firm break of 1.7180 will pave the way to 61.8% projection of 1.4281 to 1.7062 from 1.5996 at 1.7715.
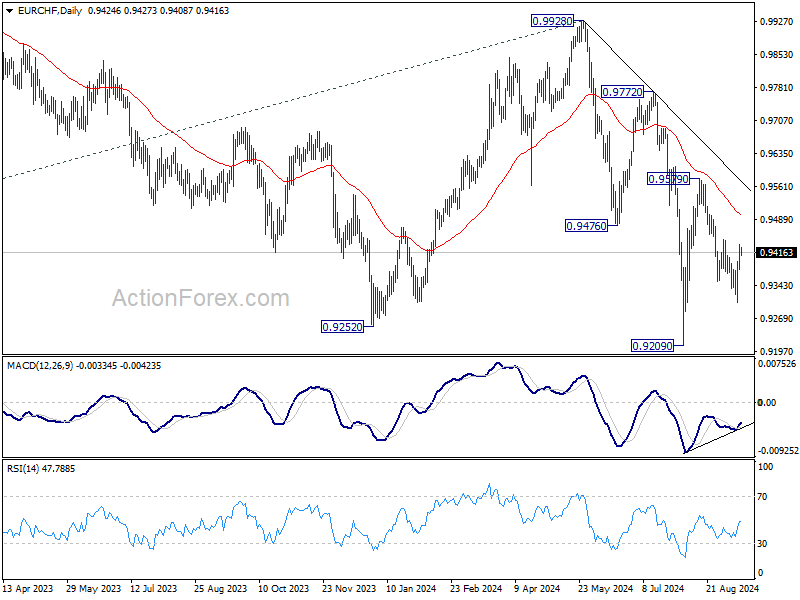
EUR/CHF Daily Outlook
Daily Pivots: (S1) 0.9393; (P) 0.9413; (R1) 0.9448; More....
Intraday bias in EUR/CHF remains neutral for the moment. Deeper decline is still expected with 0.9444 resistance intact. Below 0.9305 will resume the fall from 0.9579 to retest 0.9209 low. Nevertheless, firm break of 0.9444 will argue that the pull back from 0.9579 has completed as a correction, and bring further rally back to this resistance.
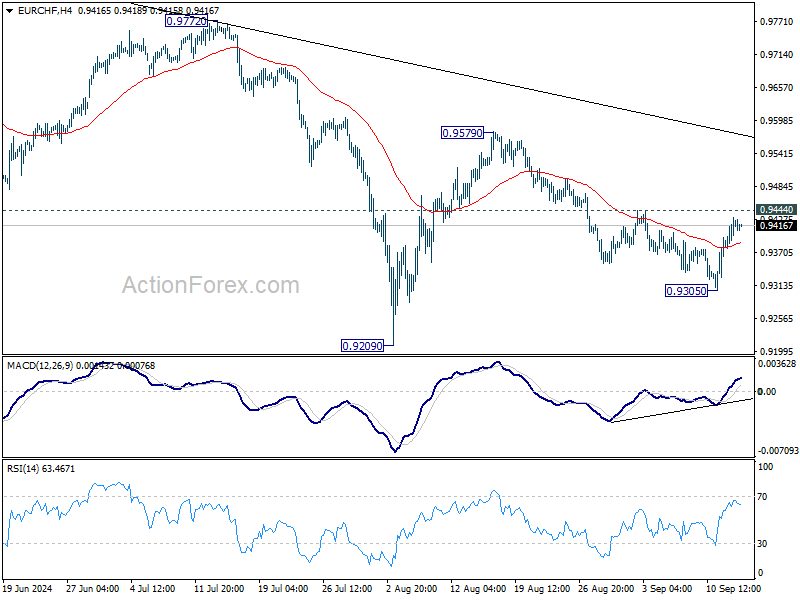
In the bigger picture, medium term corrective pattern from 0.9407 (2022 low) might have completed with three waves to 0.9928. Decisive break of 0.9252 (2023 low) will confirm long term down trend resumption. Next target will be 61.8% projection of 1.1149 to 0.9407 from 0.9928 at 0.8851. For now, outlook will stay bearish as long as 0.9928 resistance holds, even in case of strong rebound.
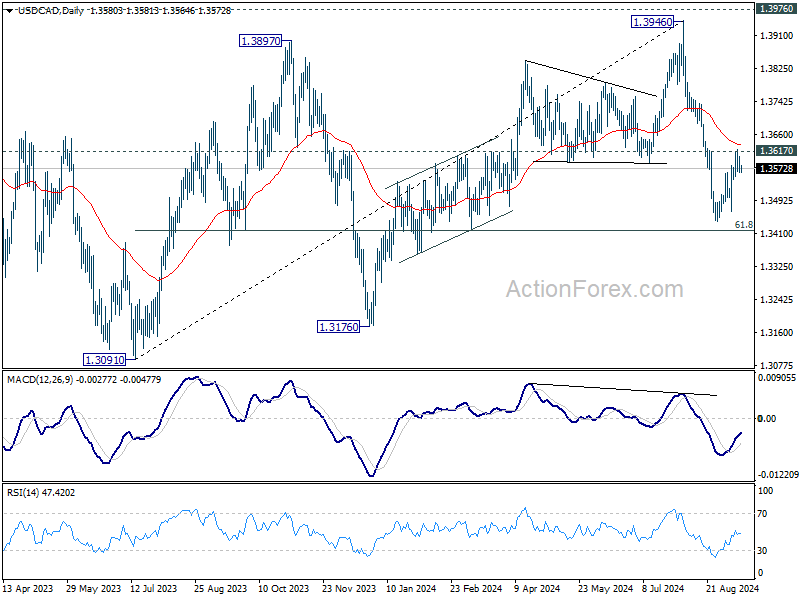
USD/CAD Daily Outlook
Daily Pivots: (S1) 1.3562; (P) 1.3584; (R1) 1.3602; More...
Intraday bias in USD/CAD remains neutral first and further decline is in favor. On the downside, below 1.3545 minor support will bring retest of 1.3439 low first. However, firm break of 1.3617 will turn bias back to the upside for stronger rebound instead.
In the bigger picture, current development suggests that corrective pattern from 1.3976 (2022 high) is extending with another falling leg. While deeper decline could be seen, strong support should emerge above 1.2947 resistance turned support to bring rebound. Rise from 1.2005 (2021 low) is still in favor to resume at a later stage.