Sample Category Title
Back to the (Slow) Grind?
Rising taxation has dragged on household incomes and spending. Even with expanding public demand, this has helped to lower the growth outlook for the next couple of years.
This week we released our refreshed forecasts in our September Market Outlook (PDF 2MB) publication. While the short-run outlook is broadly the same, the balance of risks on growth has changed further out by enough to alter our base case for growth into 2026. This is partly because the mix and timing of demand growth has shifted.
For some time, the narrative has been that tax cuts, lower inflation and an eventual easing in interest rates – a reversal of the ‘triple squeeze’ – would lift real household income growth enough to support a recovery in consumption, even as population growth normalises. This would in turn help spur investment spending further out. The resulting return to expansion around trend pace would follow a long period of sub-trend growth and, potentially, burgeoning spare capacity. Without a period of above-trend growth to offset this later on, unemployment could rise much higher than desired, and inflation could undershoot the 2–3% target range.
There were several ways this above-trend growth could occur. Monetary policy could end up a bit on the stimulatory side. Business investment could pick up to offset past underspending, catch up to the higher population, and support the transition to renewable energy. Or the combination of government infrastructure spending and the spillover benefits from completed infrastructure could spur additional growth and productivity. But our current thinking is that none of these drivers will be enough to generate above-trend growth in 2026. The drags from elsewhere are too significant.
Recent data suggest that things are turning out somewhat differently to our earlier view. Household income simply is not picking up that quickly. And while it is still early days, the impact of the Stage 3 tax cuts on consumption seems more likely to surprise on the downside than on the upside.
Indeed, the role of taxation is turning out to be more of a negative for private sector demand than we previously thought. Westpac’s customer data confirm (PDF 402KB) that the Stage 3 tax cuts have boosted household incomes since July. However, the national accounts data for the June quarter imply that the starting point for household incomes ahead of those tax cuts was weaker, in part due to an unexpectedly strong tax take. Bracket creep will become less of a drag as inflation, and so nominal income growth, eases. But there is more to the tax drag than simple bracket creep, and these other sources of drag could persist even as inflation falls.
Far too much current economic commentary starts from the presumption that the ripple effects from the pandemic are over, but some of them are not. One such ripple effect or catch-up is that, after easing off on tax collections as part of the government’s support for the economy during the pandemic, the ATO is now back enforcing in earnest. Strengthening collections is a key priority in its 2024–25 corporate plan. Historically, the ATO is a prominent lead creditor in business and other insolvencies, and this is once again the case. The impact is especially evident for small business. Public statements by companies who lend to small firms, and our own customers in this space, confirm that they are seeing ATO enforcement pick up.
The ATO itself reports that it has $50 billion in collectable debt on its book. This is a significant potential source of additional revenue compared with overall annual collections of around $600 billion. Not all of this will be the debt of households, so its collection will not necessarily be a drag on household incomes. But at least some of it will be debts of small unincorporated enterprises, which are included in the household sector in the national income accounts.
There is a flavour here of what we saw in 2018–2019, when household income was weak, but the tax take was nonetheless rising disproportionately as a result of better enforcement on deductions and other areas. The result contributed to soft overall demand and inflation continually undershooting the RBA’s target despite ultra-low interest rates. There were other things going on in the same direction, but more effective tax collection was part of the story.
The broader story, as in the years just before the pandemic, is the sharp expansion in the public sector. As we reported in the Market Outlook, public demand started rising as a share of the economy in the second half of the 2010s, continued to increase during and since the pandemic, and now stands at a record share of 27.3% of GDP. Related to this, the share of household income going to tax has also risen, reaching a multi-decade high in the second half of 2023. The increased spending reflects, among other things, expanding programs such as the NDIS, as well as the way the cost of the electricity rebates is recorded. The rising tax take is an arithmetic inevitability in a tax system where tax brackets are fixed in dollar terms unless the government actively chooses to change them.
As we saw with the mining investment boom, when one sector squeezes the others out, it takes a while for those other sectors to bounce back as the previously booming sector recedes. The upshot is that even as growth in the public sector slows, we are likely to see growth remain around trend at best over 2025 and 2026. Any spare capacity that builds up over the current period of slow growth would not be absorbed for some years. If that is the case, it seems unlikely that domestic cost pressures would remain elevated.
Germany 30 Technical: A Potential Bearish Reversal Looms
- The recent rebound from its 10 September low of 18,186 has faced a hurdle to clear above its 20-day moving average.
- Several key elements are advocating for a potential short to medium-term bearish reversal.
- Watch the key resistance at 18,660.
After the 9.4% drop seen in the Germany 30 CFD Index (a proxy for the DAX futures) from the 12 July 2024 high to the 5 August 2024 low, its price actions have recouped all its prior losses and revisited its current all-time high area at 18,930/18,994.
Since 3 September, it has faced a hurdle to clear above the 18.930/18,994 critical resistance zone, declined, and broke below its 20-day moving average on 6 September.
These observations suggest that the short-term uptrend and recovery phase from the 5 August low to the 3 September high is in jeopardy of reversing its course. Several elements hint at a potential bearish reversal scenario at this juncture.
Bearish key elements
The recent 2.3% rebound from its 10 September low of 18,186 has reached the 61.8% Fibonacci retracement of the prior decline from the 3 September high to the 10 September low, and confluences with 4/6 September swing highs that is acting as an intermediate resistance at 18,660.
The rebound mentioned above has taken the form of a potential “bearish flag” chart configuration pattern that implied a “dead cat bounce”.
The 4-hour Stochastic oscillator has almost reached an extreme overbought level of 99 where past price actions of the Index on several occasions saw a short to medium-term bearish reversal in price actions thereafter.
18,660 and18,390 are the two key levels to watch
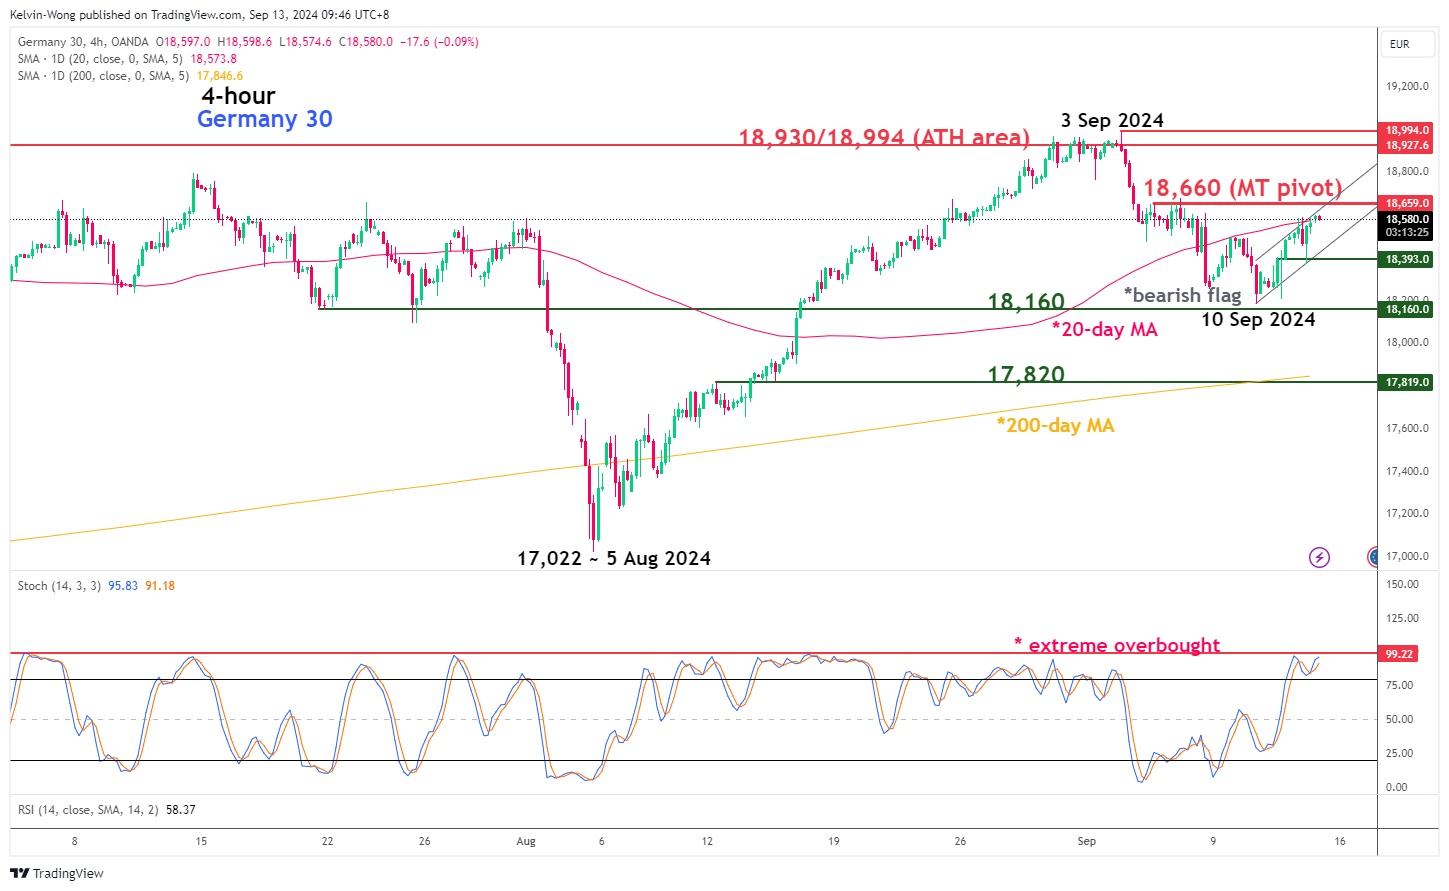
Fig 1: Germany 30 medium-term trend as of 13 Sep 2024 (Source: TradingView, click to enlarge chart)
The key medium-term pivotal resistance for the Germany 30 CFD Index stands at 18,660 which also coincides closely with the 20-day moving average that it has faced a challenge to reintegrate above it in the past four days.
A break below 18,390 (the lower boundary of the “bearish flag”) may trigger a potential fresh short to medium-term impulsive downmove sequence to expose the medium-term supports of 18,160 and 17,820 (also the 200-day moving average) (see Fig 1).
On the flip side, a clearance above 18,660 invalidates the bearish scenario for the next medium-term resistance to come in at 18,930/18,994 in the first step.
Silver Wave Analysis
- Silver reversed from support zone
- Likely to rise to the resistance level 30.00
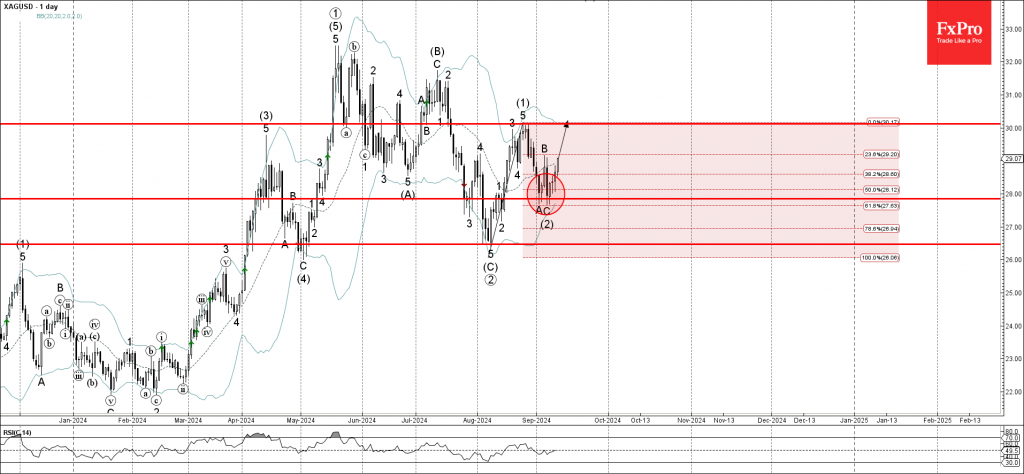
Silver recently reversed up from the support zone set between the key support level 28.00 (which also stopped wave A at the start of September) and the lower daily Bollinger Band.
The support level 28.00 was strengthened by the 61.8% Fibonacci correction of the upward impulse (1) from the start of August.
Silver can be expected to rise further to the next resistance level 30.00 (which stopped the previous impulse wave (1) at the end of August).
AUDCAD Wave Analysis
- AUDCAD reversed from support zone
- Likely to rise to the resistance level 0.9150
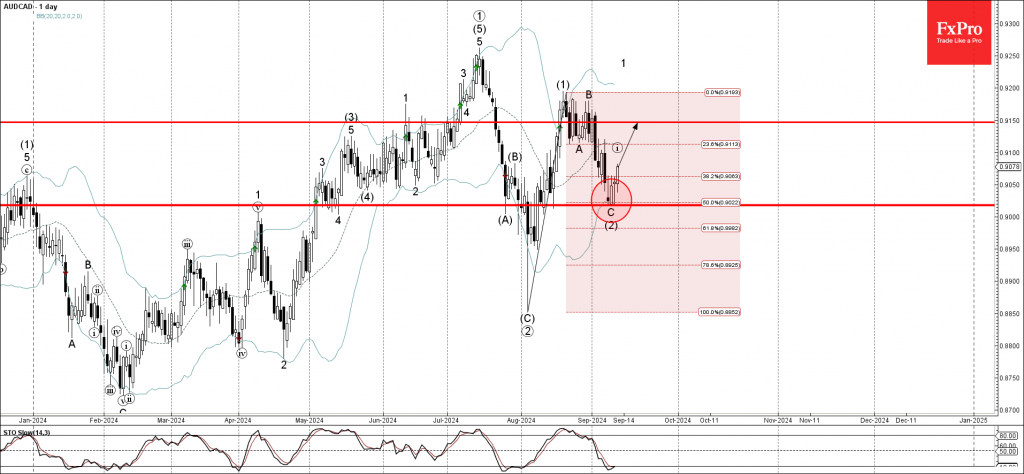
AUDCAD recently reversed up from the support area between the support level 0.9020 (which reversed the price at the start of August) and the lower daily Bollinger Band.
The upward reversal from the support level 0.9020 stopped the C-wave of the previous ABC correction (2).
Given the clear daily uptrend, AUDCAD can be expected to rise further to the next resistance level 0.9150 (middle of the congestions zone, which stopped the earlier waves (1) and B).
Crude Oil Slips After Brief Rally As USD Strengthens
Crude oil prices fell after initially gaining over 1.5% on Wednesday, marking the biggest rise in two weeks. Despite concerns about Tropical Storm Francine's impact on US oil production, traders believe the storm's effects will be short-lived due to the current oversupply in the market. The US Dollar also strengthened following a surprise rise in inflation data, reducing expectations of a large interest rate cut by the Federal Reserve, which in turn pressured oil prices. Additionally, the International Energy Agency (IEA) reported a slight drop in OPEC production, but Gulf producers maintained steady output. Meanwhile, Venezuela's crude delivery to India may proceed after approval outside the US embargo.
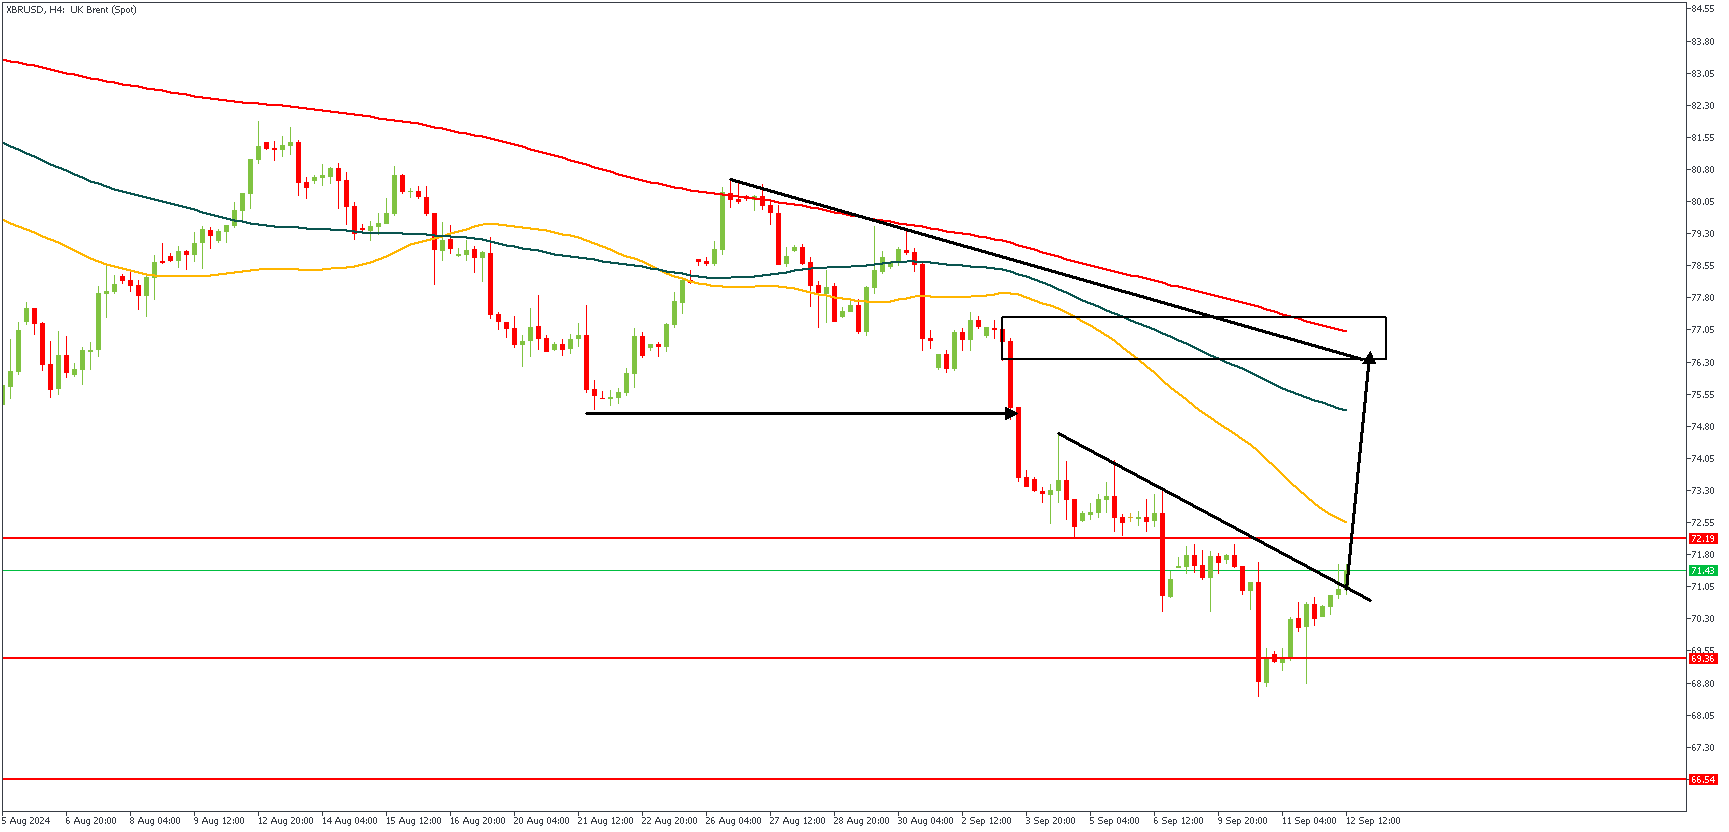
XBRUSD – H4 Timeframe
Brent on the 4-hour timeframe is currently within the daily timeframe pivot zone, and seems to be showing signs of a reversal. The bullish momentum has recently broken above the trendline resistance, indicating that price may be seeking out the supply zone behind the FVG (Fair-Value-Gap) at the highlighted break of structure, using the trendline resistance as a confluence.
Analyst’s Expectations:
- Direction: Bullish
- Target: $76.50
- Invalidation: $68.03
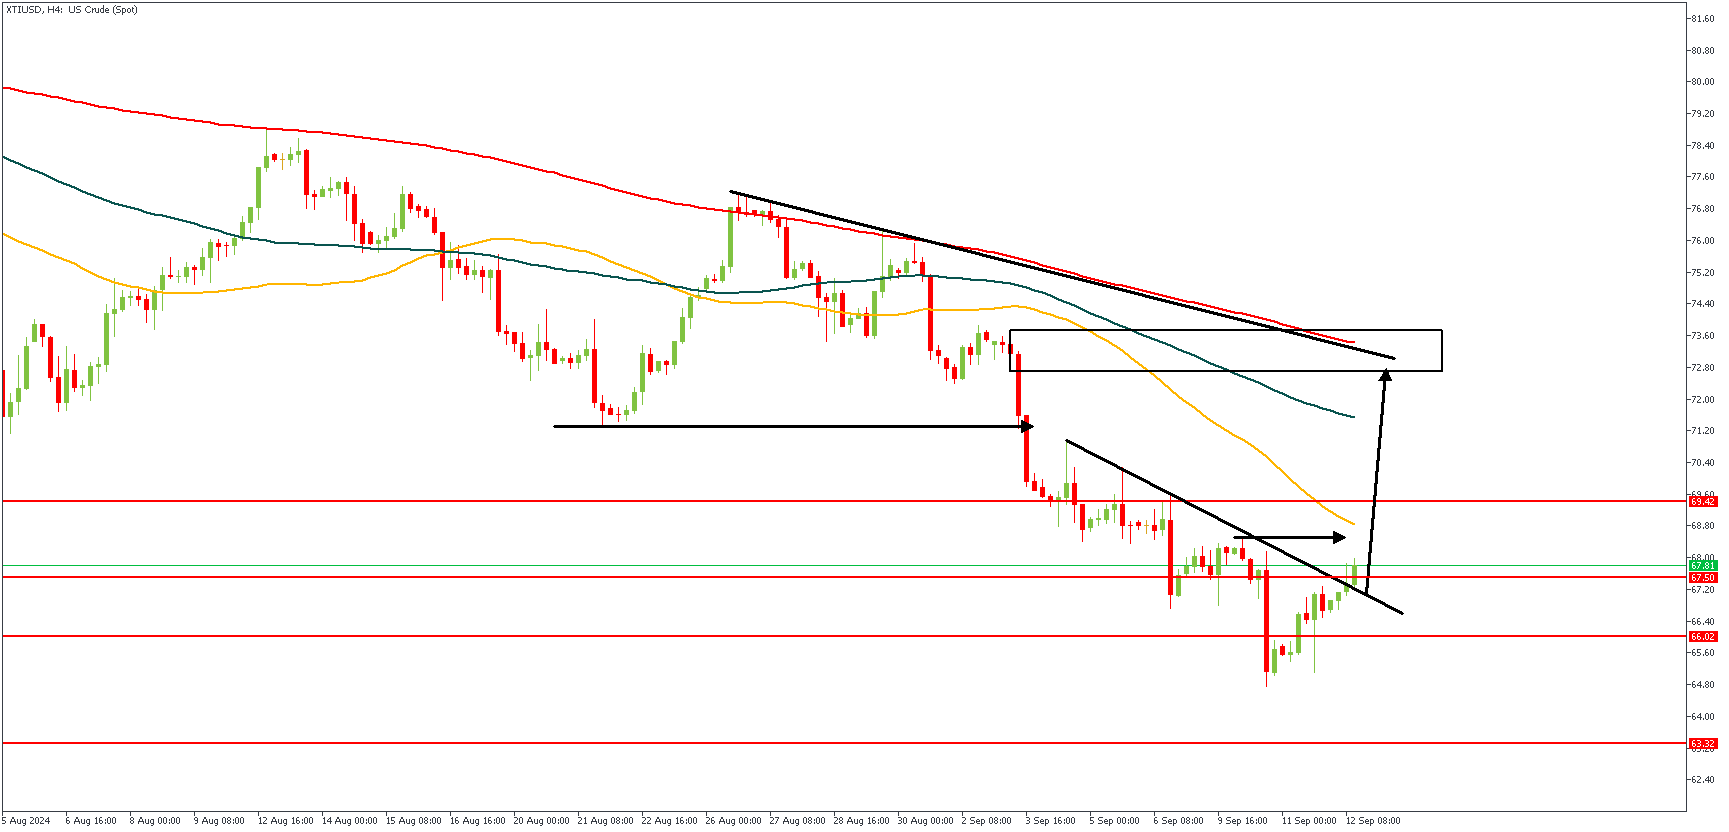
XTIUSD – H4 Timeframe
When price broke below the previous low on the 4-hour timeframe of XTIUSD, price created a supply zone, backed by a FVG (Fair-Value-Gap), or an imbalance as some would prefer to call it. It is notable to understand that price usually seeks out such price gaps in order to fill them and then rebalance the liquidity. In this case, since price has broke above the initial trendline resistance, it would therefore make sense for price to climb higher, reach for the supply zone at the FVG, before dropping back again – since the moving averages and trendline indicate that Oil might still be bearish overall.
Analyst’s Expectations:
- Direction: Bullish
- Target: $73.00
- Invalidation: $64.20
European Central Bank Continues Carefully Along Its Rate Cut Path
Summary
The European Central Bank (ECB) delivered a widely expected 25 bps cut to its Deposit Rate to 3.50% at today's monetary policy announcement, but remained relatively cautious about the pace of future easing. The ECB said domestic inflation and wages are elevated, but that labor cost pressures are moderating. The ECB was also guarded with regards to policy guidance, saying it remains data-dependent, and will take a meeting-by-meeting approach to its monetary policy decisions.
Regarding its economic projections, the ECB lowered its GDP growth forecasts but, importantly, revised its core CPI inflation forecasts slightly higher, in part due to persistent services inflation. Indeed, given the Eurozone productivity and cost backdrop, we believe the risks are tilted toward underlying inflation subsiding more slowly than generally expected. We remain comfortable with our view for an ECB rate pause in October, to be followed by a 25 bps Deposit rate cut in December, which would see the Deposit rate end 2024 at 3.25%. Our view also remains that the ECB will continue lowering its policy rate at a steady 25-bps-per-quarter pace (that is, every other meeting) in 2025, which would see the policy rate reach 2.25% by the end of next year.
European Central Bank Cuts Rates, Keeps Future Easing Options Open
The European Central Bank (ECB), as widely expected, cut its Deposit Rate by 25 bps to 3.50% at today's monetary policy announcement. In lowering interest rates, the ECB described inflationary pressures as still elevated but moderating. Accordingly, the announcement included a mixture of both hawkish and dovish comments. The ECB said:
- Domestic inflation remains high as wages are still rising at an elevated pace, but also that labor cost pressures are moderating, and profits are partially buffering the impact of higher wages on inflation.
- The outlook for core inflation has been revised slightly higher, as services inflation has lingered.
- Financing conditions remain restrictive, and economic activity is still subdued, reflecting weak private consumption and investment.
The ECB was noncommittal regarding the future outlook for policy rates, saying it “will continue to follow a data-dependent and meeting-by-meeting approach to determining the appropriate level and duration of restriction” of its monetary policy stance. The ECB also said that it is “not pre-committing to a particular rate path.”
In terms of the ECB's updated economic projections, the central bank lowered its GDP growth forecast for each and every year through its forecast horizon, and now sees Eurozone growth of 0.8% in 2024, 1.3% in 2025 and 1.5% in 2026. These are moderately softer than our own growth forecasts over the same period. Importantly, however, the ECB's forecasts indicated a slower ebbing in underlying inflation pressures than previously. The ECB projects core CPI inflation (that is, CPI ex food and energy) of 2.9% for 2024 and 2.3% for 2025, a touch higher than in the June projections. The core CPI forecast for 2026 of 2.0% is unchanged, and in line with the ECB's inflation target.
We also note some “hawkish leaning” comments from ECB President Lagarde in the post-meeting press conference. Lagarde said domestic inflation is not satisfactory and the ECB must be resilient in its approach. She also said there was a relatively short period of time until the ECB's October monetary policy meeting. Considering ECB President Lagarde's comments, and the upward revision to the ECB's core inflation projections, we remain comfortable with our view for an ECB rate pause in October, to be followed by a 25 bps Deposit rate cut in December, which would see the ECB's Deposit rate end 2024 at 3.25%.
Eurozone: Unimpressive Economic Growth, Lingering Inflation
Following a period of stagnation in the second half of last year, the Eurozone economy has returned to an expansion path during 2024, although the pace of growth has been unimpressive. Q2 GDP rose just 0.2% quarter-over-quarter and 0.6% year-over-year, and the underlying details were also subdued in tone. Q2 consumer spending actually fell 0.1% quarter-over-quarter, while much of the headline Q2 GDP growth stemmed from increased government spending and exports. Sentiment surveys have been mixed in recent months, although they did appear to get an Olympics-related boost in August, as the services PMI rose to 52.9 while the manufacturing PMI was steady at 45.8.
While economic indicators have been mixed, we believe the outlook remains for overall moderate and positive economic growth in the quarters ahead. With employment continuing to grow gradually, Eurozone real household income trends remain on a favorable path. For example, real employee compensation rose 2.5% year-over-year in Q2 while real household disposable income rose 2.6% in Q1, both well in excess of the 0.5% gain registered for consumer spending in Q2. Lower interest rates should ultimately be supportive of the Eurozone consumer, and we note that loans to households have picked up slightly in recent months.
The outlook for business investment is not quite as sanguine, given declining profit growth (that is, year-over-year declines in net entrepreneurial income) and falling capacity utilization. Our estimate of Eurozone core ex-housing investment fell 1.2% year-over-year in Q2, and the prospects for a sharp rebound in investment spending seem limited in the near term. That said, we believe an improving outlook for Eurozone consumers should outweigh the clouded outlook for businesses, and we believe Eurozone economic expansion can continue, albeit at a modest pace.
Even in the context of this underwhelming Eurozone growth outlook, lingering concerns about the inflation outlook, and how quickly inflation pressures are subsiding, have remained. Services inflation in particular has remained elevated, as pointed out in the ECB's announcement, with the latest reading showing a 4.2% year-over-year gain in August. Wage pressures have started to diminish, with the Q2 compensation per employee slowing to 4.3% year-over-year and the ECB's Indicator of Negotiated Wages slowing to 3.6%. Still, current wage growth trends remain above those that prevailed in the decade prior to the pandemic. Moreover, for now, current wage trends likely remain above levels that are consistent with underlying inflation returning to 2% on a sustained basis, particularly given the lack of any pickup in productivity. In terms of productivity, Q2 GDP per employed person actually fell 0.3% year-over-year, in contrast to average growth of 0.8% in the decade prior to the pandemic. We believe ECB policymakers will want to see a further slowing in wage growth, and/or improvement in productivity, to become increasingly confident that domestic inflationary pressures are subsiding. Indeed, in the current productivity and cost backdrop, we see risks that underlying inflation pressures subside more slowly than generally expected. For these reasons, and unless and until the productivity and cost backdrop changes, our view remains that the European Central Bank will continue lowering its policy rate at a steady 25-bps-per-quarter pace (that is, every other meeting), which would see the policy rate reach 2.25% by the end of next year.
September Flashlight for the FOMC Blackout Period
Summary
- Data released since the last FOMC meeting on July 31 make a compelling case for the Committee to begin easing the stance of monetary policy at its upcoming meeting on September 18. Inflation remains a bit above the Fed's target of 2%, but momentum in consumer prices clearly is slowing. Meanwhile, the labor market, the other half of the Fed's dual mandate, has softened.
- As stated by Fed Chair Jerome Powell, "the time has come for policy to adjust." The only question is the magnitude of the rate cut on September 18. Will the FOMC cut rates by 25 bps or sanction a 50 bps reduction?
- We expect the Committee will cut rates by 25 bps at the September 18 meeting based on recent remarks from Fed officials indicating that most favor a go-slow approach at this juncture. That said, some notable Fed officials, including FOMC Chair Powell and Vice Chair Williams, have refrained from commenting on how large a reduction may be warranted in the near term, keeping the door open to a larger cut in September. Therefore, we would not be totally surprised if the FOMC opted for a 50 bps rate cut instead.
- We look for the median dot in the dot plot to shift down by 50 bps to 4.625% for year-end 2024, indicating the median participant thinks another 50 bps of rate cuts after the September meeting will be appropriate by the end of the year. For 2025, we expect the median dot to fall to 3.375%, implying 125 bps of additional easing next year.
- We think that the run of 17 consecutive FOMC meetings without a dissent may be broken at this meeting. If, as we expect, the FOMC cuts rates by 25 bps, then we can envision more dovish voting members of the Committee potentially dissenting in favor of a larger reduction. Conversely, if the FOMC opts for a 50 bps rate cut, then hawkish voting members could dissent, preferring a 25 bps rate reduction instead.
"The Time Has Come for Policy to Adjust"
Data released since the last FOMC meeting on July 31 make a compelling case for the Committee to begin cutting the federal funds rate at its upcoming meeting on September 18. For starters, inflationary pressures continue to subside. Although the year-over-year change in the core PCE price index, which Fed policymakers believe is the best measure of the underlying rate of consumer price inflation, remains above the central bank's target of 2%, momentum in consumer prices is slowing. The index rose at an annualized rate of only 1.7% between April and July, down sharply from the 4.5% annualized rate of change that was registered between December and March (Figure 1). In short, the FOMC has made additional progress recently in fulfilling the "stable prices" component of its dual mandate.
Turning to the other side of the dual mandate, the risks to "maximum employment" are rising. Although payrolls rebounded in August with a 142K monthly gain, up from only 89K in July, the underlying pace of job creation clearly has downshifted. Whereas payrolls rose at an average monthly pace of 207K in the first half of the year, the economy created only 116K jobs per month on average between June and August (Figure 2). Furthermore, the unemployment rate has trended up from 3.7% at the turn of the year to 4.2% in August. Softening in labor market conditions should help to put downward pressure on wage gains, thereby leading to further price growth moderation in coming months. In that regard, average hourly earnings were up 3.8% on a year-ago basis in August, which represents a significant slowing from the 5.9% increase that was registered in March 2022.
With the risks to the two sides of the dual mandate becoming more skewed toward the labor market, the time to begin easing monetary policy appears to have arrived. Federal Reserve Chair Jerome Powell signaled as much in his August 23 Jackson Hole speech when he stated "the time has come for policy to adjust." The only question appears to be the magnitude of the rate cut on September 18. That is, will the FOMC reduce its target range for the federal funds rate by 25 bps or by 50 bps?
We look for the FOMC to cut rates by 25 bps on September 18 based on our sense of the Committee's reaction function at present. Recent remarks from Fed officials indicate most favor a go-slow approach at this juncture. For example, Federal Reserve Governor Christopher Waller, who we consider a bellwether of the Committee, said in a speech after the August jobs report that he expects cuts to be done "carefully." Earlier in August, Fed Governor Michelle Bowman and Federal Reserve Bank of Boston President Susan Collins both indicated support for a "gradual" pace of cuts should inflation continue to ease. Philadelphia Fed President Patrick Harker noted the need to start bringing the fed funds rate down "methodically."
That noted, other Fed officials, including FOMC Chair Powell and Vice Chair John Williams, have refrained from commenting on how large a reduction may be warranted in the near term, keeping the door open to a larger cut in September. Although not our base case view, we readily acknowledge that the Committee may opt for a 50 bps cut in light of inflation having slowed considerably and in an effort to stave off the labor market cooling beyond the point of comfort.
Regardless of the size of the rate cut at the upcoming meeting, we look for the FOMC to ease significantly in the coming months. The stance of monetary policy, which we measure by the real fed funds rate, is quite restrictive at present (Figure 3). The “neutral” real rate is unobservable, but many analysts, including us, estimate it to be in the vicinity of 1.0%-1.5%. With the real rate currently standing at nearly 3%, the FOMC needs to cut the nominal fed funds rate considerably in coming months to get back to neutral. Otherwise, Federal Reserve policymakers risk driving the economy into recession with an overly tight stance of monetary policy. We look for the Committee to cut rates by 225 bps by mid-2025.
Looking for a Downward Shift in the Dots
The quarterly Summary of Economic Projections (SEP), which aggregates the individual macroeconomic forecasts of the 19 FOMC members, will be published at the conclusion of the September 18 meeting. Notably, the last SEP, which was published following the June FOMC meeting, showed the median FOMC member thought that only one 25 bps rate cut would be appropriate by the end of this year (Figure 4). As noted above, however, the risks to the Fed's two mandates have become evenly balanced since the publication of the last SEP, if not tilted toward the labor market in our view. Consequently, the dots for are likely will shift down. But by how much?
We expect the 2024 median dot to fall to 4.625%, implying two additional 25 bps cuts this year (after the September 18 meeting) and consistent with most officials anticipating a measured pace of rate cuts going forward. The dispersion of dots, however, is likely to be unusually wide considering the 2024 projection period will only cover the two remaining meetings of the year (November 7 and December 18). We would not be surprised to see at least one dot as low as 4.125%, and for the upper end of the distribution to indicate just 25 bps of easing this year (a dot of 5.125%).
In the June SEP, the median dot suggested participants anticipated a federal funds rate of 4.125% at year-end 2025. However, given the clear renewed progress in reducing inflation as well as the softening in the jobs market since then, we expect the median dot in 2025 to fall to 3.375%, implying 125 bps of additional easing next year. Compared to the June SEP, we think the 2026 median dot likely will sink 25 bps lower to 2.875%, closer to most participants' estimates of neutral. The upcoming SEP also will provide projections for 2027 for the first time, and we expect the median estimate to be near participants' estimates of the longer run federal funds rate. We do not expect the longer-run median dot of 2.75% to change at this meeting.
The dot plot will garner the most market attention, but the FOMC likely will make some changes to other parts of the SEP. In June, the median forecast for the unemployment rate at the end of 2024 was 4.0%. With the jobless rate currently sitting at 4.2%, an upward revision to that level or even a tick higher seems probable. We also think some downward revisions to inflation in the SEP for this year seem likely. We estimate the Q4/Q4 rate of headline PCE inflation this year will be 2.5% compared to the June SEP estimate of 2.6%, while core PCE inflation is likely be up 2.7%.
Dissenting Voices
Dissents by FOMC voters at policy turning points are not uncommon. For example, the FOMC decided in June 2019 to keep rates on hold for the fourth consecutive meeting. However, James Bullard, who at the time was the president of Federal Reserve Bank of St. Louis, dissented because he preferred a 25 bps rate cut. The Committee then reduced its target range for the fed funds rate at its next meeting in July, but Boston Fed President Eric Rosengren and Esther George, president of Kansas City Fed, both dissented because they wanted to keep rates on hold. A few years later, the FOMC tightened policy by 25 bps in March 2022, the first rate hike in the post-pandemic period. However, St. Louis Fed President Bullard dissented because he preferred a 50 bps increase at that meeting. The Committee accelerated the pace of tightening in June 2022 with a 75 bps rate hike, provoking a dissent by Kansas City Fed President George who preferred a 50 bps increase.
As demonstrated by the absence of dissents in the 17 meetings since the June 2022, the Committee has been more or less unified in its views regarding the appropriate stance of policy over that period. With the FOMC likely to cut rates on September 18 for the first time in more than five years, we would not be surprised to see that streak come to an end. If, as we expect, the FOMC cuts rates by 25 bps, then we can envision more dovish voting members of the Committee (e.g., San Francisco Fed President Mary Daly) potentially dissenting in favor of a larger reduction in the target range for the federal funds rate. Additionally, some dovish members of the Committee who are non-voters this year (e.g., Chicago Fed President Austan Goolsbee) could argue during the meeting that a 50 bps cut is appropriate. Conversely, if the FOMC opts for a 50 bps rate cut, then a hawkish voting member or two of the Committee (e.g., Governor Michelle Bowman or Richmond Fed President Thomas Barkin) could dissent, preferring a 25 bps rate reduction instead.
Sunset Market Commentary
Markets
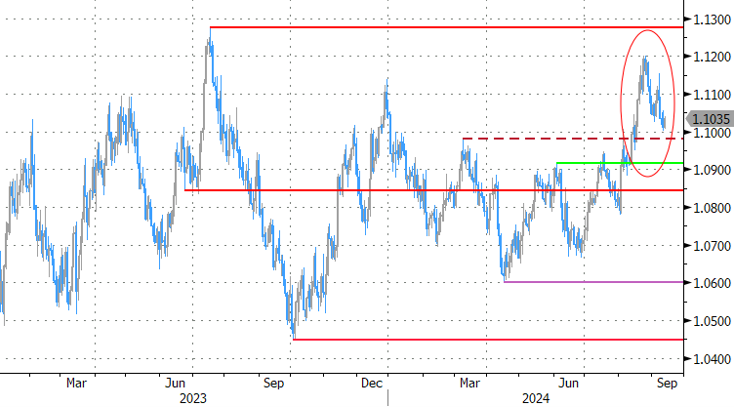
The US was at the center of attention yesterday with the August inflation figures. The spotlights today were aimed at Frankfurt. The European Central Bank delivered on the widely expected 25 bps rate cut that brought the deposit rate at 3.5%. It cut the MRO and MLF rates by 60 bps (3.65% and 3.90% resp.) in a technical adjustment to narrow the corridor again. In a system of excess liquidity this has no practical implications and says nothing about the monetary stance as such. Updated forecasts showed no change to the headline inflation outlook compared to June: 2.5%, 2.2% and 1.9% through 2024-2026. Core inflation was upped slightly to 2.9% and 2.3% for the running and next year, owing to higher-than-expected services inflation. Still-elevated wages are responsible but the ECB is seeing those labour cost pressures moderating. Core inflation should eventually decline to 2% in 2026 (no change). Growth was lowered 0.1 ppts across the policy horizon (0.8%, 1.3% and 1.5%) mainly due to a weaker contribution from domestic demand. With the recovery continuing to face headwinds, growth risks remain tilted to the downside. These growth & inflation dynamics as well as growing conviction of reaching the 2% target (especially over 2025) allow for a lesser degree of monetary restriction but ongoing vigilance remains warranted. The ECB sticks to a data-dependent approach and does not pre-commit to anything. Given the short time span between this meeting and the next - Lagarde during the presser confirmed the 6-week span is indeed limited - we believe the ECB will skip the rate cut occasion on October 17 and gets back at it in December. Questions about what to expect next/beyond October were easily deflected. Lagarde obviously did not want to validate current market expectations of (give or take) another 50 bps of cuts this year and instead explained painstakingly detailed how they came to today’s unanimous decision. Lagarde also took her time to throw some flowers to her predecessor Draghi and his extensive report earlier this week. That says something on her intentions of not wanting to reveal anything that carried a shred of new information. Markets reacted accordingly with near-zero movement in EUR/USD (1.103) or yields. German rates do add between 1 (30-yr) and 5.2 bps (2-yr) but the bulk of the move happened already before the decision. The ECB outcome coincided with some second-tier US data. But both jobless claims (230k) and PPI numbers (headline 0.2% m/m and 1.7% y/y, core 0.3% m/m and 2.4%) came in too close to expectations to move a needle.
News & Views
Swedish headline inflation fell by 0.6% M/M in August, more than the 0.4% decline expected. Headline inflation fell below the Riksbank’s 2% inflation target for the first time since July 2021 (1.9% Y/Y from 2.6% vs 2.1% expected). The central bank’s preferred CPIF inflation gauge (using fixed mortgage rates) similarly fell by 0.5% M/M to 1.2% Y/Y (from 1.7% vs 1.4% consensus). Excluding energy, CPIF fell by 0.3% M/M to stabilize at 2.2% Y/Y. Food (-0.4%), electricity (-6.1%), transport (-2.7%) and package holidays’ prices (-19.1%) all decreased in August. Higher clothing prices (+5%) only partly offset these price drops. Today’s inflation numbers strengthen market bets that the Swedish central bank will cut its policy rate at all of this year’s three remaining policy meetings, the upper end of the Riksbank’s own 2 to 3 times guidance. The Swedish krone didn’t suffer from the CPI miss (EUR/SEK 11.44). Next month, Statistics Sweden will introduce flash estimates for inflation, called Flash CPI. The Flash CPI is a preliminary figure and will be published five working days before the regular publication (first release Oct 8).
The International Energy Agency released its September Oil Market Report. Global oil demand growth continues to decelerate, with reported 1H24 gains of 800k b/d y/y the lowest since 2020. The chief driver of this downturn is a rapidly slowing China. Outside of China, oil demand growth is tepid at best. World supply rose by 80k b/d to 103.5m b/d, with outages caused by a political dispute in Libya combined with maintenance in Norway and Kazakhstan offset by higher flows from Guyana, Brazil and elsewhere. The IEA fears that OPEC+ may be staring at a substantial surplus even if its extra curbs were to remain in place with non-OPEC+ supply rising faster than overall demand. Early September, the oil cartel announced to postpone by two months the start of their planned unwinding of extra voluntary production cuts. Brent crude prices fell from $80/b+ levels at the start of the month to currently $71/b on growth slowdown/recession fears.
Graphs
European 2-yr swap yield unhindered by telegraphed ECB rate cut. Looks for a return higher after hitting 2.4% support yesterday.
EUR/USD shrugs at today’s policy decision as ECB offered no guidance on what to expect next.
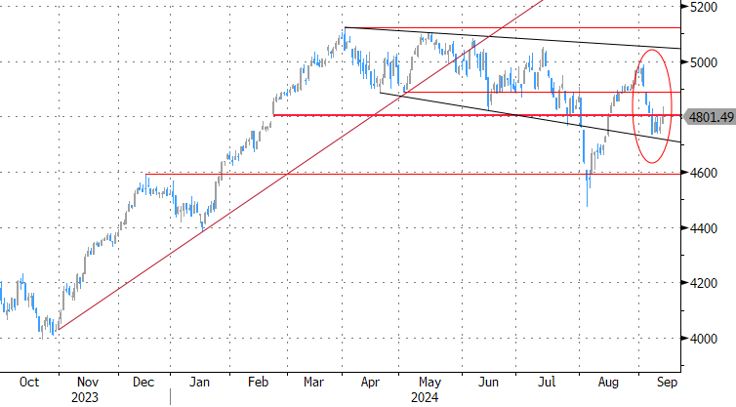
EuroStoxx50 stages a cautious rebound after kicking off September on terrible footing.
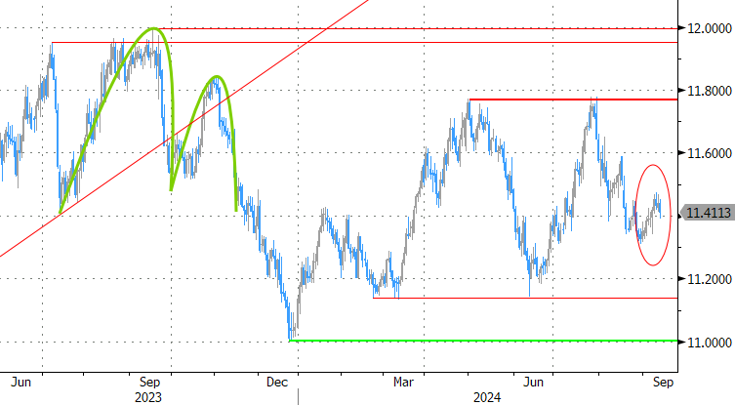
EUR/SEK: Swedish crown holds steady despite CPI miss boosting bets for 3 more Riksbank rate cuts this year.
NZ Dollar Drifting Ahead of Manufacturing Data
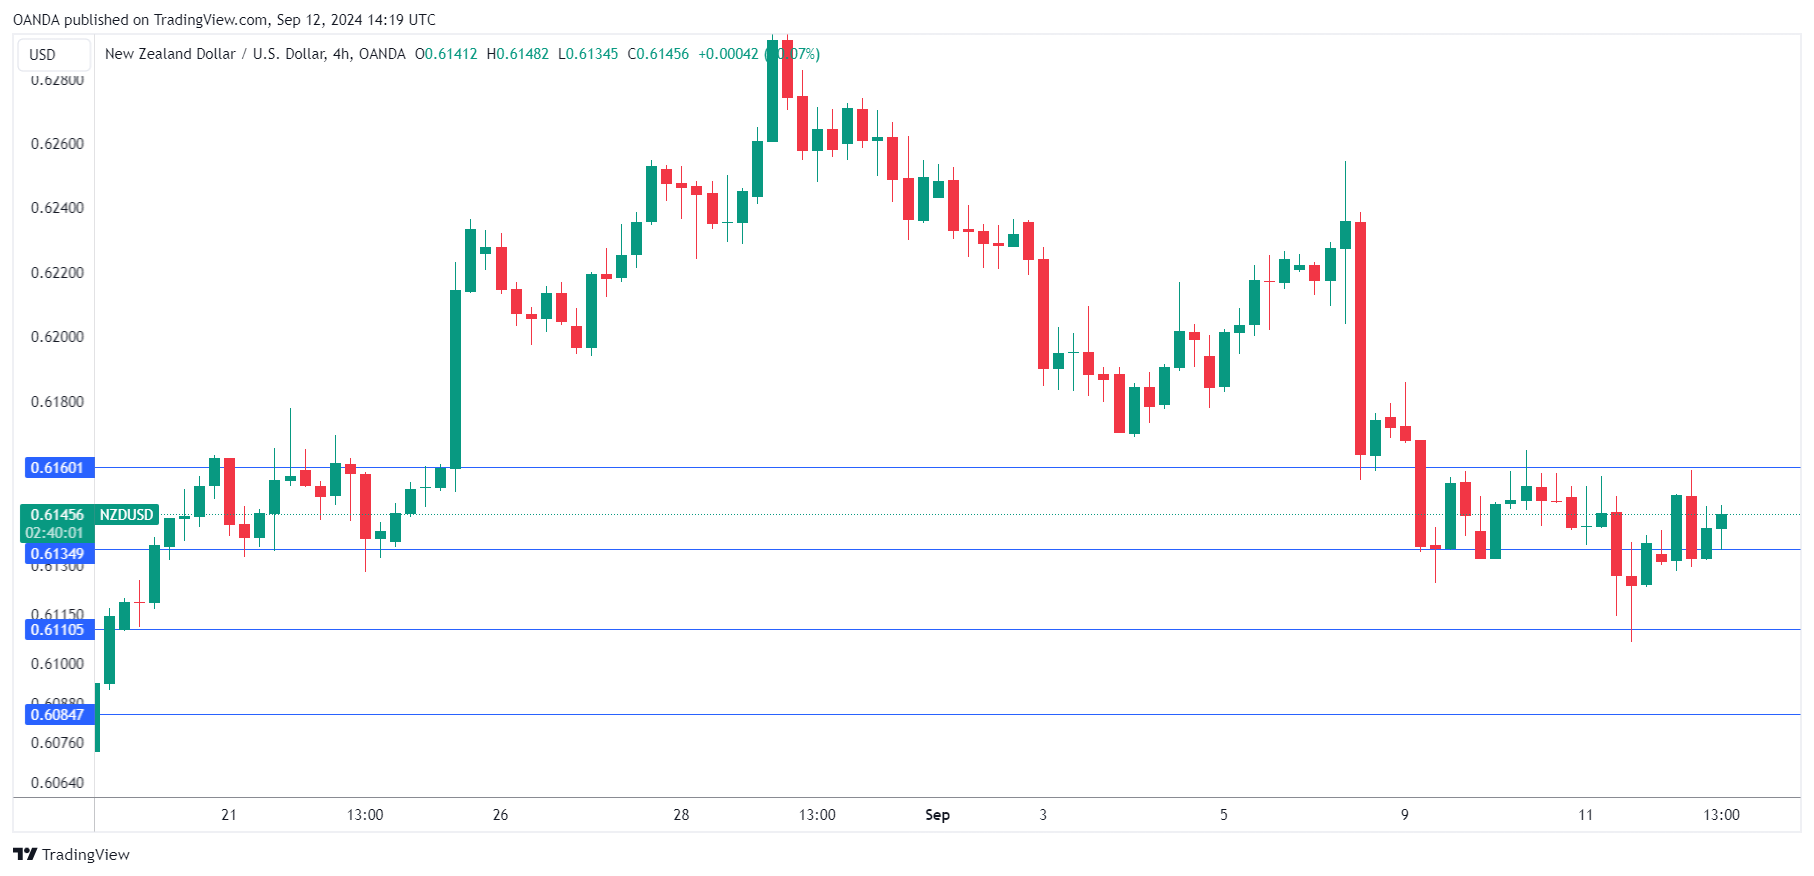
The New Zealand dollar is showing little movement on Thursday. NZD/USD is trading at 0.6139 at the time of writing, up 0.05% on the day.
New Zealand’s Manufacturing PMI expected to improve
New Zealand’s manufacturing sector has been in the doldrums, as the manufacturing PMI has posted 17 consecutive declines. Friday’s PMI is expected to improve to 47 in August, up from 44 in July (a reading below 50 points to contraction). The New Zealand economy has deteriorated and in August the Reserve Bank of New Zealand responded with its first rate cut since March 2020. The RBNZ has joined the club, as most major central banks have lowered rates and the Federal Reserve is poised to do so next week.
The RBNZ will be looking to continue lowering rates, as the cash rate of 5.25% remains high and is weighing on economic activity and households. Inflation has dropped to 3.3%, which is close to the target of between 1% and 3%. The central bank meets next on Oct. 9 and there is pressure on the RBNZ to follow up with a second straight rate cut.
In the US, today’s inflation numbers were a mix. Headline producer prices rose 1.7% Y/Y in August, following a downwardly revised 2.1% gain in July and just below the market estimate of 1.8%. However, core PPI rose from 2.3% to 2.4%, below the estimate of 2.5%. Today’s PPI data didn’t budge the market pricing of a Fed rate cut, with an 87% probability of a 25-bps cut next week, according to the CME FedWatch tool. Still, not everybody is on board for small cut – JP Morgan is projecting that the Fed will deliver a jumbo 50-bps reduction.
NZD/USD Technical
- NZD/USD is testing resistance at 0.6134. Above, there is resistance at 0.6160
- There are support lines at 0.6110 and 0.6084