
Sample Category Title
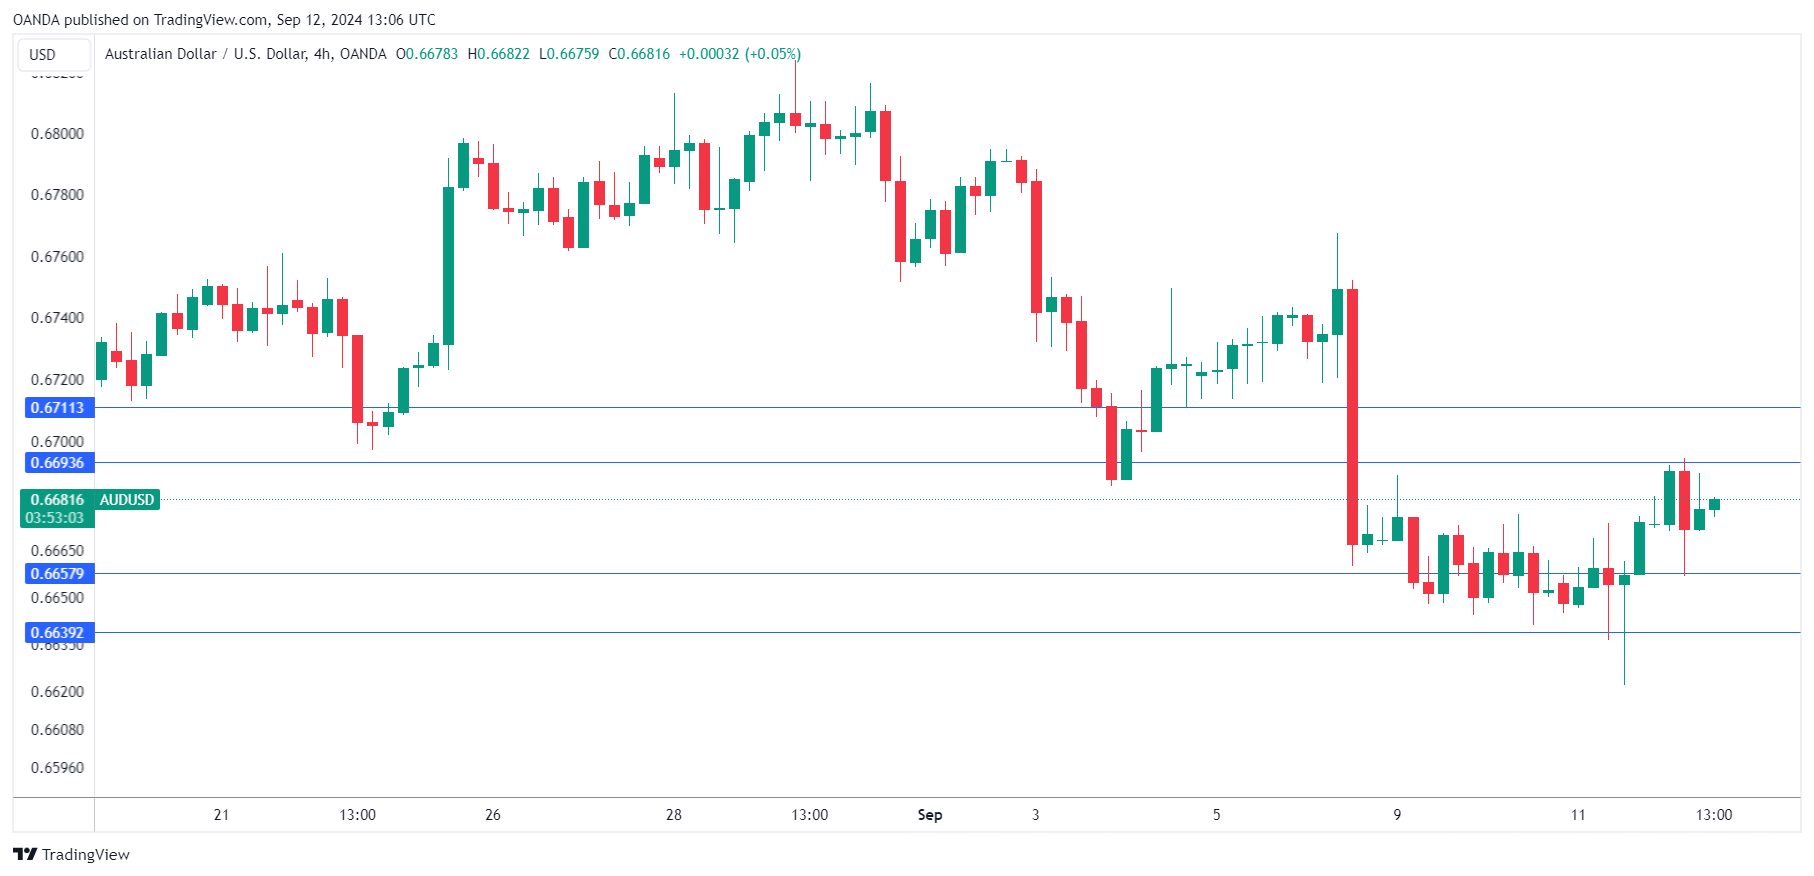
AUD/USD Edges Higher as Inflation Expectations Eases
The Australian dollar has posted slight gains on Thursday. In the European session, AUD/USD is up 0.16%, trading at 0.6684 at the time of writing.
Australia’s inflation expectations dip to 4.4%
Australia’s consumer inflation expectations eased to 4.4% in September, down slightly from 4.5% in August but above the forecast of 4.1%. The small decline reflects the path of inflation, which is moving lower but at a slow pace, a source of concern for the Reserve Bank of Australia.
The RBA has made considerable progress in the battle with inflation but inflationary pressures remains sticky despite elevated interest rates. Most major central banks have cut rates in the new era of lower inflation but the RBA is yet to join the club.
Inflation fell to 3.5% in July, down from 3.8% but above the market estimate of 3.4%. This remains well above the RBA’s target of between 2 and 3 percent. Governor Bullock has said that it’s too early to consider lowering rates but the markets are more dovish and expect an initial rate cut later in the year. The RBA meets next on Sept. 24 and is expected to maintain the cash rate at 4.35%, although an unexpected figure from next week’s employment report could mean some suspense before the rate announcement.
The Federal Reserve meets on Sept. 18 and the markets have fully priced in a rate cut. The Fed has held rates at the 5.25-5.50% target for over a year and this initial cut could have a significant impact on the financial markets. The most likely scenario is a modest 25-bps cut but JP Morgan is projecting a jumbo 50-bps cut.
AUD/USD Technical
- AUD/USD is testing resistance at 0.6693. Above, there is resistance at 0.6711
- 0.6657 and 0.6639 are the next support levels
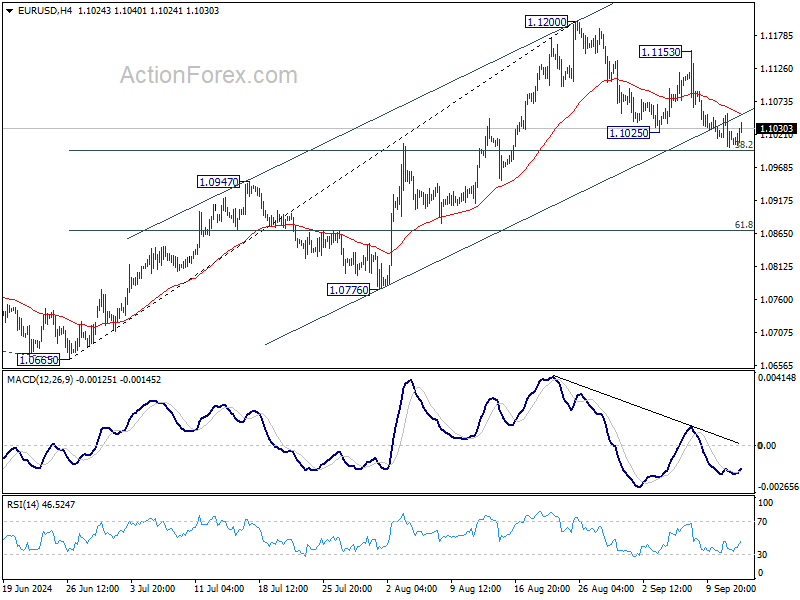
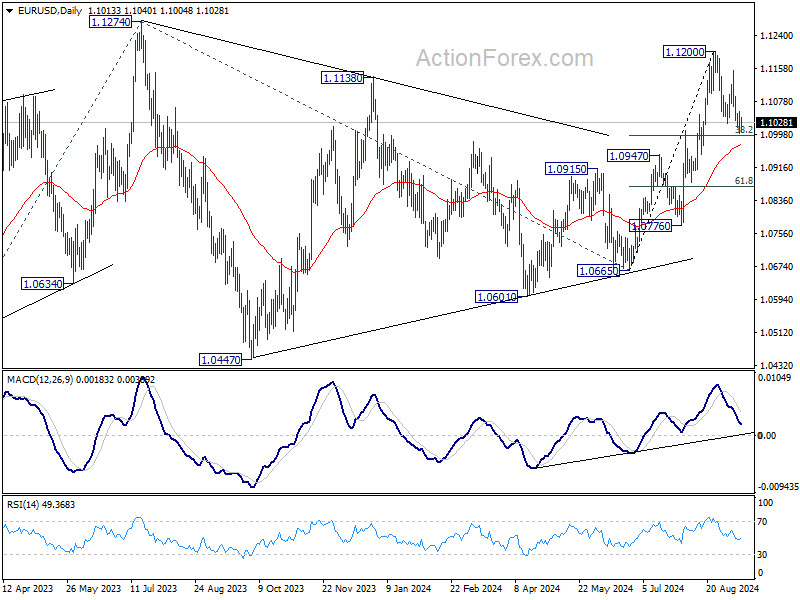
EUR/USD Mid-Day Outlook
Daily Pivots: (S1) 1.0991; (P) 1.1023; (R1) 1.1044; More....
Intraday bias in EUR/USD stays neutral despite current mild recovery. Focus stays on 38.2% retracement of 1.0665 to 1.1200 at 1.0996. Strong rebound from there will retain near term bullishness. Break of 1.1153 will indicate that larger rally is resuming through 1.1200 resistance to 1.1274 high. However, sustained break of 1.0996 will indicate reversal and turn bias to the downside for 1.0947 resistance turned support next.
In the bigger picture, prior break of 1.1138 resistance indicates that corrective pattern from 1.1274 might have completed at 1.0665 already. Decisive break of 1.1274 (2023 high) will confirm whole up trend from 0.9534 (2022 low). Next target will be 61.8% projection of 0.9534 to 1.1274 from 1.0665 at 1.1740. This will now be the favored case as long as 1.0947 resistance turned support holds.
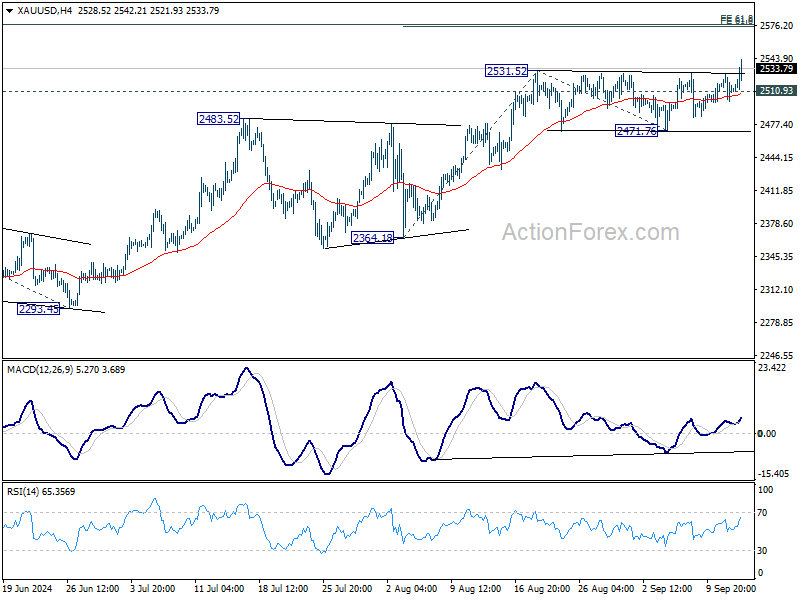
Euro Recovers Ground as ECB Cuts Rates; Gold Surges to Record High
Euro made a modest recovery following ECB's decision to cut deposit rate by 25bps, a move widely anticipated by the markets. The rate cut, decided unanimously, brings the deposit rate to 3.75%. During her post-meeting press conference, ECB President Christine Lagarde provided no surprise, reiterating the central bank’s commitment to a “data-dependent” and “meeting-by-meeting” approach. Lagarde stressed that policymakers would not rely on any single data point but instead assess a wide range of indicators. Importantly, she noted that ECB is not pre-committing to any specific future rate path, leaving the door open for adjustments depending on evolving economic conditions.
In the broader currency market, Yen emerged as the strongest performer for the day so far. Euro followed closely behind, buoyed by post-ECB relief, while Sterling also saw modest gains. On the weaker side, Swiss Franc and Canadian dollar lagged, with Dollar underperforming too. Meanwhile, Australian and New Zealand Dollars traded in middle positions.
Technically, Gold finally surges to new record high today. Near term outlook will now stay bullish as long as 2510.93 support holds. Next target is 61.8% projection of 2364.18 to 2531.52 from 2471.76 at 2575.17.
In Europe, at the time of writing, FTSE is up 0.65%. DAX Is up 0.79%. CAC is up 0.61%. UK 10-year yield is down -0.0086 at 3.763. Germany 10-year yield is up 0.0076 at 2.123. Earlier in Asia, Nikkei rose 3.41%. Hong Kong HSI rose 0.77%. China Shanghai SSE fell -0.17%. Singapore Strait Times rose 0.72%. Japan 10-year JGB yield rose 0.0124 to 0.866.
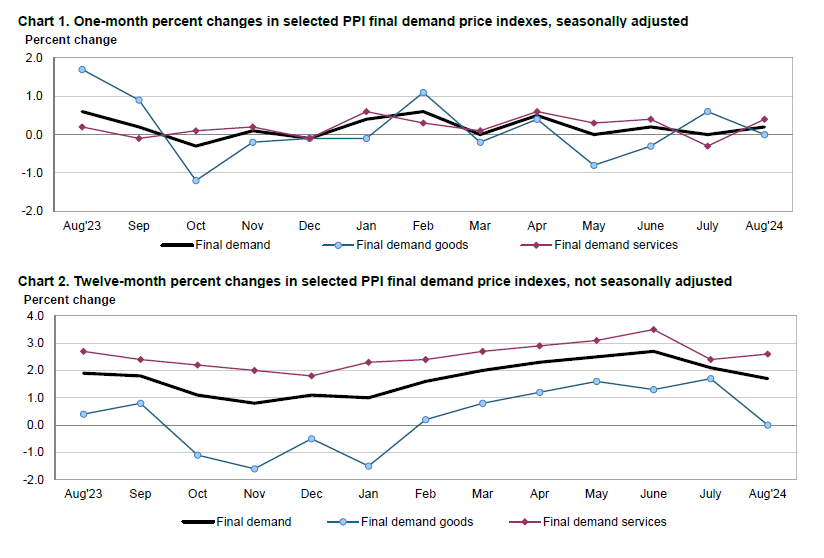
US PPI up 0.2% mom, 1.7% yoy in Aug
US PPI rose 0.2% mom in August, matched expectations. PPI services rose 0.4% mom while PPI goods was unchanged. PPI less foods, energy, and trade services rose 0.3% mom.
For the 12 month period, PPI advanced 1.7% yoy, slowed from 2.1% yoy. PPI less foods, energy and trade services moved up 3.3% yoy.
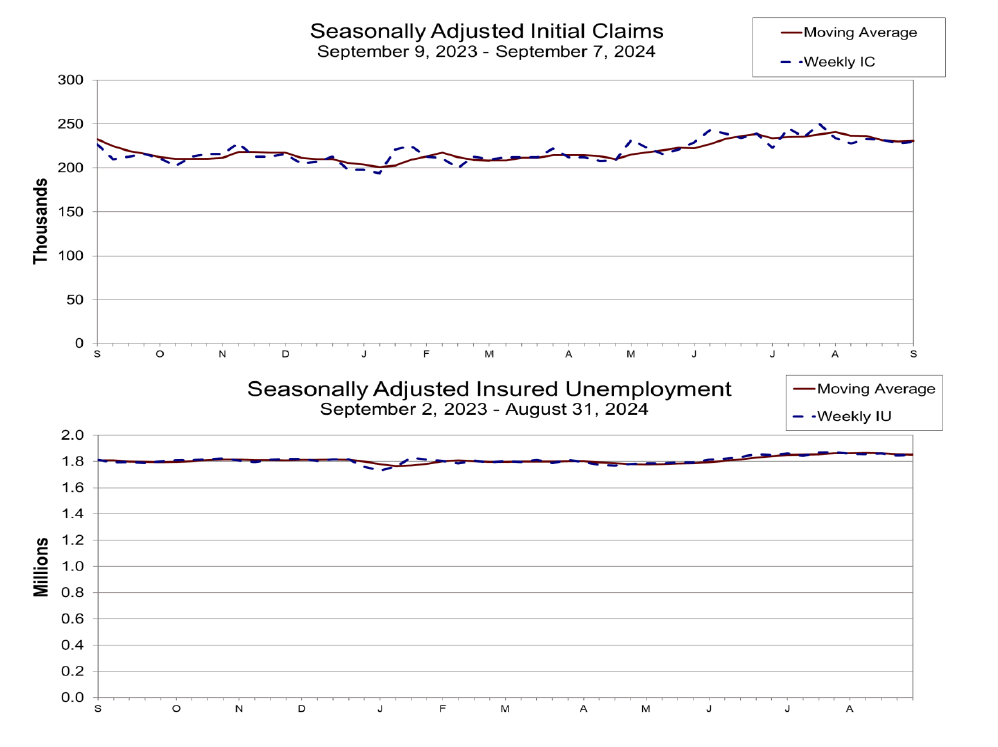
US initial jobless claims rises slightly to 230k
US initial jobless claims rose 2k to 230k in the week ending September 7, slightly below expectation of 231k. Four-week moving average of initial claims rose 500 to 231k.
Continuing claims rose 5k to 1850k in the week ending August 31. Four-week moving average of continuing claims fell -2k to 1853k.
ECB cuts deposit rate by 25bps to 3.75%
ECB followed expectations by lowering the deposit rate by 25 bps to 3.75%. The main refinancing rate was adjusted to 3.65%, as the spread between the two rates is now set at 15 bps. Moving forward, the ECB emphasized its commitment to a "data-dependent" and "meeting-by-meeting" approach, avoiding any pre-commitment to a specific rate path.
In its accompanying statement, ECB highlighted that recent inflation data had been largely in line with projections. Inflation is expected to rise again towards the end of the year, primarily due to the base effect from last year’s sharp energy price falls. The central bank anticipates inflation will decline closer to its target in the second half of 2025.
Updated inflation forecasts show headline inflation averaging 2.5% in 2024, 2.2% in 2025, and hitting 1.9% by 2026. Core inflation is projected to fall from 2.9% in 2024 to 2.3% in 2025, and eventually reach 2.0% in 2026.
On the growth front, there was a slight downward adjustment in the outlook. The Eurozone economy is now expected to expand by 0.8% in 2024, with growth improving to 1.3% in 2025 and 1.5% in 2026.
Japan's wholesale price growth slows sharply to 2.5% yoy in Aug as Yen rebounds
Japan's corporate goods price index decelerated to 2.5% yoy in August, falling below market expectations of 2.8% yoy, marking the first slowdown in eight months. The data reflects a cooling in price pressures, which has been reinforced by a significant 7.4% appreciation in Yen during the month.
The stronger Yen drove a steep slowdown in Yen-based import prices, with the annual growth rate dropping sharply from 10.8% yoy in July to just 2.6% yoy in August. This marks a considerable easing in import costs, offering some relief to Japanese businesses relying on foreign goods.
On a month-to-month basis, CGPI fell by -0.2% mom, while import prices measured in yen contracted significantly by -6.1% mom. The sharp fall in import costs suggests that the stronger yen is playing a key role in softening inflationary pressures, especially in the context of global commodity prices.
BoJ's Tamura advocates for gradual rate increase to 1% neutral mark
BoJ board member Naoki Tamura indicated in a speech today that the likelihood of achieving 2% inflation target sustainably is improving. As a result, the central bank needs to gradually raise interest rates to neutral levels.
Tamura estimated Japan's neutral interest rate, or the rate that neither stimulates nor slows down economic activity, to be at least around 1%.
He added, "As such, it's necessary to push up our short-term policy rate at least to around 1% by the latter half of the fiscal year ending March 2026 to sustainably achieve the BoJ's price goal."
In light of growing labor shortages and rising wage pressures, Tamura warned that inflation risks were increasing. Companies are responding to tight labor market conditions by raising wages and passing on higher costs through price hikes.
Tamura underscored the need to "raise interest rates at an appropriate timing, and in several stages," in order to keep inflation under control.
This marked the first time a BoJ policymaker had publicly specified a target level for raising short-term interest rates.
EUR/USD Mid-Day Outlook
Daily Pivots: (S1) 1.0991; (P) 1.1023; (R1) 1.1044; More....
Intraday bias in EUR/USD stays neutral despite current mild recovery. Focus stays on 38.2% retracement of 1.0665 to 1.1200 at 1.0996. Strong rebound from there will retain near term bullishness. Break of 1.1153 will indicate that larger rally is resuming through 1.1200 resistance to 1.1274 high. However, sustained break of 1.0996 will indicate reversal and turn bias to the downside for 1.0947 resistance turned support next.
In the bigger picture, prior break of 1.1138 resistance indicates that corrective pattern from 1.1274 might have completed at 1.0665 already. Decisive break of 1.1274 (2023 high) will confirm whole up trend from 0.9534 (2022 low). Next target will be 61.8% projection of 0.9534 to 1.1274 from 1.0665 at 1.1740. This will now be the favored case as long as 1.0947 resistance turned support holds.
Economic Indicators Update
| GMT | CCY | EVENTS | ACT | F/C | PP | REV |
|---|---|---|---|---|---|---|
| 23:01 | GBP | RICS Housing Price Balance Aug | 1.00% | -14% | -19% | -18% |
| 23:50 | JPY | BSI Large Manufacturing Index Q3 | 4.5 | -2.5 | -1 | |
| 23:50 | JPY | PPI Y/Y Aug | 2.50% | 2.80% | 3.00% | |
| 01:00 | AUD | Consumer Inflation Expectations Sep | 4.40% | 4.50% | ||
| 12:15 | EUR | ECB Main Refinancing Rate | 3.65% | 3.65% | 4.25% | |
| 12:15 | EUR | ECB Deposit Rate | 3.50% | 3.50% | 3.75% | |
| 12:30 | CAD | Building Permits M/M Jul | 22.10% | 6.50% | -13.90% | |
| 12:30 | USD | PPI M/M Aug | 0.20% | 0.20% | 0.10% | 0.00% |
| 12:30 | USD | PPI Y/Y Aug | 1.70% | 1.80% | 2.20% | 2.10% |
| 12:30 | USD | PPI Core M/M Aug | 0.30% | 0.20% | 0.00% | |
| 12:30 | USD | PPI Core Y/Y Aug | 2.40% | 2.50% | 2.40% | |
| 12:30 | USD | Initial Jobless Claims (Sep 6) | 230K | 231K | 227K | 228k |
| 12:45 | EUR | ECB Press Conference | ||||
| 14:30 | USD | Natural Gas Storage | 49B | 13B |
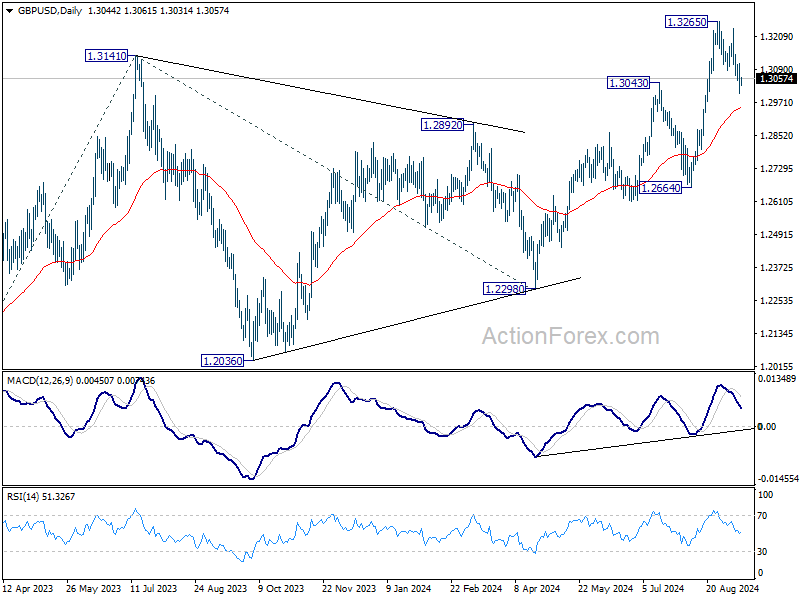
GBP/USD Mid-Day Outlook
Daily Pivots: (S1) 1.2993; (P) 1.3052; (R1) 1.3103; More...
Intraday bias in GBP/USD stays mildly on the downside at hits point. Fall from 1.3265 short term top is in progress for 55 D EMA (now at 1.2949). Sustained break there will bring deeper fall to 1.2664 key support. On the upside, above 1.3111 minor resistance will turn intraday bias neutral first. But risk of another pull back remains as long as 1.3265 resistance holds.
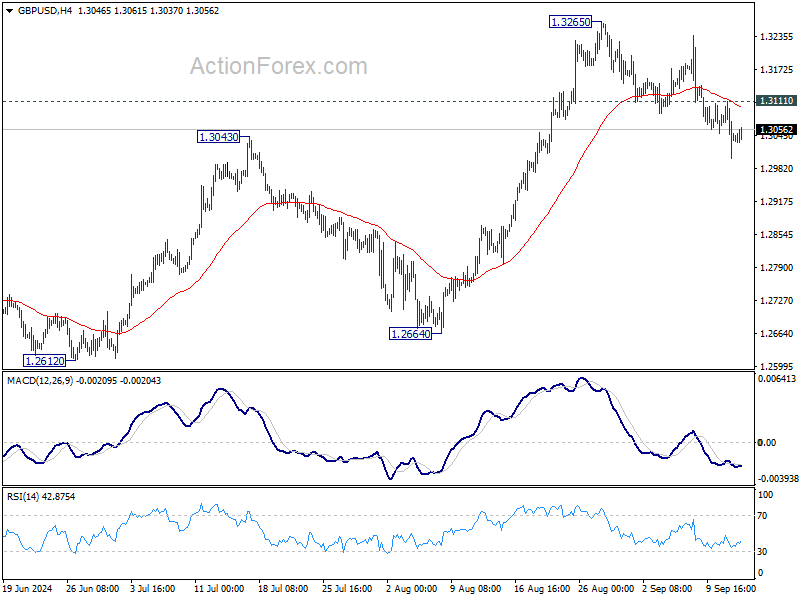
In the bigger picture, up trend from 1.0351 (2022 low) is in progress. Next target is 38.2% projection of 1.0351 to 1.3141 from 1.2298 at 1.3364. For now, outlook will stay bullish as long as 1.2664 support holds, even in case of deep pullback.
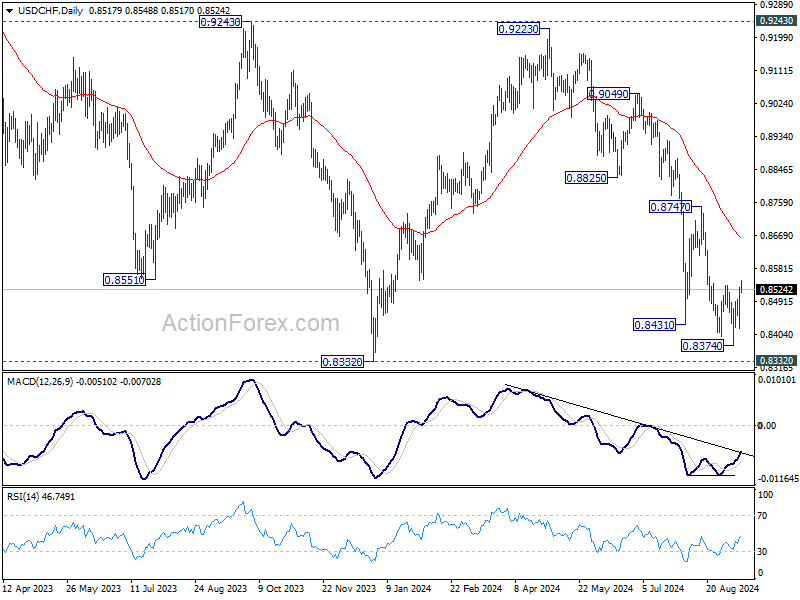
USD/CHF Mid-Day Outlook
Daily Pivots: (S1) 0.8453; (P) 0.8491; (R1) 0.8561; More…
Focus remains on 0.8536 resistance in USD/CHF. Rejection by this resistance will retain near term bearishness. Break of 0.8374 will resume the fall from 0.9223 to retest 0.8332 low. Decisive break there will indicate larger down trend resumption. However, considering bullish convergence condition in 4H MACD, break of 0.8536 resistance will now confirm short term bottoming, and turn bias back to the upside for 0.8747 resistance.
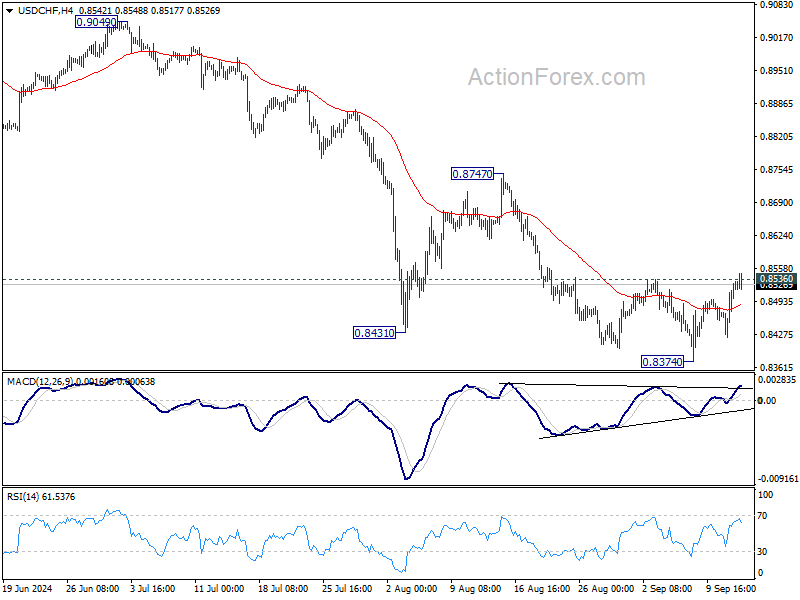
In the bigger picture, price actions from 0.8332 (2023 low) are currently seen as a medium term corrective pattern, with fall from 0.9223 as the second leg. Strong support could be seen from 0.8332 to bring rebound. Yet, overall outlook will continue to stay bearish as long as 0.9243 resistance holds. Firm break of 0.8332, however, will resume larger down trend from 1.0146 (2022 high).
USD/JPY Mid-Day Outlook
Daily Pivots: (S1) 141.20; (P) 141.87; (R1) 143.04; More...
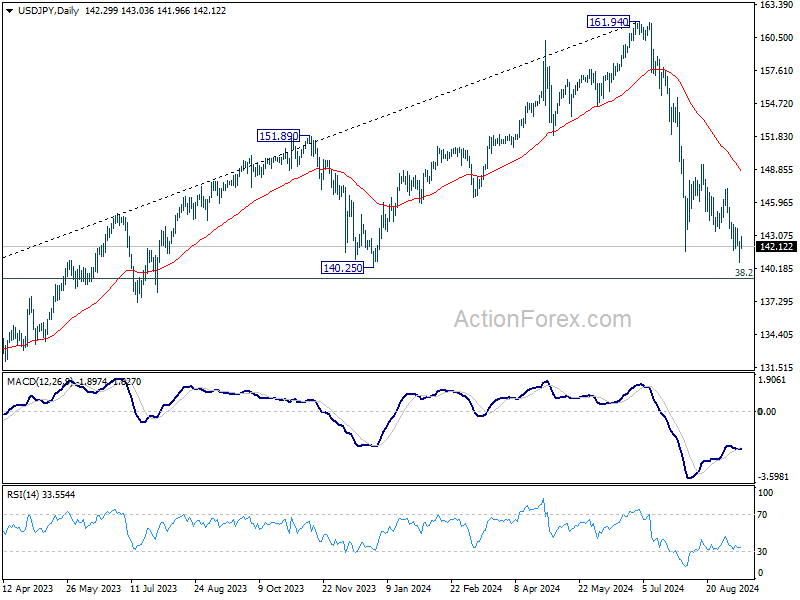
USD/JPY is staying in consolidation above 140.70 temporary low and intraday bias remains neutral at this point. Outlook will remain bearish as long as 147.20 resistance holds. On the downside, break of 140.70 will resume the fall from 161.94 to 140.25 support, and possibly to 139.26 fibonacci level too.
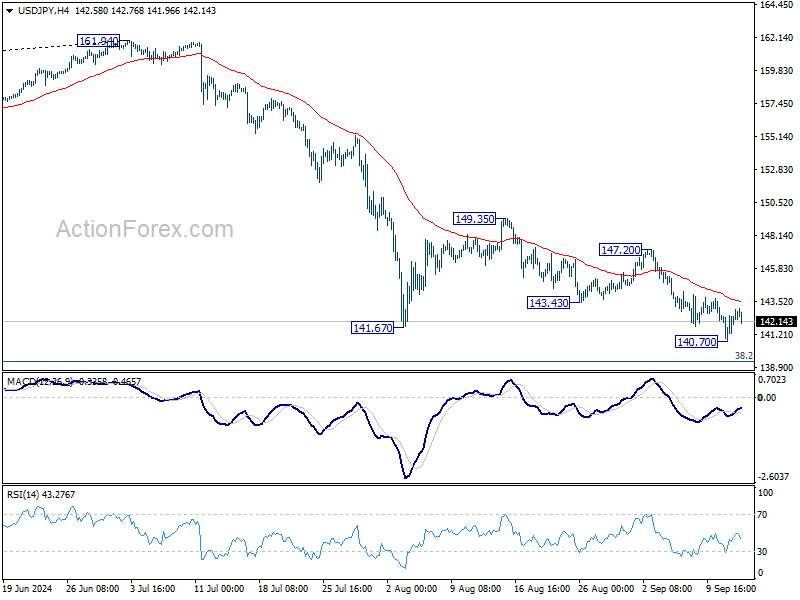
In the bigger picture, fall from 161.94 medium term top is seen as correcting whole up trend from 102.58 (2021 low). Deeper decline could be seen to 38.2% retracement of 102.58 to 161.94 at 139.26, which is close to 140.25 support. Strong support could be seen there to bring rebound. But in any case, risk will stay on the downside as long as 55 W EMA (now at 148.93) holds. Sustained break of 139.26 would open up deeper medium term decline to 61.8% retracement at 125.25.
US PPI up 0.2% mom, 1.7% yoy in Aug
US PPI rose 0.2% mom in August, matched expectations. PPI services rose 0.4% mom while PPI goods was unchanged. PPI less foods, energy, and trade services rose 0.3% mom.
For the 12 month period, PPI advanced 1.7% yoy, slowed from 2.1% yoy. PPI less foods, energy and trade services moved up 3.3% yoy.
US initial jobless claims rises slightly to 230k
US initial jobless claims rose 2k to 230k in the week ending September 7, slightly below expectation of 231k. Four-week moving average of initial claims rose 500 to 231k.
Continuing claims rose 5k to 1850k in the week ending August 31. Four-week moving average of continuing claims fell -2k to 1853k.
ECB cuts deposit rate by 25bps to 3.75%
ECB followed expectations by lowering the deposit rate by 25 bps to 3.75%. The main refinancing rate was adjusted to 3.65%, as the spread between the two rates is now set at 15 bps. Moving forward, the ECB emphasized its commitment to a "data-dependent" and "meeting-by-meeting" approach, avoiding any pre-commitment to a specific rate path.
In its accompanying statement, ECB highlighted that recent inflation data had been largely in line with projections. Inflation is expected to rise again towards the end of the year, primarily due to the base effect from last year’s sharp energy price falls. The central bank anticipates inflation will decline closer to its target in the second half of 2025.
Updated inflation forecasts show headline inflation averaging 2.5% in 2024, 2.2% in 2025, and hitting 1.9% by 2026. Core inflation is projected to fall from 2.9% in 2024 to 2.3% in 2025, and eventually reach 2.0% in 2026.
On the growth front, there was a slight downward adjustment in the outlook. The Eurozone economy is now expected to expand by 0.8% in 2024, with growth improving to 1.3% in 2025 and 1.5% in 2026.
(ECB) Monetary policy decisions
The Governing Council today decided to lower the deposit facility rate – the rate through which it steers the monetary policy stance – by 25 basis points. Based on the Governing Council’s updated assessment of the inflation outlook, the dynamics of underlying inflation and the strength of monetary policy transmission, it is now appropriate to take another step in moderating the degree of monetary policy restriction.
Recent inflation data have come in broadly as expected, and the latest ECB staff projections confirm the previous inflation outlook. Staff see headline inflation averaging 2.5% in 2024, 2.2% in 2025 and 1.9% in 2026, as in the June projections. Inflation is expected to rise again in the latter part of this year, partly because previous sharp falls in energy prices will drop out of the annual rates. Inflation should then decline towards our target over the second half of next year. For core inflation, the projections for 2024 and 2025 have been revised up slightly, as services inflation has been higher than expected. At the same time, staff continue to expect a rapid decline in core inflation, from 2.9% this year to 2.3% in 2025 and 2.0% in 2026.
Domestic inflation remains high as wages are still rising at an elevated pace. However, labour cost pressures are moderating, and profits are partially buffering the impact of higher wages on inflation. Financing conditions remain restrictive, and economic activity is still subdued, reflecting weak private consumption and investment. Staff project that the economy will grow by 0.8% in 2024, rising to 1.3% in 2025 and 1.5% in 2026. This is a slight downward revision compared with the June projections, mainly owing to a weaker contribution from domestic demand over the next few quarters.
The Governing Council is determined to ensure that inflation returns to its 2% medium-term target in a timely manner. It will keep policy rates sufficiently restrictive for as long as necessary to achieve this aim. The Governing Council will continue to follow a data-dependent and meeting-by-meeting approach to determining the appropriate level and duration of restriction. In particular, its interest rate decisions will be based on its assessment of the inflation outlook in light of the incoming economic and financial data, the dynamics of underlying inflation and the strength of monetary policy transmission. The Governing Council is not pre-committing to a particular rate path.
As announced on 13 March 2024, some changes to the operational framework for implementing monetary policy will take effect from 18 September. In particular, the spread between the interest rate on the main refinancing operations and the deposit facility rate will be set at 15 basis points. The spread between the rate on the marginal lending facility and the rate on the main refinancing operations will remain unchanged at 25 basis points.
Key ECB interest rates
The Governing Council decided to lower the deposit facility rate by 25 basis points. The deposit facility rate is the rate through which the Governing Council steers the monetary policy stance. In addition, as announced on 13 March 2024 following the operational framework review, the spread between the interest rate on the main refinancing operations and the deposit facility rate will be set at 15 basis points. The spread between the rate on the marginal lending facility and the rate on the main refinancing operations will remain unchanged at 25 basis points. Accordingly, the deposit facility rate will be decreased to 3.50%. The interest rates on the main refinancing operations and the marginal lending facility will be decreased to 3.65% and 3.90% respectively. The changes will take effect from 18 September 2024.
Asset purchase programme (APP) and pandemic emergency purchase programme (PEPP)
The APP portfolio is declining at a measured and predictable pace, as the Eurosystem no longer reinvests the principal payments from maturing securities.
The Eurosystem no longer reinvests all of the principal payments from maturing securities purchased under the PEPP, reducing the PEPP portfolio by €7.5 billion per month on average. The Governing Council intends to discontinue reinvestments under the PEPP at the end of 2024.
The Governing Council will continue applying flexibility in reinvesting redemptions coming due in the PEPP portfolio, with a view to countering risks to the monetary policy transmission mechanism related to the pandemic.
Refinancing operations
As banks are repaying the amounts borrowed under the targeted longer-term refinancing operations, the Governing Council will regularly assess how targeted lending operations and their ongoing repayment are contributing to its monetary policy stance.
***
The Governing Council stands ready to adjust all of its instruments within its mandate to ensure that inflation returns to its 2% target over the medium term and to preserve the smooth functioning of monetary policy transmission. Moreover, the Transmission Protection Instrument is available to counter unwarranted, disorderly market dynamics that pose a serious threat to the transmission of monetary policy across all euro area countries, thus allowing the Governing Council to more effectively deliver on its price stability mandate.
The President of the ECB will comment on the considerations underlying these decisions at a press conference starting at 14:45 CET today.