Sample Category Title
ECB Meets as Fed Doves Wave Goodbye to Jumbo Cut
The latest US CPI data, and the reaction to data was mixed on Wednesday. The good news is that the headline inflation fell from 2.9% to 2.5% in August, and sank significantly below the 3% level where it was resisting since last summer. The drop in food and energy prices helped easing pressure in the headline figure. But core inflation – which excludes volatile food and energy prices – came in line with the expectations on a yearly basis, and slightly higher-than-expected on a monthly basis. Cost of housing and travel were responsible for the stickiness in core inflation.
While the retreat in food prices is the continuation of the post-pandemic supply chain improvement story, and easing in energy prices is due to global geopolitical and economic factors, the stickiness in housing remains an issue that the Federal Reserve (Fed) must address with its rate policy. Therefore, yesterday’s data came to wave goodbye to the 50bp cut hopes at next week’s FOMC meeting. The probability of a 50bp cut melted to 13%, pulling the probability of a 100bp cut this year down with it.
The US yields fell and the US dollar rebounded. Equities first slid on moodiness that the Fed would cut less than projected before the CPI data release then rebounded on optimism that if the Fed cuts less it’s because economy is doing relatively fine. The S&P500 gained 1% and closed the session above its 50-DMA. The Dow Jones and the Russell 2000 gained around 0.30%. Technology stocks led gains leading to a more than 2% jump in Nasdaq 100, but the energy sector remained under pressure despite a rebound in oil prices after Hurricane Francine ran over key oil production zones in the Gulf of Mexico - that produces around 15-17% of the US total production - and where oil producers had to shut around 25% of their operations.
But we know that it will take more than a hurricane or a war in the Middle East to push oil prices sustainably higher in the foreseeable future. The demand concerns are growing, OPEC turns cautious, and Citi goes a step further, stating that 'there’s no room for any more barrels' in the market. They argue that not only should the cartel avoid increasing production, but it must also cut an additional one million barrels per day throughout 2025 to balance the market."
Nvidia’s has another problem
High demand... Nvidia’s CEO Jensen Huang said yesterday that the demand for its advanced chips is ‘so great’ that customers are frustrated if they don’t get their chips fast enough. ‘Everyone wants to be first and everyone wants to be most’ he said – first-world problems. His words gave a boost to Nvidia, and the stock rallied more than 8% yesterday, defying the AI fatigue. VanEck’s semiconductor ETF jumped more than 5%.
EUR/USD tests 1.1000 ahead of ECB decision
The US dollar jumped and extended gains in Asia this morning. The USDJPY rebounded after having tested the 140 waters, Cable flirted with the 1.30 support – as British growth stagnated for the second month in a row, and the EURUSD tested the 1.10 level.
The European Central Bank (ECB) will meet and most likely deliver its second 25bp cut later today. A 25bp cut is fully baked in the market prices, but there is room to act on what comes next. The Eurozone economies have been slowing, Germany is having hard time keeping its head above water, the right-wing parties are surging (even in Germany and France), no one sees the end of the tunnel in the Ukrainian war, and even China is not there to help the European luxury brands afloat.
In this gloomy context, some ECB members will be tempted to cut more than the 50bp baked in the market prices for this year, but some members will remain cautious pointing at the risk of inflation uptick. Therefore, Lagarde’s post-meeting presser will show the direction the euro will take from here. If Lagarde sounds like she and her colleagues remain concerned about the inflation risks, the EURUSD could find support near the 1.10 level and make another attempt on the 1.12 in the coming weeks. But if she shows growing concerns about the gloomy economic outlook, it will be the right time and the right reason for the EURUSD to return below the 1.10 mark. The economic and political setup have the potential to tilt expectations toward a series of three 25bp cuts starting from today. The latter would require a dovish adjustment to ECB expectations and the euro’s valuation.
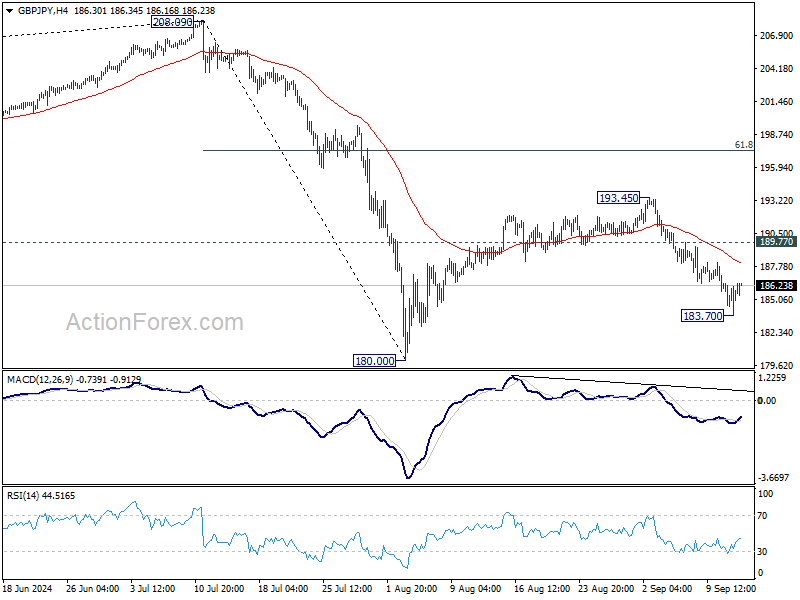
GBP/JPY Daily Outlook
Daily Pivots: (S1) 184.10; (P) 185.29; (R1) 186.86; More...
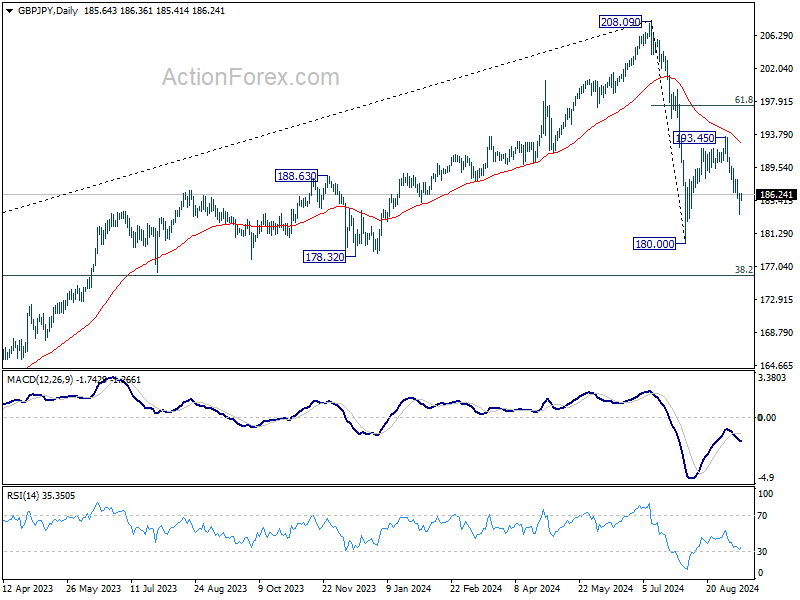
Intraday bias in GBP/JPY is turned neutral with current recovery.. But further decline is expected as long as 189.77 resistance holds. Below 183.70 will bring retest of 180.00 low. Break there will resume whole fall from 208.09 to 175.94 fibonacci level.
In the bigger picture, price actions from 208.09 are seen as a correction to whole rally from 123.94 (2020 low). The range of consolidation should be set between 38.2% retracement of 123.94 to 208.09 at 175.94 and 208.09. However, decisive break of 175.94 will argue that deeper correction is underway.
EUR/JPY Daily Outlook
Daily Pivots: (S1) 155.78; (P) 156.43; (R1) 157.41; More....
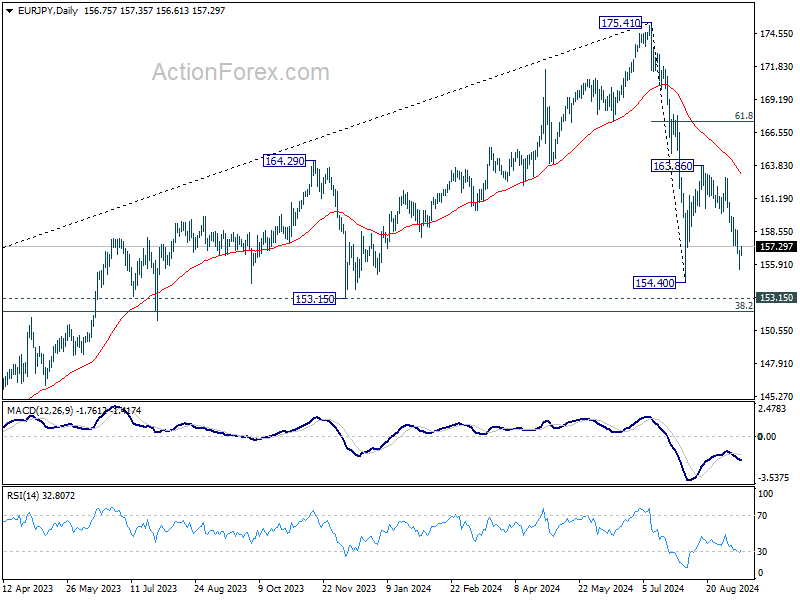
Intraday bias in EUR/JPY is turned neutral again with current recovery. But further decline is expected as long as 160.01 support turned resistance holds. Below 155.45 will bring retest of 154.40 low. Firm break there will resume whole decline from 175.41 to 153.15 support.
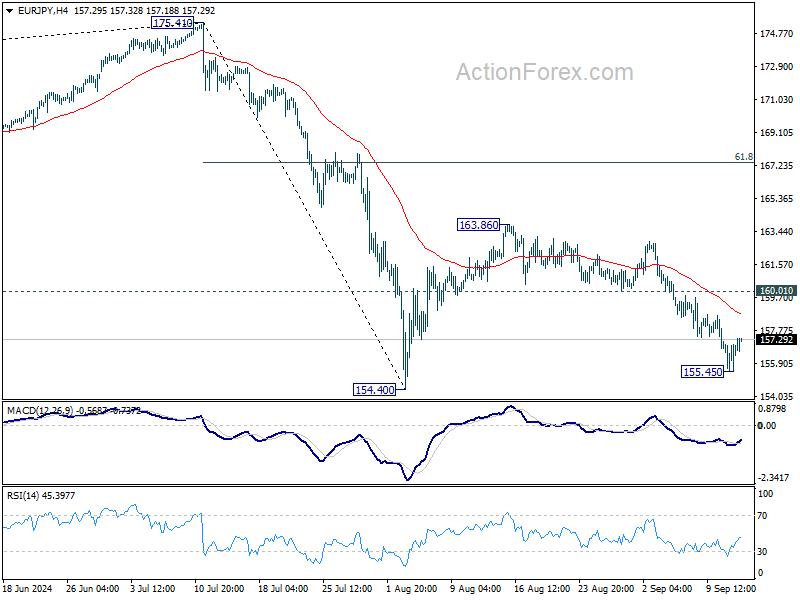
In the bigger picture, price actions from 175.41 are seen as correction to rally from 114.42 (2020 low). The range of consolidation should have been set between 38.2% retracement of 114.42 to 175.41 at 152.11 and 175.41 high. However, decisive break of 152.11 would argue that deeper correction is underway.
EUR/GBP Daily Outlook
Daily Pivots: (S1) 0.8421; (P) 0.8443; (R1) 0.8463; More...
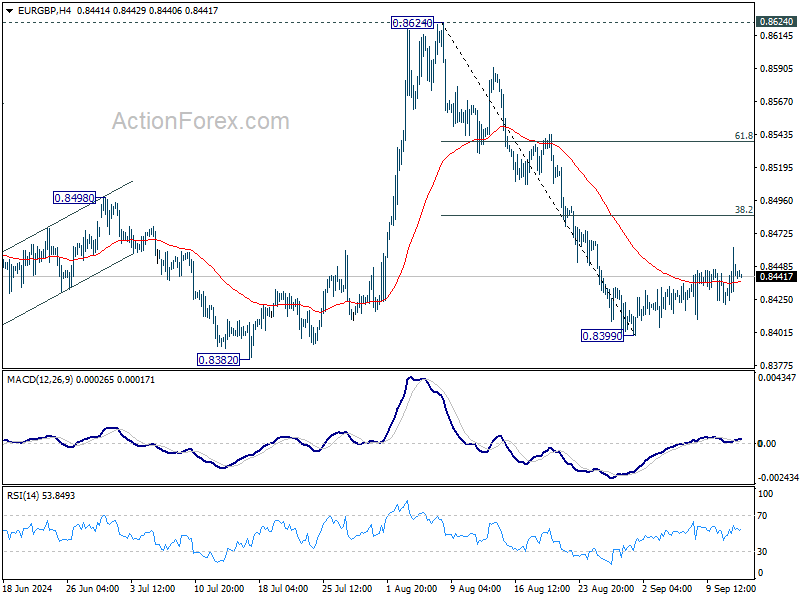
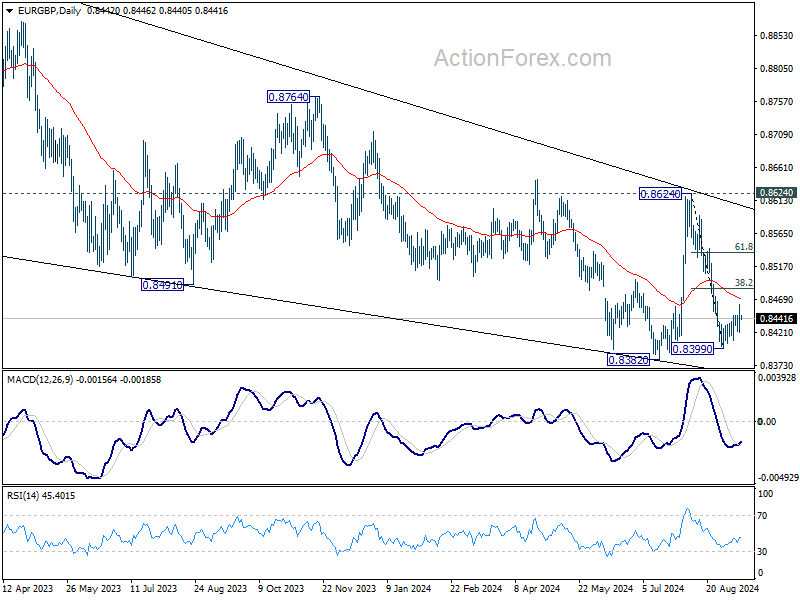
Intraday bias in EUR/GBP remains neutral as consolidation from 0.8399 short term bottom is extending. Stronger recovery might be seen but upside should be limited by 38.2% retracement of 0.8624 to 0.8399 at 0.8485. Break of 0.8399 will bring retest of 0.8382 low. Firm break there will resume larger down trend. However, sustained break of 0.8485 will bring stronger rally to 61.8% retracement at 0.8538 and possibly above.
In the bigger picture, as long as 0.8624 resistance holds, down trend from 0.9267 is expected to continue. Firm break of 0.8382 will target 0.8201 (2022 low). However, decisive break of 0.8624 will indicate that such down trend has completed, and turn outlook bullish for 0.8764 resistance next.
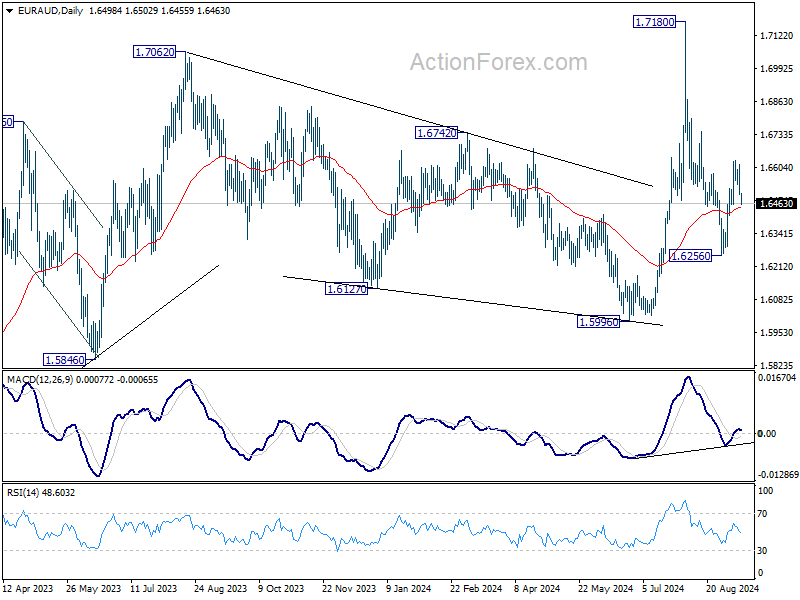
EUR/AUD Daily Outlook
Daily Pivots: (S1) 1.6459; (P) 1.6539; (R1) 1.6579; More...
Intraday bias in EUR/AUD is turned neutral with current retreat. Rebound from 1.6256 is still in favor to continue as long as 1.6457 support holds. Above 0.6629 will turn bias back to the downside for retesting 1.7180 high. However, firm break of 1.6457 support will suggest that the rebound has completed already, and turn bias back to the downside for 1.6256 again.
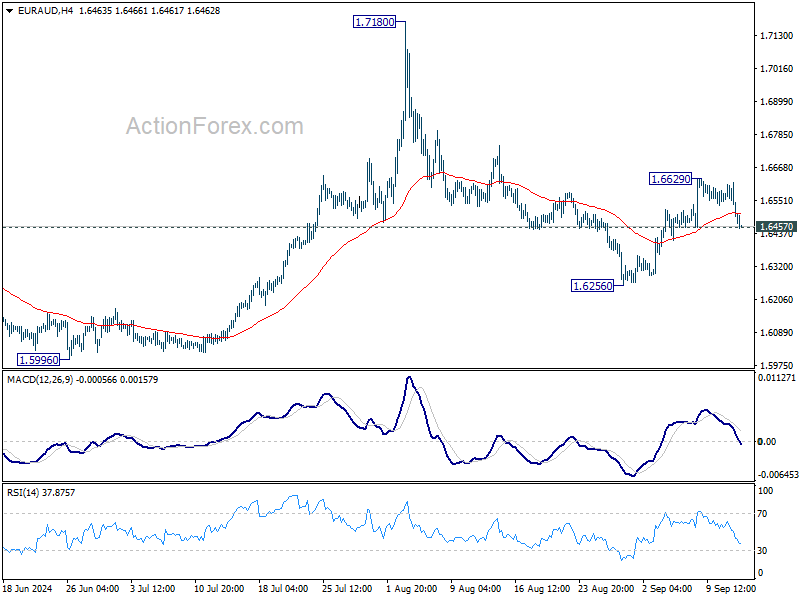
In the bigger picture, outlook is mixed up by the deeper than expected fall from 1.7180. Yet as long as 1.5996 support holds, up trend from 1.4281 (2022 low) is still expected to resume at a later stage. Firm break of 1.7180 will pave the way to 61.8% projection of 1.4281 to 1.7062 from 1.5996 at 1.7715.
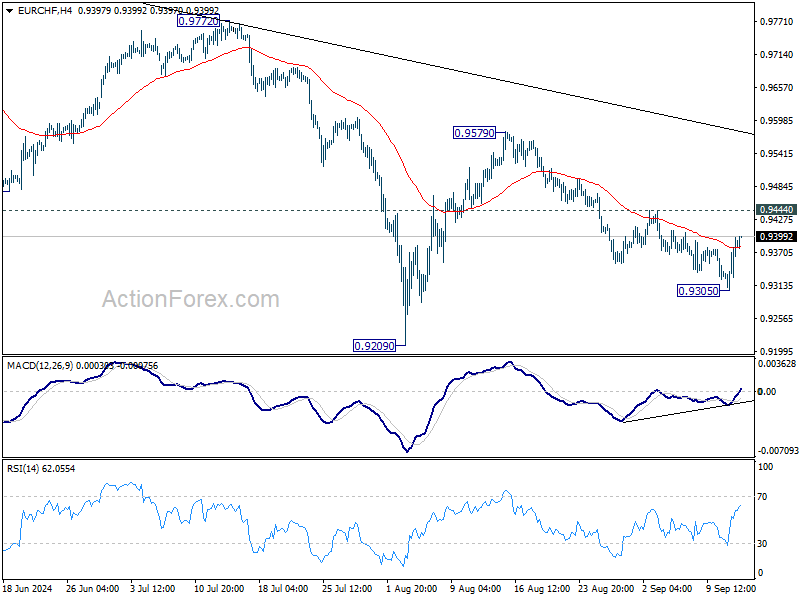
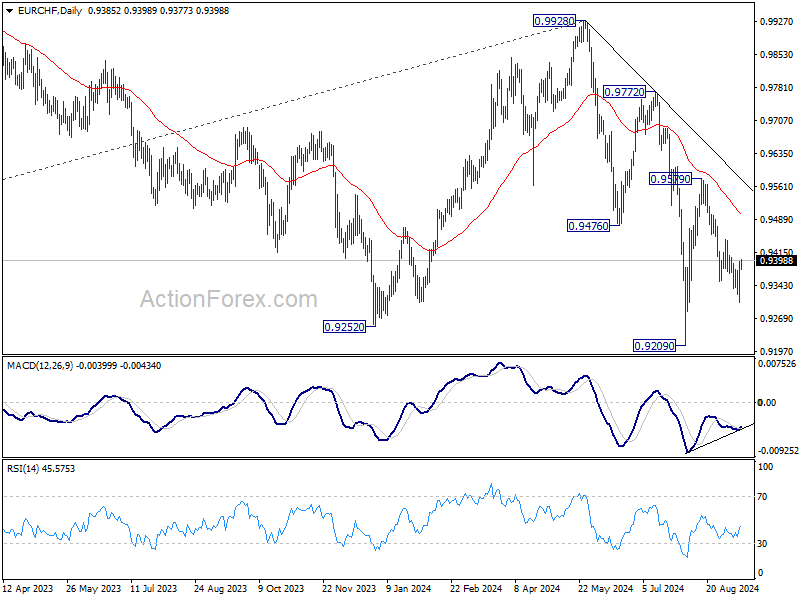
EUR/CHF Daily Outlook
Daily Pivots: (S1) 0.9329; (P) 0.9363; (R1) 0.9419; More....
A temporary low as formed at 0.9305 in EUR/CHF with current recovery and intraday bias is turned neutral for consolidations. Deeper decline is still expected with 0.9444 resistance intact. Below 0.9305 will resume the fall from 0.9579 to retest 0.9209 low. Nevertheless, firm break of 0.9444 will argue that the pull back from 0.9579 has completed as a correction, and bring further rally back to this resistance.
In the bigger picture, medium term corrective pattern from 0.9407 (2022 low) might have completed with three waves to 0.9928. Decisive break of 0.9252 (2023 low) will confirm long term down trend resumption. Next target will be 61.8% projection of 1.1149 to 0.9407 from 0.9928 at 0.8851. For now, outlook will stay bearish as long as 0.9928 resistance holds, even in case of strong rebound.
EUR/USD Daily Outlook
Daily Pivots: (S1) 1.0991; (P) 1.1023; (R1) 1.1044; More....
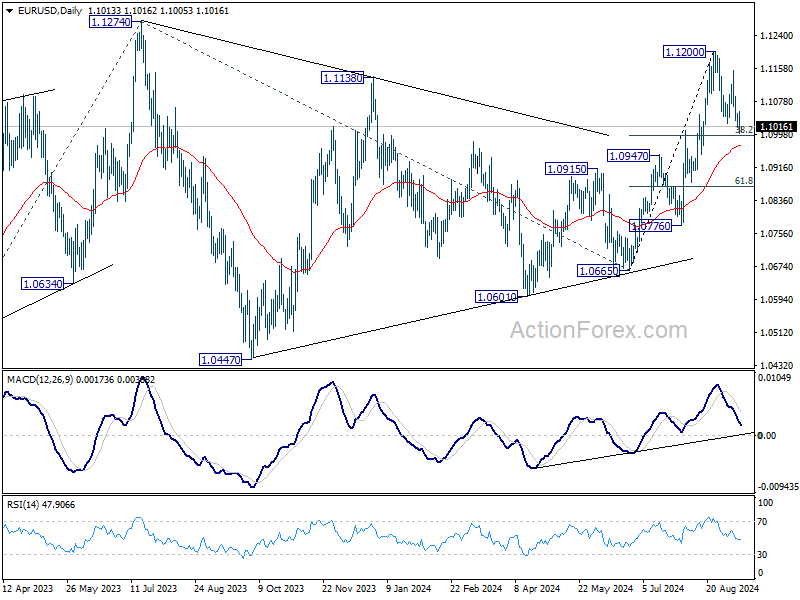
Intraday bias in EUR/USD remains neutral for the moment. Focus stays on 38.2% retracement of 1.0665 to 1.1200 at 1.0996. Strong rebound from there will retain near term bullishness. Break of 1.1153 will indicate that larger rally is resuming through 1.1200 resistance to 1.1274 high. However, sustained break of 1.0996 will indicate reversal and turn bias to the downside for 1.0947 resistance turned support next.
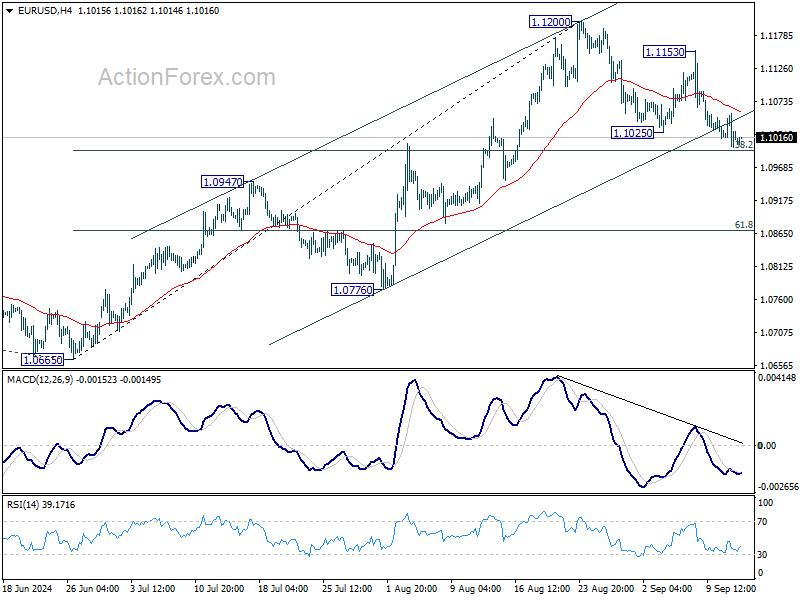
In the bigger picture, prior break of 1.1138 resistance indicates that corrective pattern from 1.1274 might have completed at 1.0665 already. Decisive break of 1.1274 (2023 high) will confirm whole up trend from 0.9534 (2022 low). Next target will be 61.8% projection of 0.9534 to 1.1274 from 1.0665 at 1.1740. This will now be the favored case as long as 1.0947 resistance turned support holds.
GBP/USD Daily Outlook
Daily Pivots: (S1) 1.2993; (P) 1.3052; (R1) 1.3103; More...
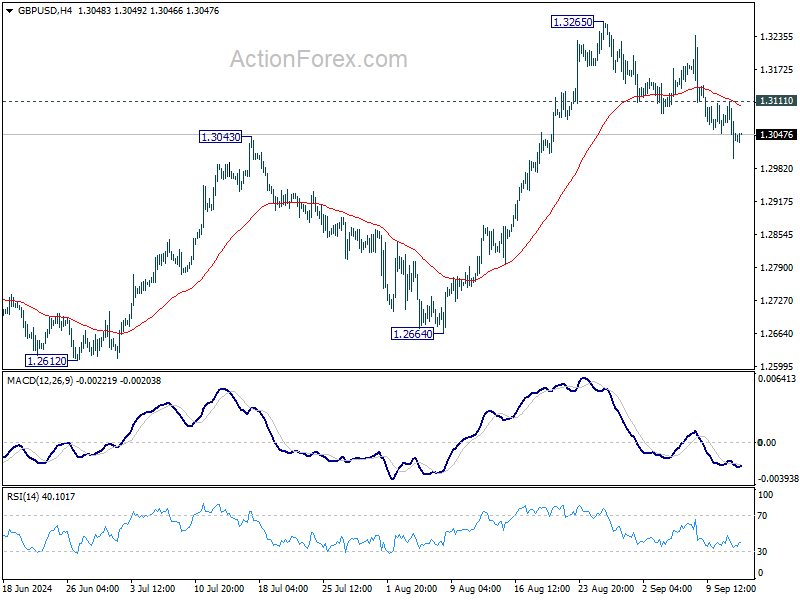
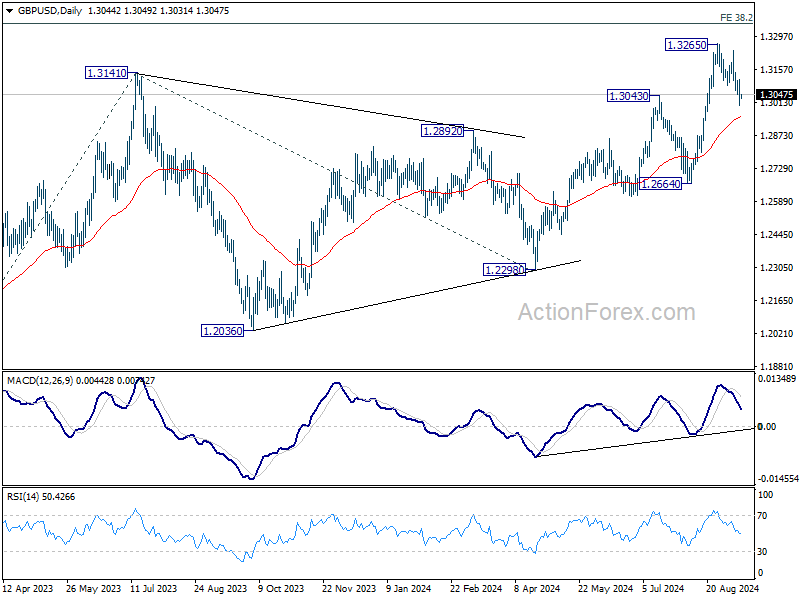
The break of 1.3043 resistance turned support confirms short term topping at 1.3265. Intraday bias in GBP/USD is now on the downside for 55 D EMA (now at 1.2949). Sustained break there will bring deeper fall to 1.2664 key support. On the upside, above 1.3111 minor resistance will turn intraday bias neutral first. But risk of another pull back remains as long as 1.3265 resistance holds.
In the bigger picture, up trend from 1.0351 (2022 low) is in progress. Next target is 38.2% projection of 1.0351 to 1.3141 from 1.2298 at 1.3364. For now, outlook will stay bullish as long as 1.2664 support holds, even in case of deep pullback.
USD/CHF Daily Outlook
Daily Pivots: (S1) 0.8453; (P) 0.8491; (R1) 0.8561; More…
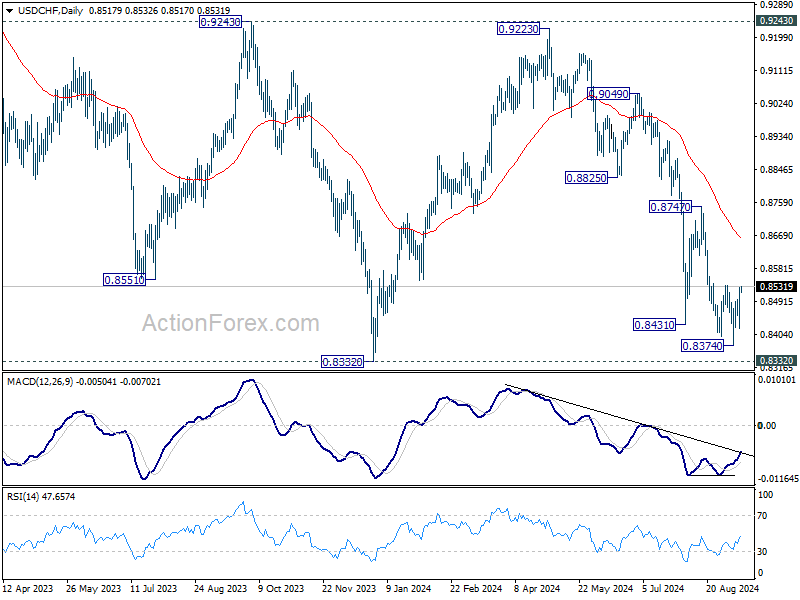
Intraday bias in USD/CHF remains neutral for the moment Rejection by 0.8536 resistance will retain near term bearishness. Break of 0.8374 will resume the fall from 0.9223 to retest 0.8332 low. Decisive break there will indicate larger down trend resumption. However, considering bullish convergence condition in 4H MACD, break of 0.8536 resistance will now confirm short term bottoming, and turn bias back to the upside for 0.8747 resistance.
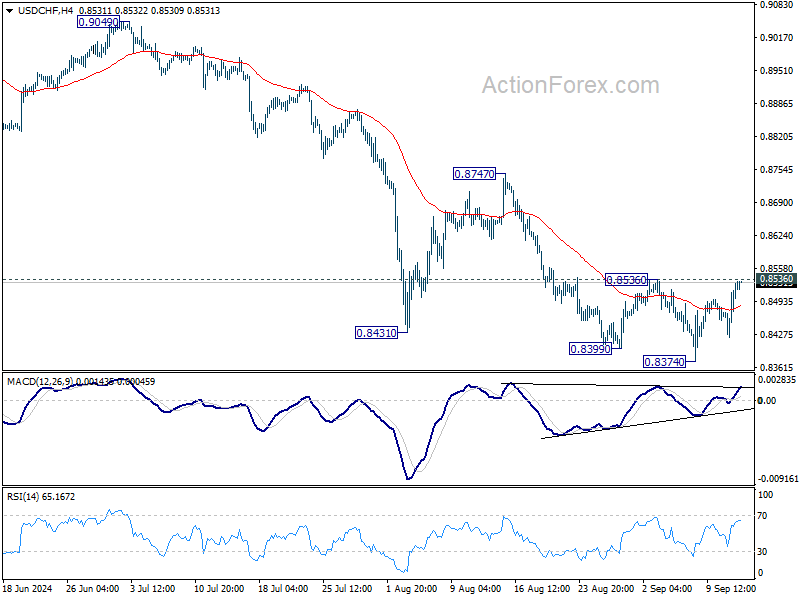
In the bigger picture, price actions from 0.8332 (2023 low) are currently seen as a medium term corrective pattern, with fall from 0.9223 as the second leg. Strong support could be seen from 0.8332 to bring rebound. Yet, overall outlook will continue to stay bearish as long as 0.9243 resistance holds. Firm break of 0.8332, however, will resume larger down trend from 1.0146 (2022 high).
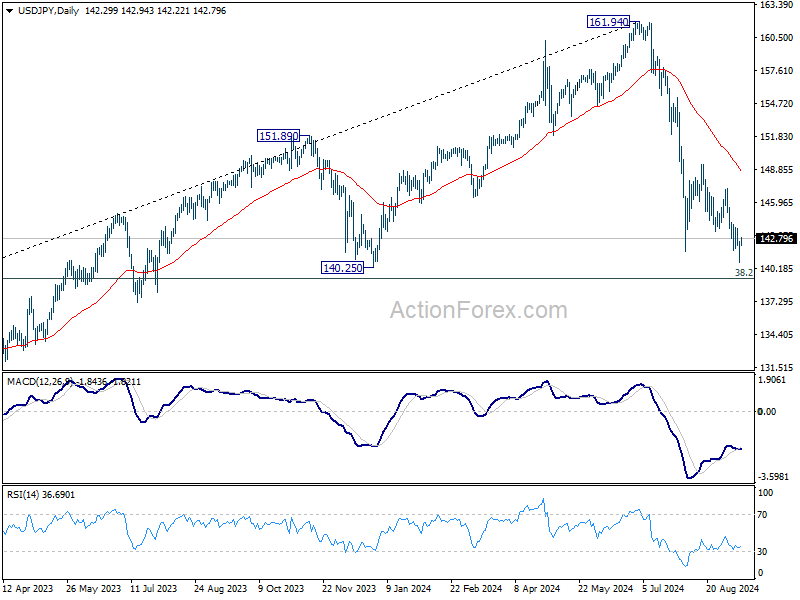
USD/JPY Daily Outlook
Daily Pivots: (S1) 141.20; (P) 141.87; (R1) 143.04; More...
Intraday bias in USD/JPY is turned neutral with current recovery and some consolidations would be seen first. But further decline is expected as long as 147.20 resistance holds. Break of 140.70 will resume the fall from 161.94 to 140.25 support, and possibly to 139.26 fibonacci level too.
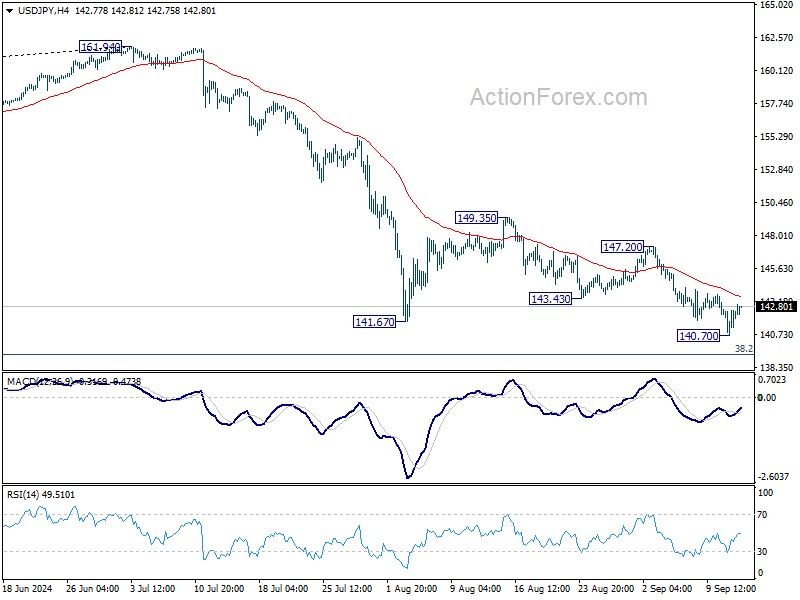
In the bigger picture, fall from 161.94 medium term top is seen as correcting whole up trend from 102.58 (2021 low). Deeper decline could be seen to 38.2% retracement of 102.58 to 161.94 at 139.26, which is close to 140.25 support. Strong support could be seen there to bring rebound. But in any case, risk will stay on the downside as long as 55 W EMA (now at 148.93) holds. Sustained break of 139.26 would open up deeper medium term decline to 61.8% retracement at 125.25.