
Sample Category Title
USD/CHF Daily Outlook
Daily Pivots: (S1) 0.8810; (P) 0.8843; (R1) 0.8860; More…
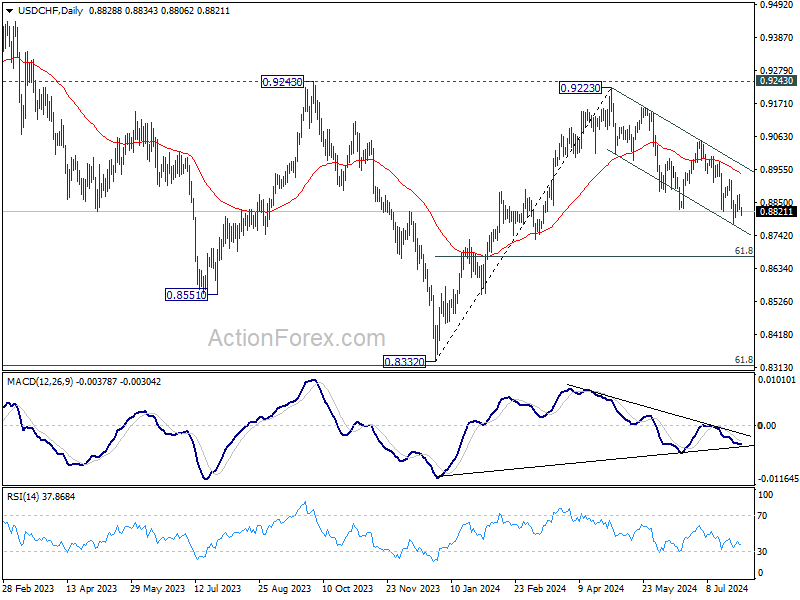
Intraday bias in USD/CHF remains neutral as consolidation from 0.8776 is still in progress. Further decline is expected as long as 0.8923 resistance holds. On the downside, break of 0.8776 will resume the fall from 0.9223 to 61.8% retracement of 0.8332 to 0.9223 at 0.8672 next. However, break of 0.8923 will turn bias back to the upside for stronger rebound instead.
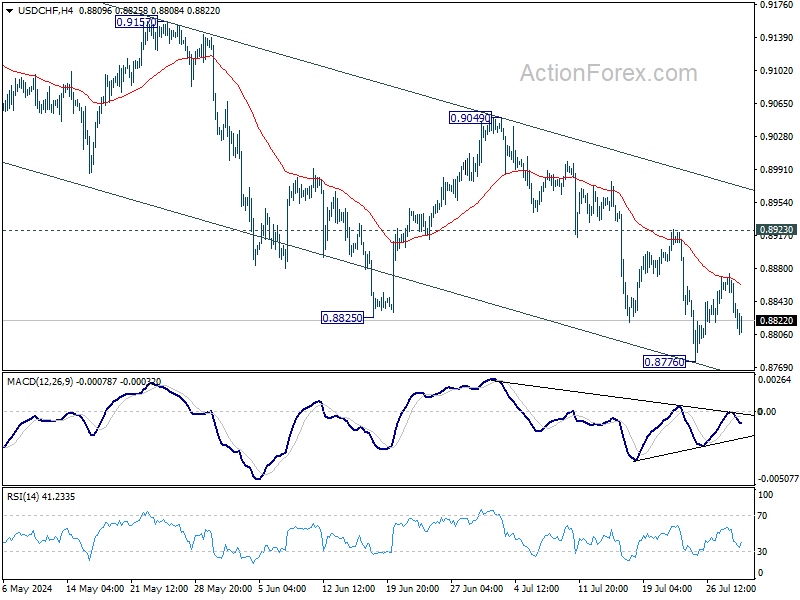
In the bigger picture, with 0.9243 resistance intact, medium term outlook in USD/CHF is neutral at best. For now, more sideway trading is likely between 0.8332/9243. However, firm break of 0.9243 will indicate larger bullish trend reversal.
AUD/USD Daily Report
Daily Pivots: (S1) 0.6523; (P) 0.6543; (R1) 0.6556; More...
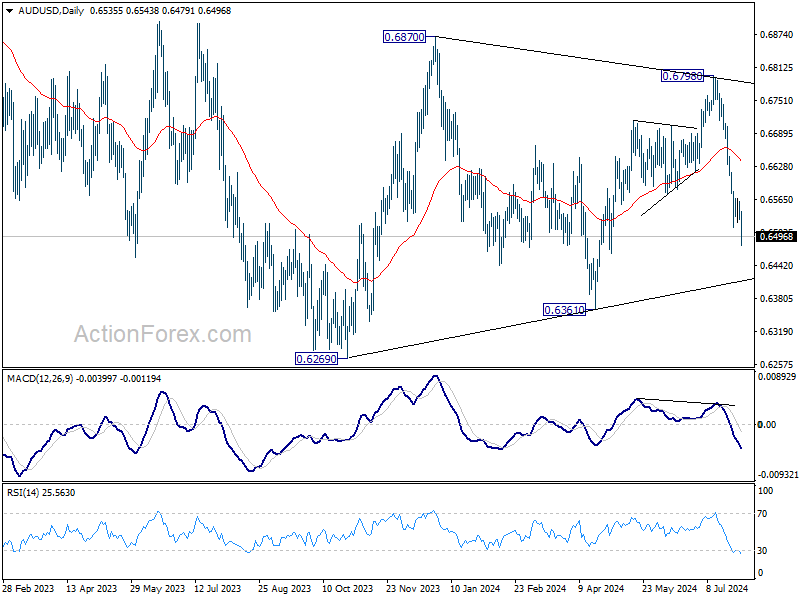
AUD/USD's fall from 0.6798 resumes today and hits as low as 0.6479 so far. Intraday bias is back on the downside for 0.6361 support first. Firm break there will target 0.6269 low. On the upside though, above 0.6567 resistance will turn intraday bias neutral first.
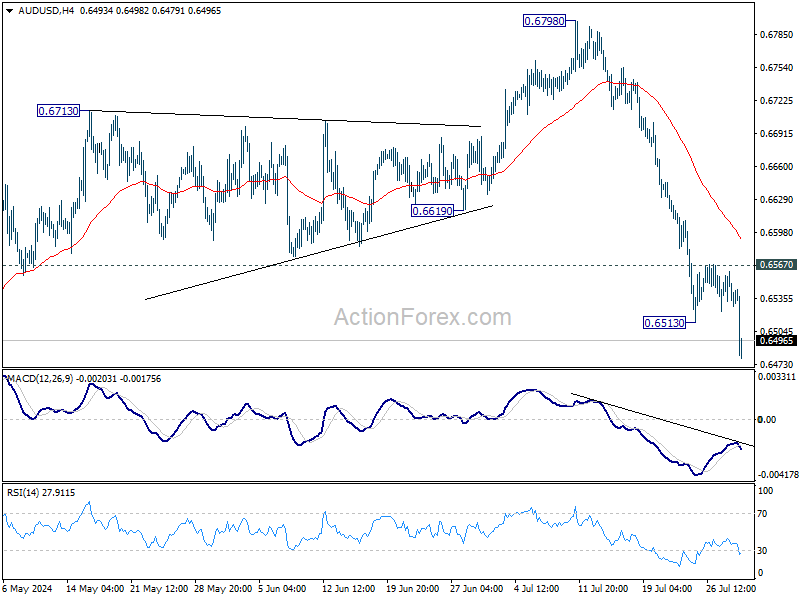
In the bigger picture, overall, price actions from 0.6169 (2022 low) are seen as a medium term corrective pattern, with fall from 0.6798 as another falling leg. Deeper fall could be seen to the lower side of the range between 0.6169/6361. But strong support should be seen there to contain downside. For now, risk will stay on the downside as long as 0.6798 resistance holds, in case of rebound.
USD/CAD Daily Outlook
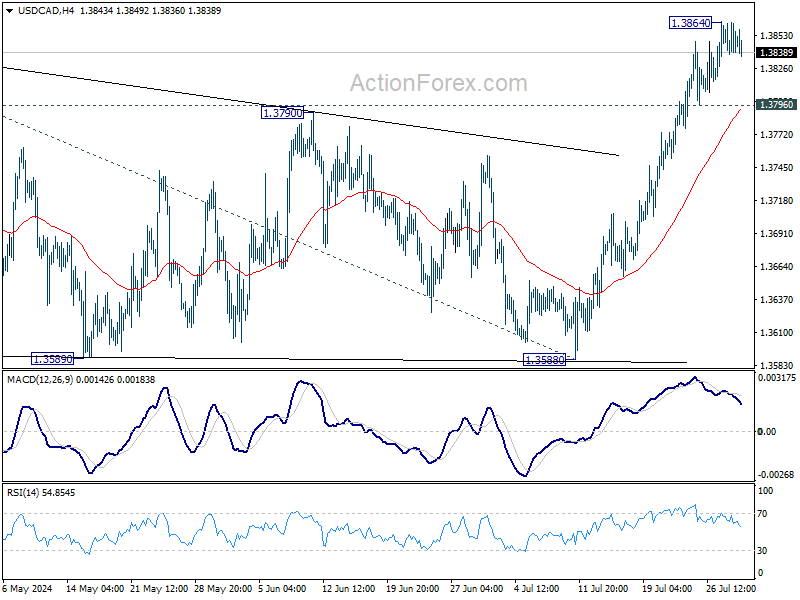
Daily Pivots: (S1) 1.3837; (P) 1.3851; (R1) 1.3864; More...
A temporary top is in place with current retreat and intraday bias in USD/CAD is turned neutral first. Further rally is expected as long as 1.3796 support holds. Rise from 1.3176 should be resuming and next target is 61.8% projection of 1.3176 to 1.3845 from 1.3588 at 1.4025. On the downside, below 1.3796 minor support will delay the bullish case and bring deeper pullback first.
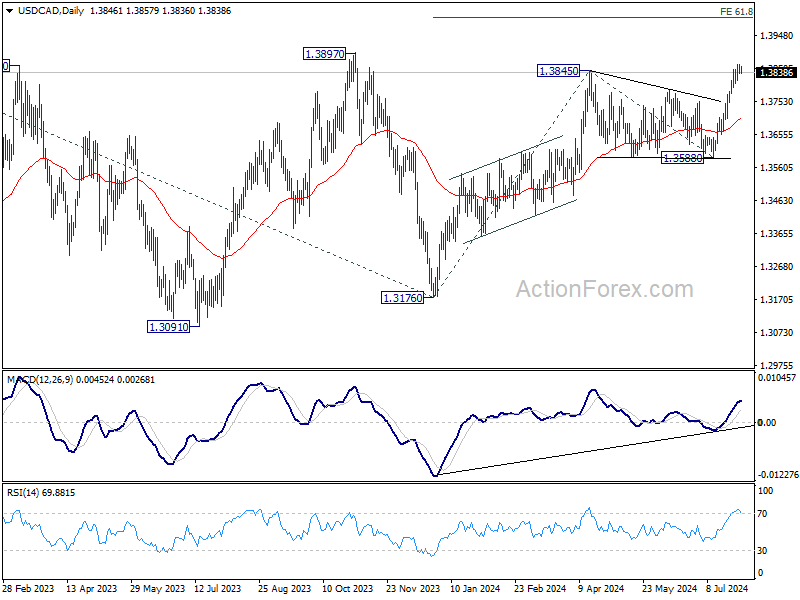
In the bigger picture, price actions from 1.3976 (2022 high) are viewed as a corrective pattern, that might have completed at 1.3176 (2023 low) already. Firm break of 1.3976 will confirm resumption of whole up trend from 1.2005 (2021 low). Next target is 61.8% projection of 1.2401 to 1.3976 from 1.3176 at 1.4149. This will be the favored case as long as 1.3588 support holds, in case of pullback.
EUR/CHF Daily Outlook
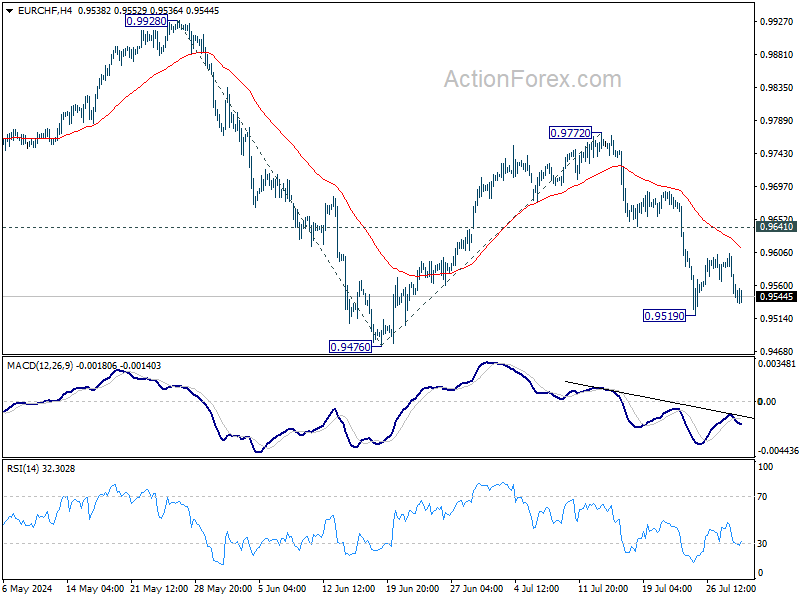
Daily Pivots: (S1) 0.9526; (P) 0.9566; (R1) 0.9587; More....
Intraday bias in EUR/CHF remains neutral and outlook is unchanged. While more consolidations could be seen, further decline is expected as long as 0.9641 support turned resistance holds. Rebound from 0.9476 should have completed as a corrective move at 0.9772. Below 0.9519 will bring retest of 0.9476. Firm break there will resume whole fall from 0.9928 to 100% projection of 0.9928 to 0.94767 from 0.9772 at 0.9320.
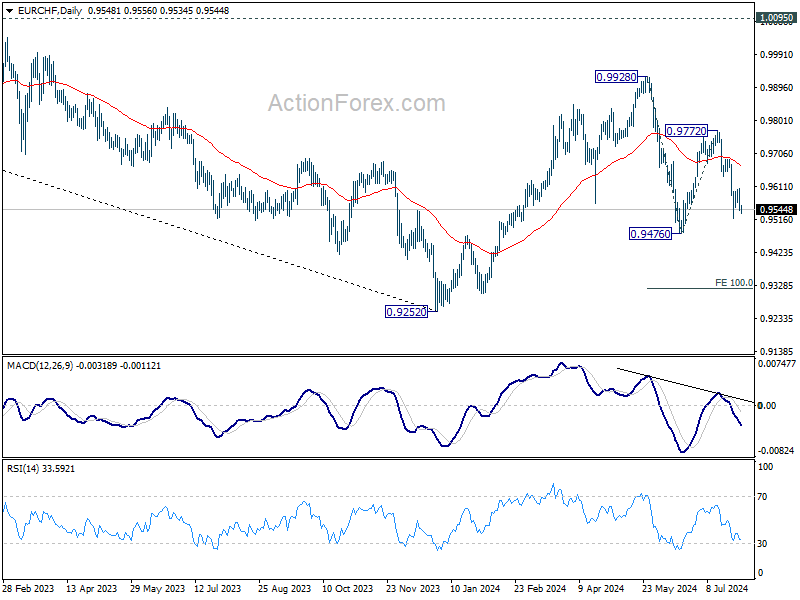
In the bigger picture, with 1.0095 key medium term resistance intact, price actions from 0.9252 (2023 low) are seen as a corrective pattern. Fall from 0.9928 might be the second leg and break of 0.9476 would bring deeper decline to retest 0.9252 low. But strong support should be seen there to extend the corrective pattern with another rising leg. In any case, medium term outlook will be neutral at best as long as 1.0095 structural resistance holds.
EUR/GBP Daily Outlook
Daily Pivots: (S1) 0.8414; (P) 0.8422; (R1) 0.8433; More....
Intraday bias in EUR/GBP stays neutral as consolidation from 0.8382 is still in progress. Outlook continues to stay bearish with 0.8498 resistance intact. Firm break of 0.8382 will resume larger down trend next target will be 138.2% projection of 0.8764 to 0.8497 from 0.8463 at 0.8274.
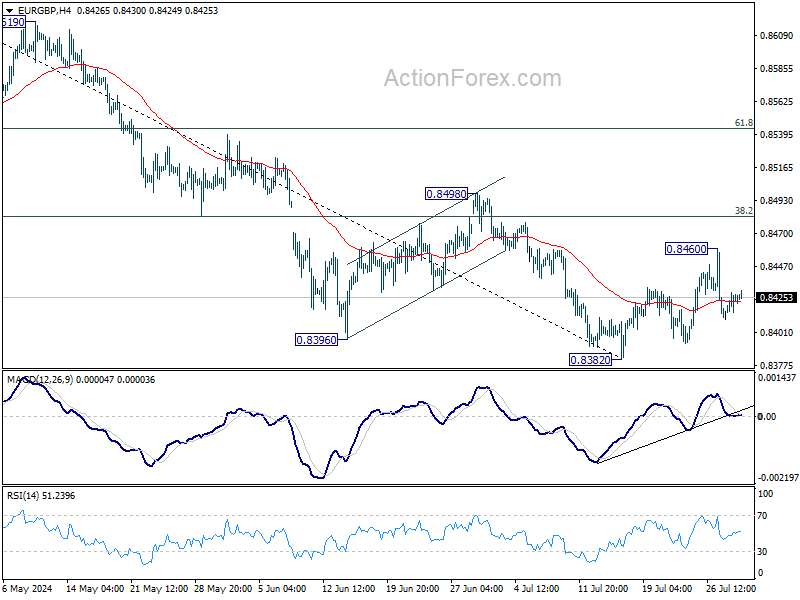
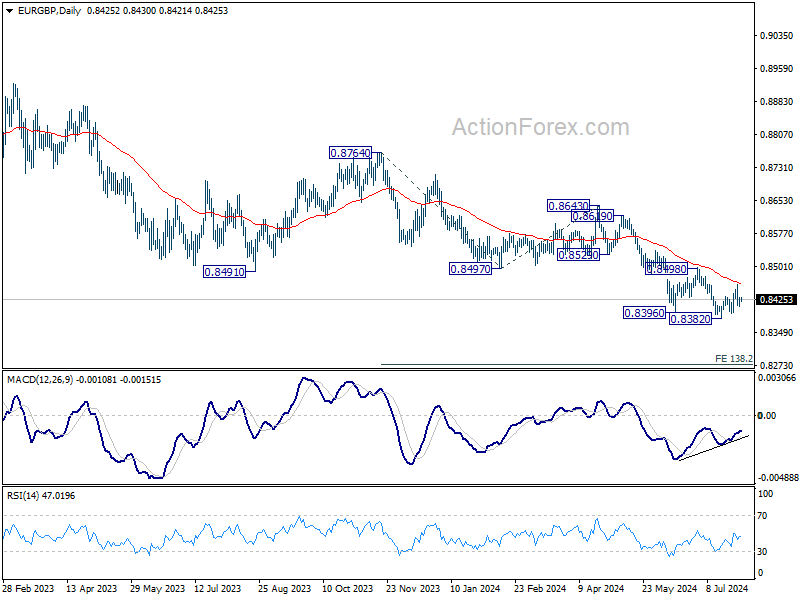
In the bigger picture, down trend from 0.9267 (2022 high) is in progress. Next target is 0.8201 key support (2022 low). For now, outlook will remain bearish as long as 0.8643 resistance holds, even in case of strong rebound.
EUR/AUD Daily Outlook
Daily Pivots: (S1) 1.6502; (P) 1.6535; (R1) 1.6577; More...
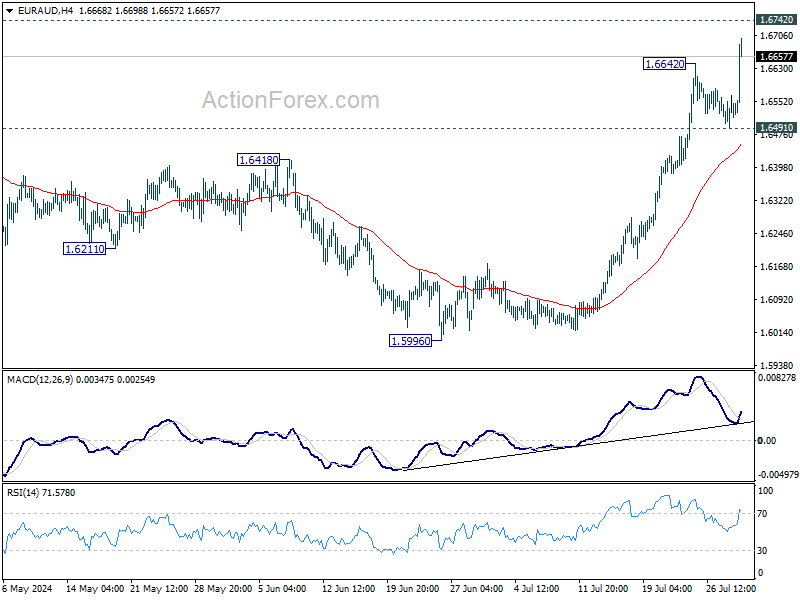
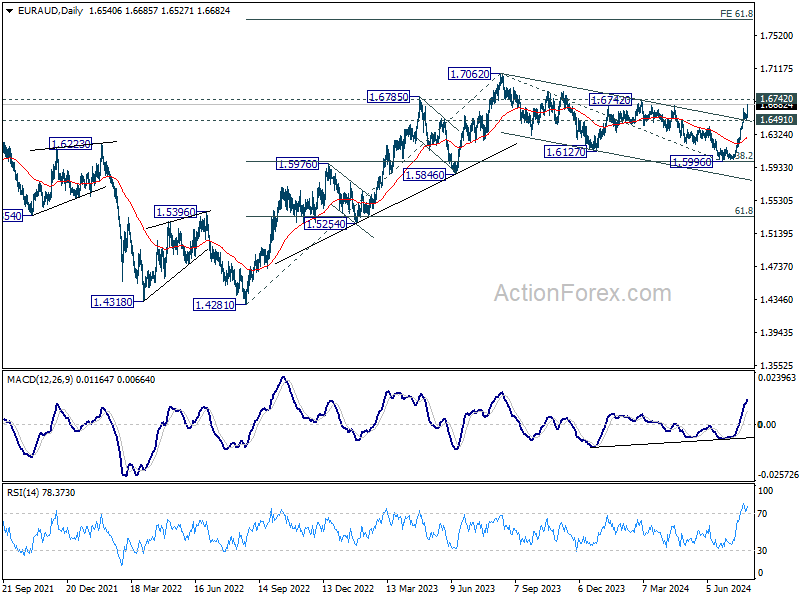
Intraday bias in EUR/AUD is back on the upside as rise from 1.5996 resumes. Further rally should be seen to 1.6742 resistance. As noted before, corrective fall from 1.7062 should have completed with three waves down to 1.5998. Firm break of 1.6742 will argue that larger up trend is going to resume through 1.7062 high. On the downside, however, break of 1.6491 support will delay the bullish case and turn intraday bias neutral first.
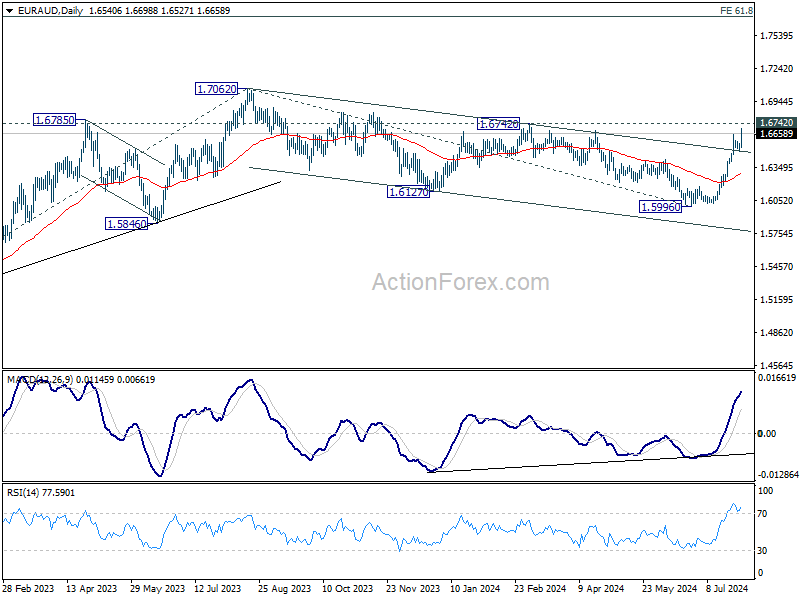
In the bigger picture, fall from 1.7062 medium term top is seen as a correction to the up trend from 1.4281 (2022 low) and could have completed after hitting 38.2% retracement of 1.4281 to 1.7062 at 1.6000. On resumption next target will be 61.8% projection of 1.4281 to 1.7062 from 1.5996 at 1.7715. This will now remain the favored case as long as 55 D EMA (now at 1.6296) holds.
EUR/JPY Daily Outlook
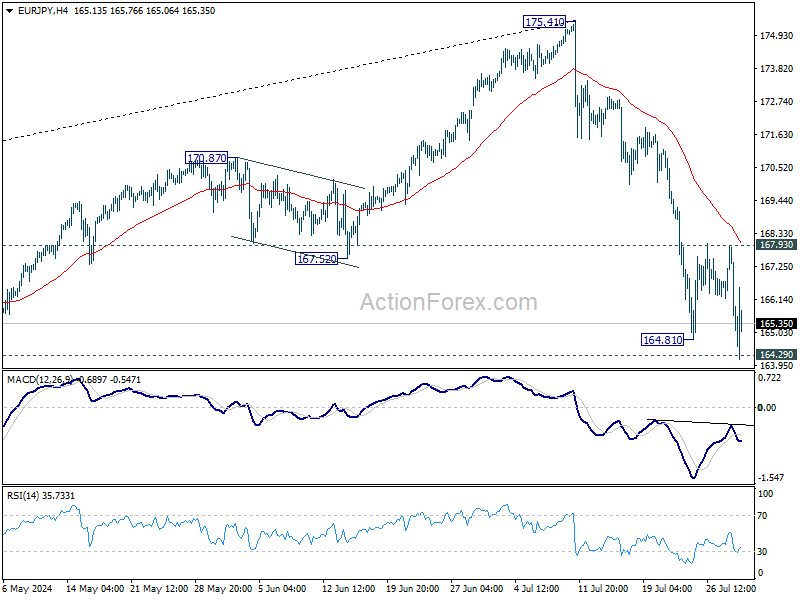
Daily Pivots: (S1) 164.20; (P) 166.08; (R1) 167.06; More...
Intraday bias in EUR/JPY is back on the downside with breach of 164.81 temporary low, as fall from 175.41 resumes. Decisive break of 164.29 support turned resistance will indicate that larger scale correction is underway for 155.91 fibonacci level. On the upside, however, break of 167.93 resistance will mix up the outlook and turn intraday bias neutral first.
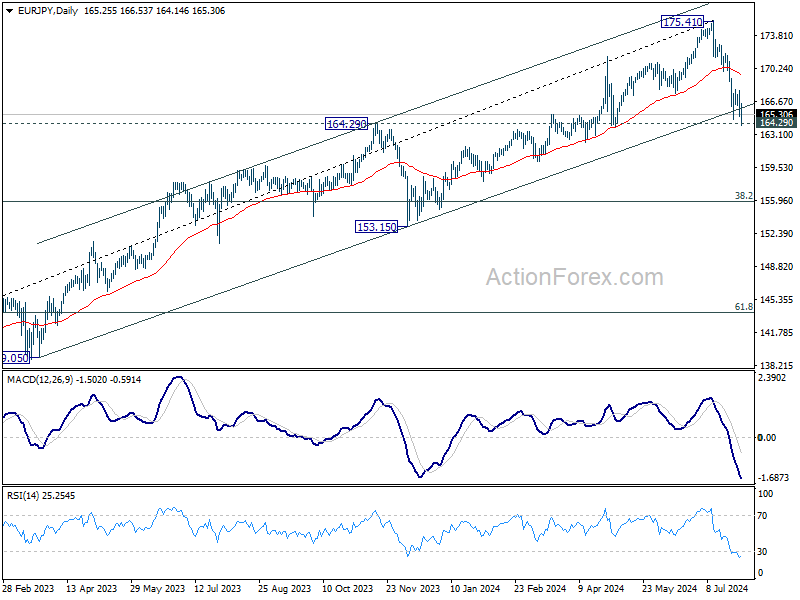
In the bigger picture, immediate focus is on 164.29 resistance turned support. Strong rebound from there will retain medium term bullishness for resuming the up trend through 175.41 at a later stage. However, decisive break of 164.29 will indicate that fall from 175.41 is at least correcting the rise from 124.73, with risk of bearish trend reversal. Deeper decline would be seen to 38.2% retracement of 124.37 to 175.41 at 155.91.
BoJ Hikes, Microsoft Disappoints, Fed Decides
The Bank of Japan (BoJ) raised its rate to 0.25% as cautiously expected and announced that it will reduce the monthly bond purchases in a predictable manner – but allow enough flexibility to support stability in the JGB markets. More importantly, the language in the communique was quite bullish on prices. The BoJ officials said that ‘underlying CPI inflation is expected to increase gradually, since it is projected that the output gap will improve and that medium- to long-term inflation expectations will rise with a virtuous cycle between wages and prices continuing to intensify.’ The latter hinted that today’s rate hike is certainly not the BoJ’s last one. Now, all eyes are on BoJ Governor Ueda for further tips and hints. The 10-year JGP yield is pushing higher after the decision and the yen is in demand. Both the USDJPY and the EURJPY tested their 200-DMA to the downside, the GBPJPY extends and consolidates losses below the 200 mark, and there is reason to believe – with what we heard from the BoJ thus far today – that the policy will become less loose to support the Japanese yen in the medium to long run.
Across the Pacific, the Federal Reserve (Fed) also started its two-day policy meeting and will announce its decision later today. The Fed is not expected to make a change to its rates today, but is widely and wildly expected to hint at a September rate cut. Activity on Fed funds futures doesn’t only hint at a 100% chance for a rate cut to happen in September but it also shows that the doves are getting ahead of themselves with the assessment of a nearly 15% chance that the Fed could cut 50bp or more in September – which will obviously not happen unless there is a big crisis or stress on the financial markets. Therefore, the stretched Fed pricing is a sign that the Fed cut expectations went too far and that we shall see a correction even though the Fed hints strongly at a September cut today – with the risk of hardly upsetting the market if it does not.
The US 2-year yield remains on track for further weakness in the base case scenario of a hint for September cut, while the US 10-year yield consolidates near 4.13%, the US dollar is softer this morning, but the index remains in the bullish trend – above a major Fibonacci support to its ytd positive trend, as the rate cut bets elsewhere rise along with the Fed cut bets. In this context, the EURUSD tipped a toe below the 1.08 yesterday after a surprise slowdown in German growth casted shadow on a better-than-expected EZ GDP number. Inflation figures on the other hand were encouraging in Spain but less so in Germany. The aggregate EZ inflation figures are due later today. A sufficiently soft set of data should keep the European Central Bank (ECB) doves in charge of the market and not let the EURUSD gain too much strength in case we see a dollar rebound after the Fed decision.
Tensions and Franc
Note that the US long-term bonds and the dollar also benefit from some safe haven demand after an explosion in Beirut – following a Hezbollah attack on Israel during the weekend – escalate the geopolitical tensions in the Middle East and directs capital toward safe haven assets. In this context, gold extends gains above the $2400 level and the franc advances. The USDCHF is no longer on track to extend the ytd gains, on the contrary, the pair slipped below a key Fibonacci support back in mid-July, the major 38.2% Fibonacci retracement that stands 0.8885, and is now in the bearish consolidation zone. The tense geopolitical setup and softening Fed expectations explain the U-turn in the USDCHF. However, the global easing vibes will certainly encourage more interest rate cuts from the Swiss National Bank (SNB) this year, and should limit the USDCHF’s downside potential.
Inside tech
Beirut explosion, a swift flight to safety and a renewed selloff across the Big Tech stocks weighed on major US indices yesterday. The S&P500 fell 0.50% while Nasdaq 100 slid around 1.40%. Nvidia tumbled 7% to its 100-DMA. But, Nasdaq futures are in a better shape this morning following a 7.5% rally from AMD after raising its forecast for AI accelerators. Microsoft, on the other hand, didn’t blow anyone’s mind when it reported earnings yesterday. The overall revenue rose by a slightly better-than-expected 15%, but revenue from Azure, its cloud computing platform that’s the main growth engine, grew only 29%, down from 31% in the previous period. About 8 percentage points of that increase was due to AI, up from 7 percentage points, but it was not enough. The market first sent Microsoft shares 9% down, the price than recovered to settle with around 3% loss. Due today after the bell, Meta’s results will be important for those looking for hints that all that massive AI spending is bearing fruits. Meta had said last quarter that it needed to spend more on AI to get to a level of play that will generate revenue. Hopefully, that timeline doesn’t extend at this quarter’s announcement. Zuckerberg knows that investors’ patience is wearing thin as Meta trades some 15% below its July peak.
Bottom?
US crude tumbled to $75pb level yesterday, unable to recover from the negativeness of the sluggish Chinese growth. But the rising geopolitical tensions and a major decline of nearly 4.5-mio-barrels in the US oil inventories last week help to bring the dip buyers in near the $75pb level. I believe that we may have hit a bottom near the $75pb this week. And I also believe that the lower the prices will go the higher the chance of a delay from OPEC to exit its production cut strategy.
Note that I will be on holiday for the next two weeks. See you again in August!
GBP/JPY Daily Outlook
Daily Pivots: (S1) 194.86; (P) 197.17; (R1) 198.37; More...
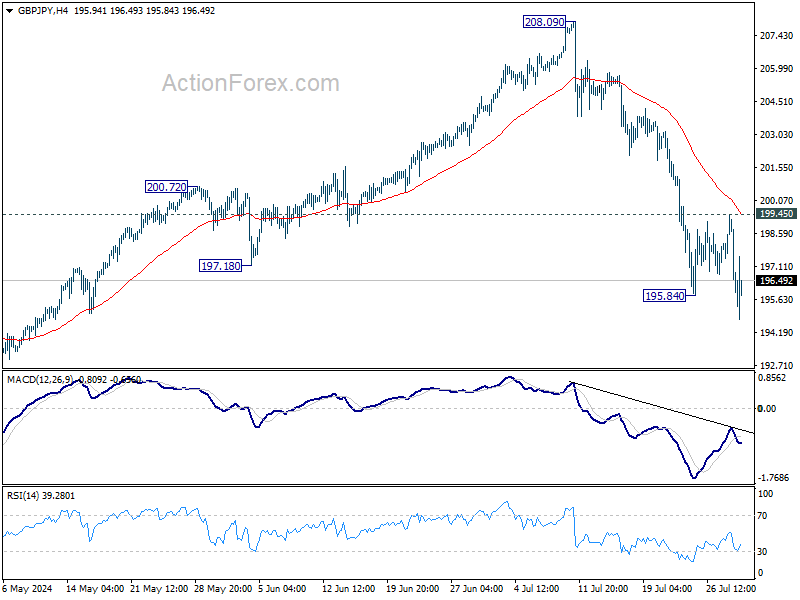
Intraday bias in GBP/JPY is back on the downside with breach of 195.84 temporary low. Fall from 208.09 is probably a larger scale correction and should target 185.49 fibonacci level. Nevertheless, on the upside, firm break of 199.45 resistance will mix up the outlook and turn intraday bias neutral first.
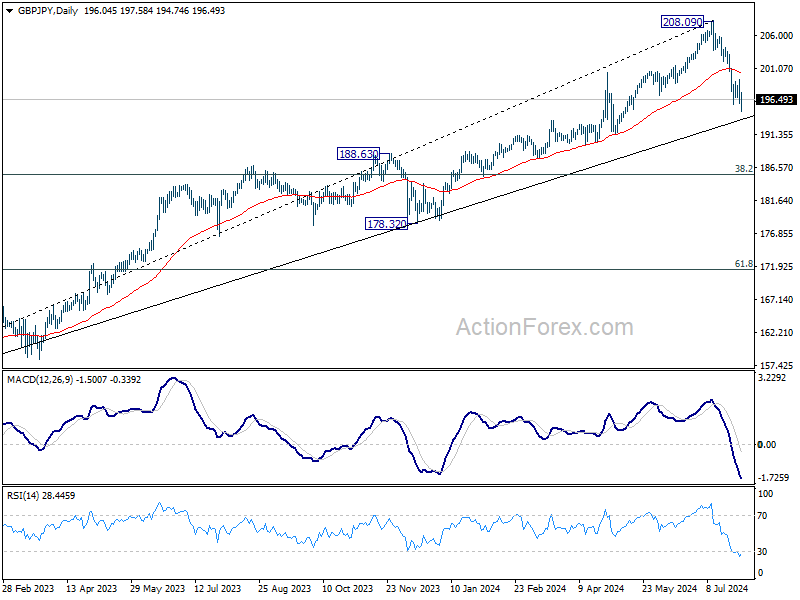
In the bigger picture, considering bearish divergence condition in W MACD, 208.09 might be a medium term top and fall from there could already be correcting whole up trend from 148.93 (2022 low). Risk will now stay on the downside as long as 55 D EMA (now at 200.51) holds. Deeper fall would be seen to 38.2% retracement of 148.93 to 208.09 at 185.49.
Yen Up Slightly After BoJ Hike; Aussie Tumbles on Core Inflation Relief
Yen rose broadly today after the BoJ raised interest rates for the second time this year, and maintained hawkish bias. However, buying momentum has not been decisive. This lack of strong momentum can be attributed to the fact that the rate hike decision was likely well priced in by the markets. Nikkei's rebound following the announce further indicates that BoJ's move was anticipated. Additionally, traders remain cautious ahead of FOMC rate decision later today, where Fed might signal a rate cut in September.
In contrast, Australian Dollar tumbled broadly following release of quarterly CPI data. Markets and economists showed relief as the trimmed mean CPI slowed in Q2, which overshadowed the rise in headline CPI. The continued core disinflation provides RBA with some room to keep interest rates unchanged next week, avoiding the need for another rate hike.
Overall, Dollar is following Aussie as the second weakest currency of the day so far, with Loonie r trailing in third place. Swiss Franc has emerged as the strongest currency, followed by Yen and then Euro. British pound and Kiwi are positioned in the middle of the performance spectrum.
Technically, EUR/AUD's rally from 1.5996 resumed today and hits as high as 1.6685 so far. The bullish view remains intact, and correction from 1.7062 should have completed with three waves down to 1.5996. Further rise is expected as long as 1.6491 support holds. Decisive break of 1.6742 resistance will argue that larger up trend from 1.4281 (2022 low) is ready to resume through 1.7062 high.
In Asia, at the time of writing, Nikkei is up 0.03%. Hong Kong HSI is up 1.90%. China Shanghai SSE is up 1.75%. Singapore Strait Times is up 0.29%. Japan 10-year JGB yield is up 0.0533 at 1.050. Overnight, DOW rose 0.50%. S&P 500 fell -0.50%. NASDAQ fell -1.28%. 10-year yield fell -0.035 to 4.143.
BoJ hikes to 0.25%, signals more increases if outlook realizes
BoJ raised the uncollateralized overnight call rate from 0-0.10% to around 0.25% today. The decision was made by a 7-2 vote, with dissenting votes from Toyoaki Nakamura and Asahi Noguchi, who preferred to gather more information and conduct a careful assessment before adjusting the interest rate.
Regarding JGB purchases, there was a unanimous decision to reduce the amount of monthly outright purchases to about JPY 3T by Q1 2026. The amount will be cut by JPY 400B each calendar quarter.
BoJ stated that economic activity and prices have been "developing generally in line with the Bank's outlook." Moves to raise wages have been spreading, and the annual rate of import price growth has "turned positive again," with upside risks to prices requiring attention.
It also noted if the outlook presented in the July Outlook Report is realized, BoJ will continue to raise the policy interest rate and adjust the degree of monetary accommodation accordingly.
In the new economic projections, the BoJ made several adjustments:
- Fiscal 2024 growth forecast was lowered from 0.8% to 0.6%.
- Fiscal 2025 growth forecast remains unchanged at 1.0%.
- Fiscal 2026 growth forecast remains unchanged at 1.0%.
For inflation projections:
- Fiscal 2024 CPI core forecast was lowered from 2.8% to 2.5%.
- Fiscal 2025 CPI core forecast was raised from 1.9% to 2.1%.
- Fiscal 2026 CPI core forecast remains unchanged at 1.9%.
- Fiscal 2024 CPI core-core forecast remains unchanged at 1.9%.
- Fiscal 2025 CPI core-core forecast remains unchanged at 1.9%.
- Fiscal 2026 CPI core-core forecast remains unchanged at 2.1%.
Australia's trimmed mean CPI drops to 3.9%, continuing six-quarter downtrend
In Q2, Australia's CPI rose by 1.0% qoq, matching both expectations and the pace set in Q1. Annual rate increased from 3.6% to 3.8% , also in line with forecasts.
More notably, the core inflation measure marked its sixth consecutive quarter of cooling. Trimmed mean CPI, which is a key indicator of underlying inflation, rose by 0.8% qoq. This represents a slowdown from the prior quarter's 1.0% qoq increase and falls below the expected 0.9% qoq. Annually, trimmed mean CPI slowed from 4.0% yoy to 3.9% yoy, below the expected 4.0% and continuing its downward trend from the peak of 6.8% in the December 2022 quarter.
Additionally, the monthly CPI for June slowed from 4.0% yoy to 3.8% yoy, again matching expectations.
NZ ANZ business confidence jumps to 27.1, inflation expectations fall further
In July, New Zealand's ANZ Business Confidence saw a notable increase, jumping from 6.1 to 27.1. Own Activity Outlook also improved, rising from 12.2 to 16.3. Meanwhile, cost expectations fell slightly from 69.2 to 68.2, and wage expectations edged up from 73.5 to 74.6. Pricing intentions saw an increase from 35.3 to 37.6. Importantly, inflation expectations continued their steady decline, falling from 3.46% to 3.20%.
ANZ commented that the economic climate remains one where "bad news is good news" for RBNZ. With mounting evidence that monetary policy has been effective, perhaps overly so, there is now a broad expectation that RBNZ will start easing the Official Cash Rate this year.
ANZ noted that "evidence is mounting that the inflation dragon is on its last legs," which positions the New Zealand economy for a more robust recovery compared to a scenario where inflation control efforts were only partially successful.
China's NBS PMI manufacturing falls to 49.4 in amid weak demand and extreme weather
China's official NBS PMI Manufacturing index fell slightly from 49.5 to 49.4 in July, just above the expected 49.3. This index has remained below the 50-mark, which separates growth from contraction, for all but three months since April 2023.
NBS analyst Zhao Qinghe attributed the decline in manufacturing activity to the typical off-season for production in July, insufficient market demand, and extreme weather conditions such as high temperatures and floods in some areas.
PMI Non-Manufacturing index also fell, dropping from 50.5 to 50.2, in line with expectations, but still indicating expansion for the 19th consecutive month. Within this category, construction subindex decreased from 52.3 to 51.2, while services subindex slipped from 50.2 to 50e.
Overall, the official PMI Composite, which combines both manufacturing and non-manufacturing sectors, declined from 50.5 to 50.2.
Looking ahead
Eurozone CPI flash is the main focus in European sesion today while German import prices and eunemployment, as well as Swiss UB economic expectations will be released.
Later in the day, Canada GDP would be a focus while US will release ADP employment, Chicago PMI and pending sales. But the main event is definitely FOMC rate decision.
GBP/JPY Daily Outlook
Daily Pivots: (S1) 194.86; (P) 197.17; (R1) 198.37; More...
Intraday bias in GBP/JPY is back on the downside with breach of 195.84 temporary low. Fall from 208.09 is probably a larger scale correction and should target 185.49 fibonacci level. Nevertheless, on the upside, firm break of 199.45 resistance will mix up the outlook and turn intraday bias neutral first.
In the bigger picture, considering bearish divergence condition in W MACD, 208.09 might be a medium term top and fall from there could already be correcting whole up trend from 148.93 (2022 low). Risk will now stay on the downside as long as 55 D EMA (now at 200.51) holds. Deeper fall would be seen to 38.2% retracement of 148.93 to 208.09 at 185.49.
Economic Indicators Update
| GMT | Ccy | Events | Actual | Forecast | Previous | Revised |
|---|---|---|---|---|---|---|
| 22:45 | NZD | Building Permits M/M Jun | -13.80% | -1.70% | -1.90% | |
| 23:50 | JPY | Industrial Production M/M Jun P | -3.60% | -4.20% | 3.60% | |
| 23:50 | JPY | Retail Trade Y/Y Jun | 3.70% | 3.30% | 2.80% | |
| 01:00 | NZD | ANZ Business Confidence Jul | 27.1 | 6.1 | ||
| 01:30 | AUD | Monthly CPI Y/Y Jun | 3.80% | 3.80% | 4.00% | |
| 01:30 | AUD | CPI Q/Q Q2 | 1.00% | 1.00% | 1.00% | |
| 01:30 | AUD | CPI Y/Y Q2 | 3.80% | 3.80% | 3.60% | |
| 01:30 | AUD | RBA Trimmed Mean CPI Q/Q Q2 | 0.80% | 0.90% | 1.00% | |
| 01:30 | AUD | RBA Trimmed Mean CPI Y/Y Q2 | 3.90% | 4.00% | 4.00% | |
| 01:30 | AUD | Retail Sales M/M Jun | 0.50% | 0.30% | 0.60% | |
| 01:30 | AUD | Private Sector Credit M/M Jun | 0.60% | 0.40% | ||
| 01:30 | CNY | NBS Manufacturing PMI Jul | 49.4 | 49.3 | 49.5 | |
| 01:30 | CNY | NBS Non-Manufacturing PMI Jul | 50.2 | 50.2 | 50.5 | |
| 03:57 | JPY | BoJ Interest Rate Decision | 0.25% | 0.25% | 0.10% | |
| 05:00 | JPY | Housing Starts Y/Y Jun | -6.70% | -2.00% | -5.30% | |
| 05:00 | JPY | Consumer Confidence Jul | 36.7 | 36.5 | 36.4 | |
| 06:00 | EUR | Germany Import Price Index M/M Jun | 0.10% | 0.00% | ||
| 07:55 | EUR | Germany Unemployment Change Jul | 16K | 19K | ||
| 07:55 | EUR | Germany Unemployment Rate Jul | 6.00% | 6.00% | ||
| 08:00 | CHF | UBS Economic Expectations Jul | 17.5 | |||
| 09:00 | EUR | Eurozone CPI Y/Y Jul P | 2.40% | 2.50% | ||
| 09:00 | EUR | Eurozone CPI Core Y/Y Jul P | 2.80% | 2.90% | ||
| 12:15 | USD | ADP Employment Change Jul | 166K | 150K | ||
| 12:30 | USD | Employment Cost Index Q2 | 1.00% | 1.20% | ||
| 12:30 | CAD | GDP M/M May | 0.10% | 0.30% | ||
| 13:45 | USD | Chicago PMI Jul | 44.1 | 47.4 | ||
| 14:00 | USD | Pending Home Sales M/M Jun | 1.60% | -2.10% | ||
| 14:30 | USD | Crude Oil Inventories | -1.6M | -3.7M | ||
| 18:00 | USD | Fed Interest Rate Decision | 5.50% | 5.50% | ||
| 18:30 | USD | FOMC Press Conference |