Sample Category Title
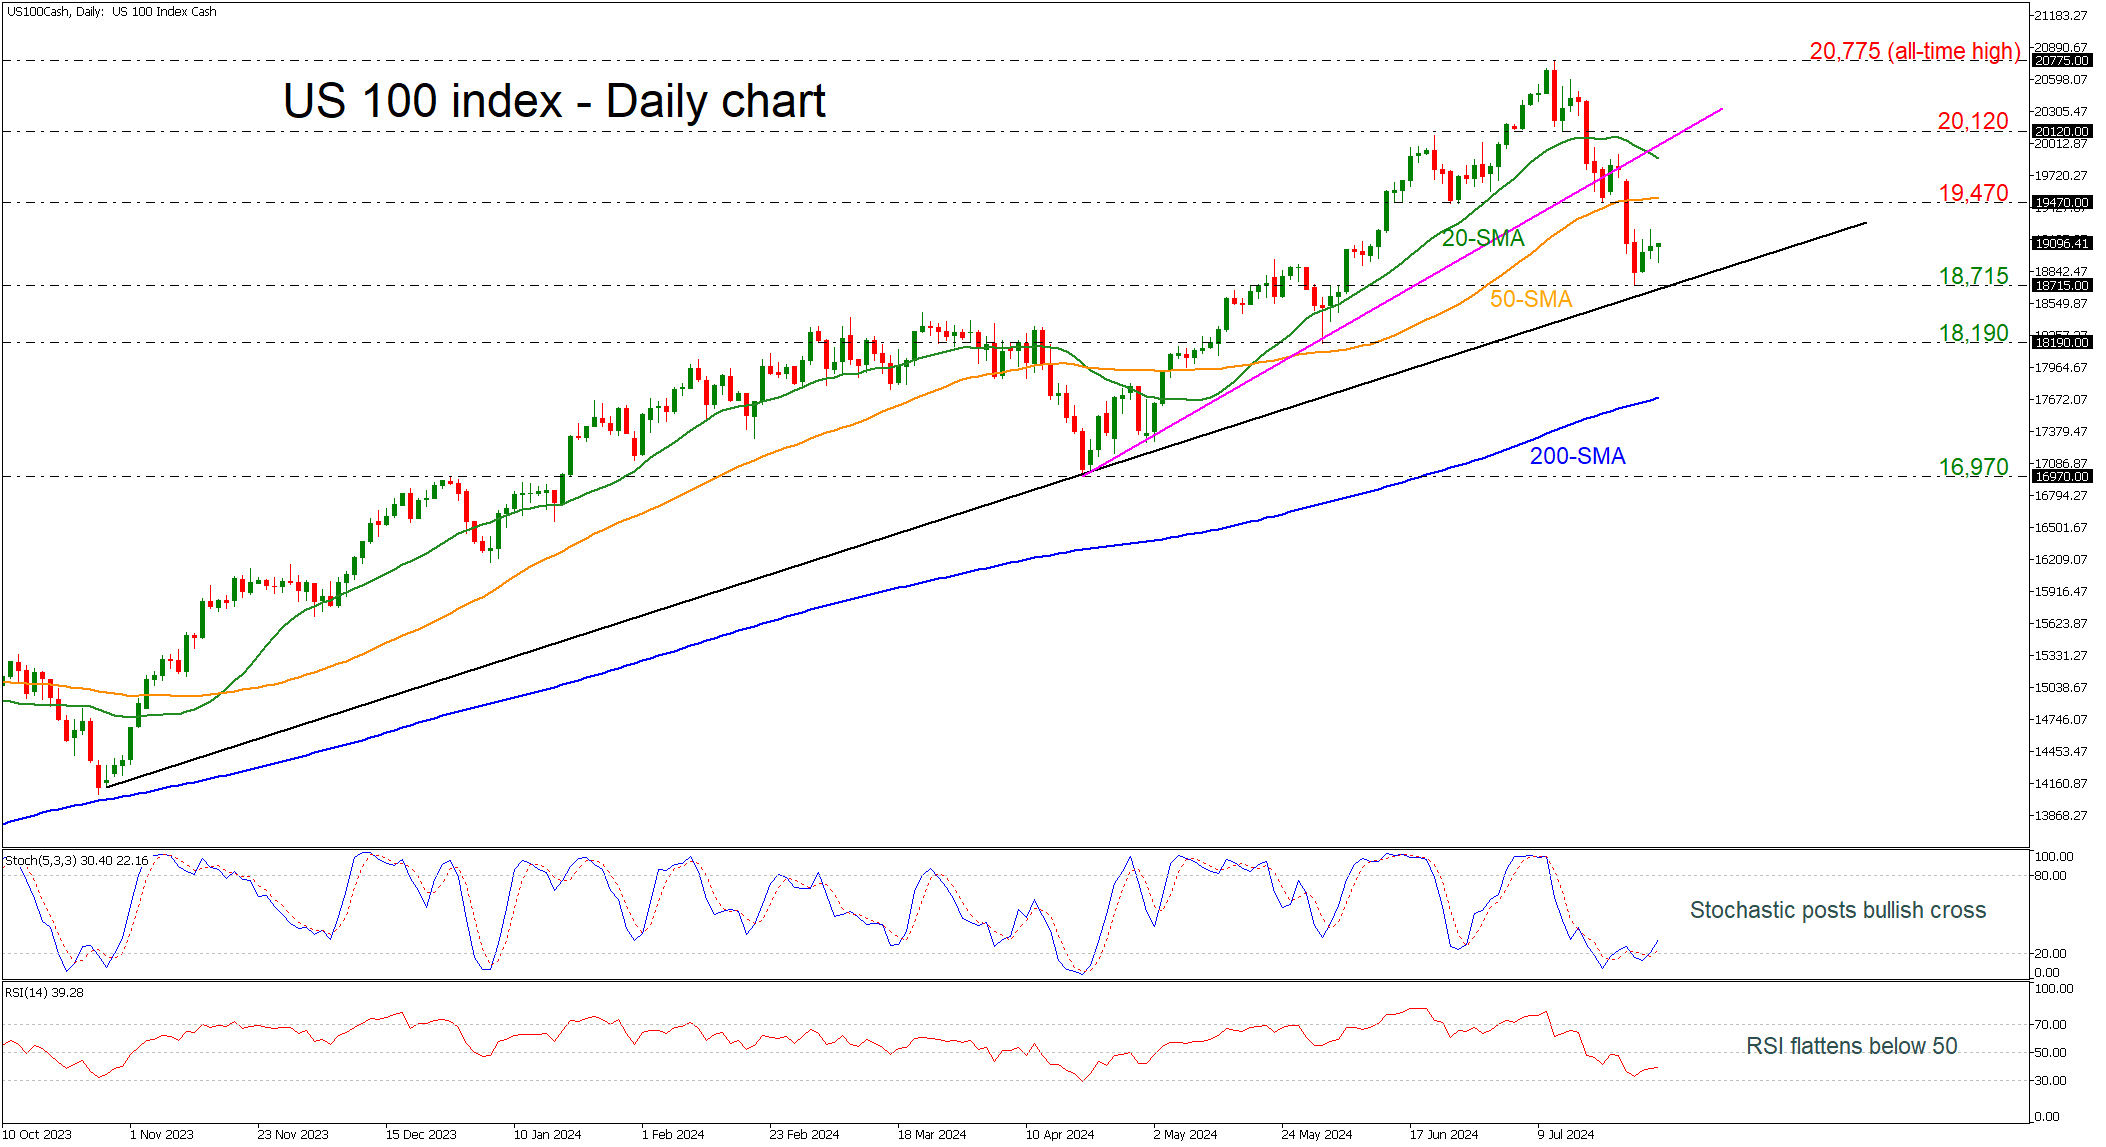
US 100 Index Stops at Uptrend Line; Positive Risks Not Faded Yet
- US 100 heads up, standing beneath short-term rising trend line
- Stochastics point north above oversold region
- RSI ticks higher below 50 level
The US 100 (cash) index had a strong pullback off the 18,715 support, failing to extend its dive from the all-time high of 20,775 below the long-term ascending trend line.
Technically, the stochastic oscillator is moving up following the bullish crossover within its %K and %D lines in the oversold zone, while the RSI is ticking slightly up beneath the neutral threshold of 50. Also, the 20- and 50-day simple moving averages (SMAs) are heading down, approaching the current market price.
If traders continue to buy the index, then the 50-day SMA near 19,470 resistance would be the first obstacle to look for ahead of the 20-day SMA at 19,875. A break above this level would shift the short-term outlook back to positive, taking the price above the near-term uptrend line at 20,120.
In the event of a downside reversal and a closing session below the long-term ascending trend line, near the 18,715 support, could open the way for a downside tendency, hitting 18,190. A strong barrier, though, could be found at the 200-day SMA at 17,690.
In the bigger picture, the US 100 index is bullish as long as it holds above the 200-day SMA. If it violates this line, the bears would probably take the upper hand.
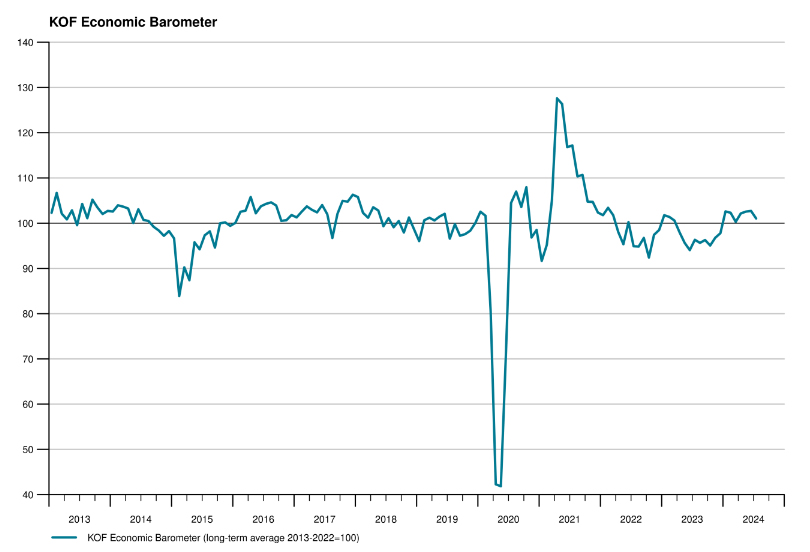
Swiss KOF falls to 101, signals moderate growth ahead
Swiss KOF Economic Barometer fell from 102.7 to 101.0 in July, missing the expected 102.6. This drop indicates that the Swiss economy is likely to continue growing at a "rather moderate pace" in the near future, according to KOF.
The decline, while not unanimous across all indicators, is "very widely visible". The outlook for both foreign and consumer demand is worsening. Moreover, sectors such as hospitality, construction, other services, and manufacturing showed negative developments. However, financial and insurance services sector bucked the trend, showing an increase and "resist the widespread downward tendency".
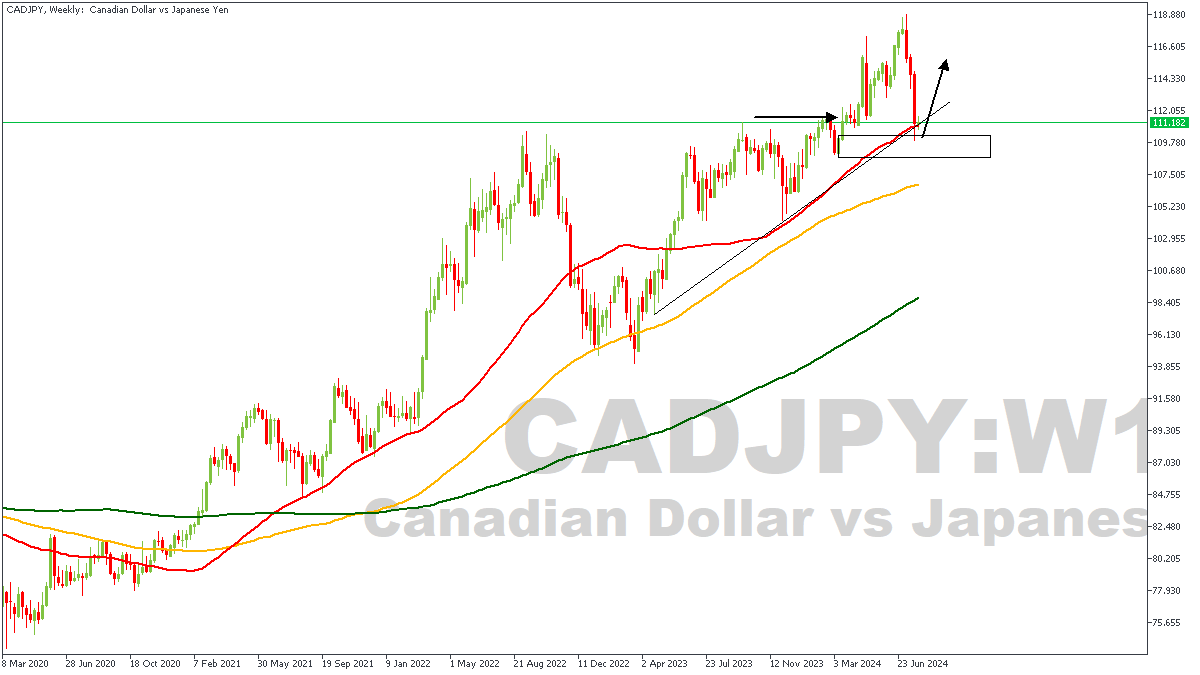
CADJPY: Trade of the Week
The Canadian Dollar (CAD) weakened on Monday as it lagged behind the strengthening US Dollar ahead of the Federal Reserve's rate decision. This week, the CAD is underrepresented on the economic calendar, making it susceptible to broader market movements and central bank appearances. Key data to watch includes Wednesday’s Canadian GDP for May, anticipated to slow to 0.1% MoM from April’s 0.3%. Additionally, Thursday's S&P Global Canadian Manufacturing PMI for June is expected to remain in contraction territory, below 50.0, as it has since May 2023. These factors will likely influence CAD's performance this week.
CADJPY – Weekly Timeframe
On the weekly timeframe of CADJPY, we see the price action is currently stalling around the 50-period moving average, while resting on a trendline support and a drop-base-rally demand zone. The bullish array of the moving averages can also be deduced clearly from the chart. Considering the break of structure at the highlighted horizontal arrow, I will be looking towards the lower timeframes for confirmation of a trade entry.
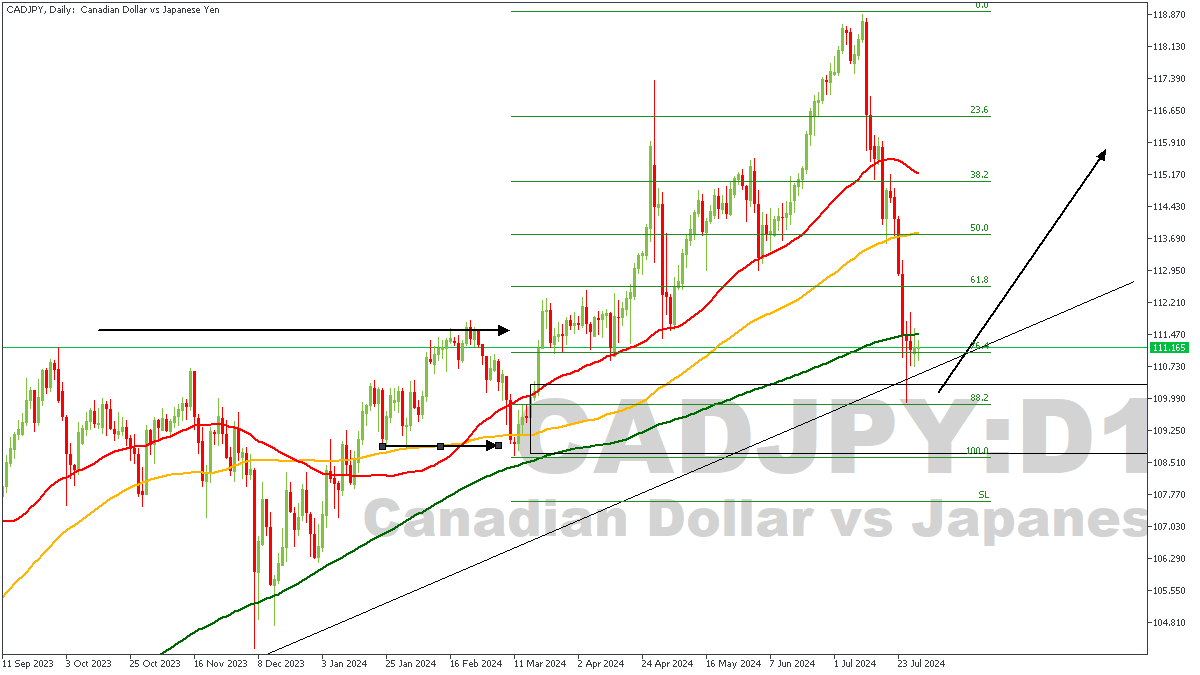
CADJPY – D1 Timeframe
One beautiful pattern I can spot pretty easily on this daily timeframe chart of CADJPY is the SBR (Sweep-Break-Retest) price action pattern. This is based on the sweep below the low at the short horizontal arrow, then the break above the high at the long horizontal arrow. Considering that the 200-day moving average is also in play as a crucial support level, as well as the trendline, simply implies that price can be expected to make a big bounce from the demand zone soon.
Analyst’s Expectations:
- Direction: Bullish
- Target: 114.501
- Invalidation: 108.463
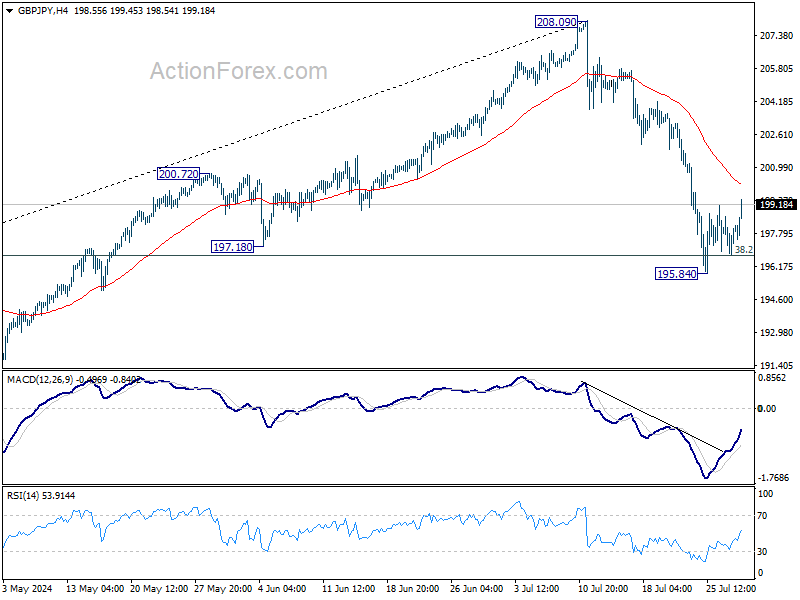
GBP/JPY Daily Outlook
Daily Pivots: (S1) 197.05; (P) 197.83; (R1) 198.87; More...
Intraday bias in GBP/JPY remains neutral as consolidations continue above 195.84. Further decline is expected as long as 55 4H EMA (now at 200.20) holds. On the downside, sustained trading below 38.2% retracement of 178.32 to 208.09 at 196.71 will argue that larger scale correction is under way to 185.49 fibonacci level. However, sustained break of 55 4H EMA will turn bias back to the upside for stronger rebound to 55 D EMA (now at 200.63).
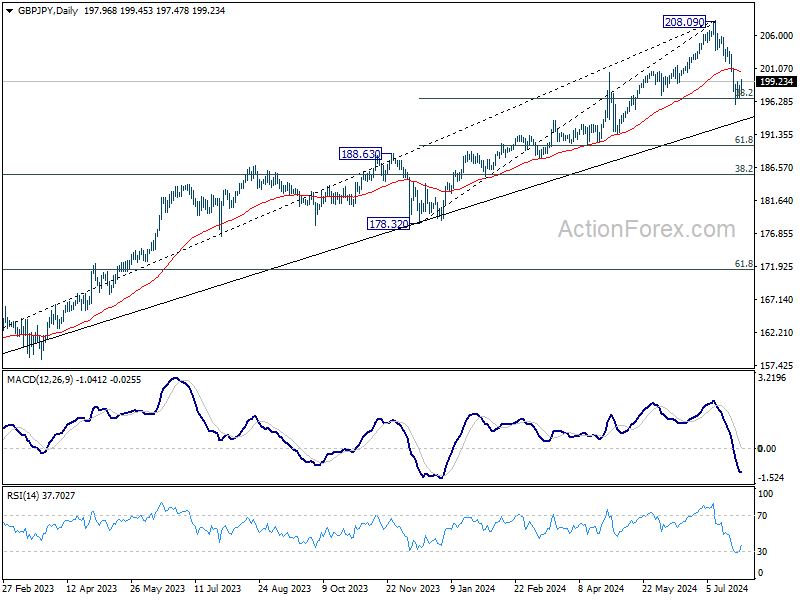
In the bigger picture, considering bearish divergence condition in W MACD, 208.09 might be a medium term top and fall from there could already be correcting whole up trend from 148.93 (2022 low). Risk will now stay on the downside as long as 55 D EMA (now at 200.63) holds. Sustained break of 196.71 will pave the way to 38.2% retracement of 148.93 to 208.09 at 185.49.
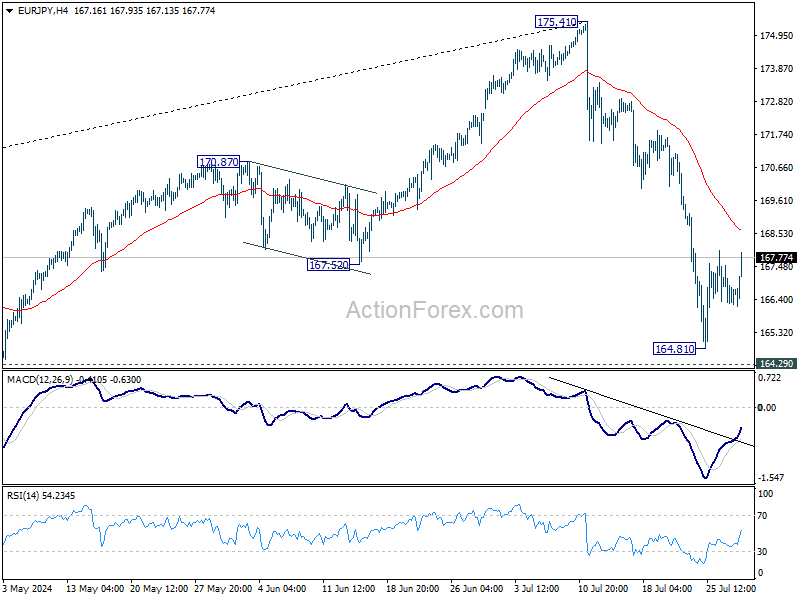
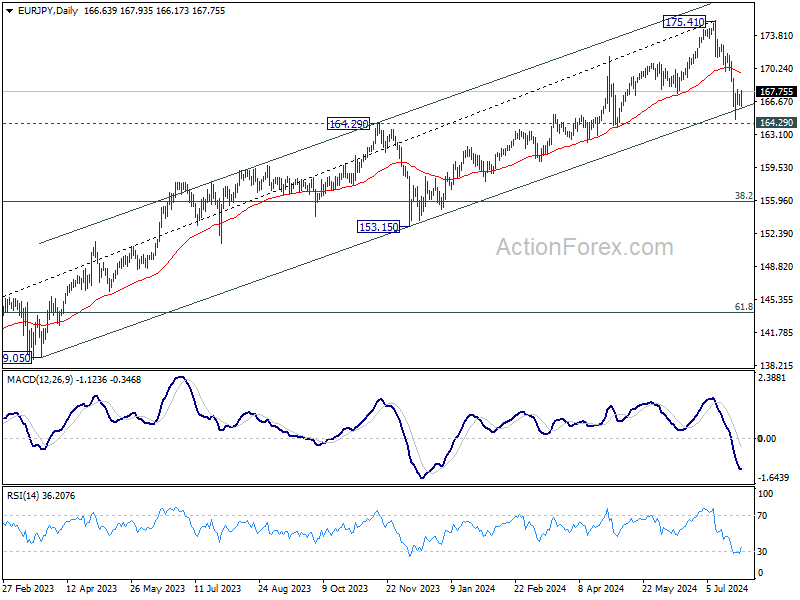
EUR/JPY Daily Outlook
Daily Pivots: (S1) 166.11; (P) 166.81; (R1) 167.39; More...
Intraday bias in EUR/JPY remains neutral as consolidation continues above 164.81. Further decline is expected as long as 55 4H EMA (now at 168.63) holds. On the downside, decisive break of 164.29 support turned resistance will indicate that larger scale correction is underway for 155.91 fibonacci level. Nevertheless, sustained break of 55 4H EMA will turn bias back to the upside for stronger rebound to 55 D EMA (now at 169.79).
In the bigger picture, immediate focus is on 164.29 resistance turned support. Strong rebound from there will retain medium term bullishness for resuming the up trend through 175.41 at a later stage. However, decisive break of 164.29 will indicate that fall from 175.41 is at least correcting the rise from 124.73, with risk of bearish trend reversal. Deeper decline would be seen to 38.2% retracement of 124.37 to 175.41 at 155.91.
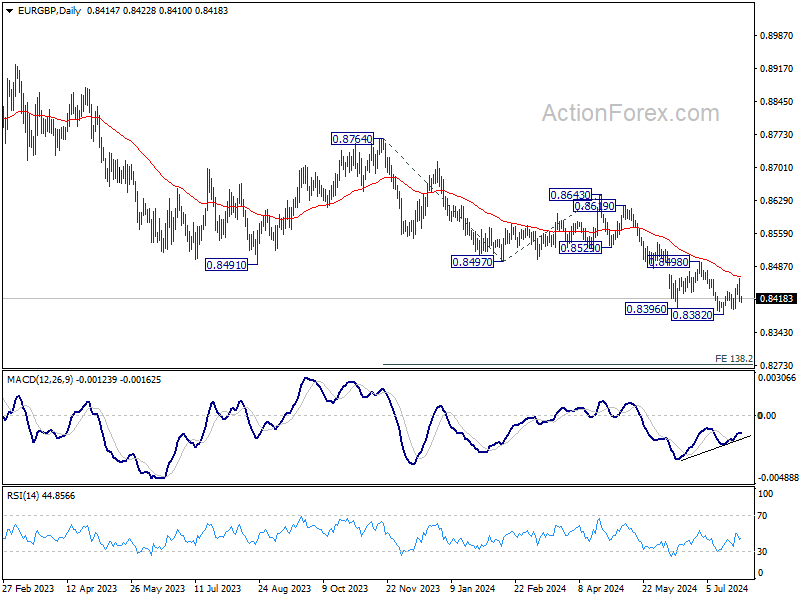
EUR/GBP Daily Outlook
Daily Pivots: (S1) 0.8397; (P) 0.8429; (R1) 0.8446; More....
No change in EUR/GBP's outlook as consolidation from 0.8382 is extending. Outlook continues to stay bearish with 0.8498 resistance intact. Firm break of 0.8382 will resume larger down trend next target will be 138.2% projection of 0.8764 to 0.8497 from 0.8463 at 0.8274.
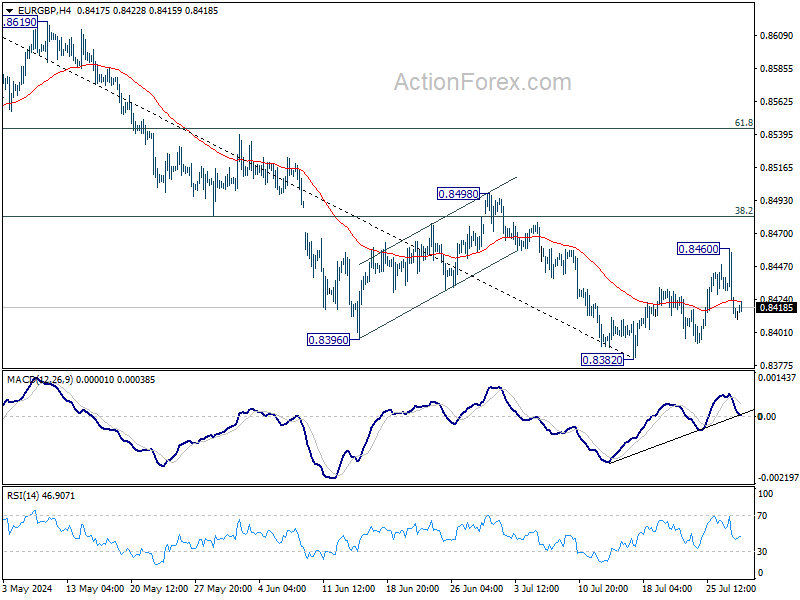
In the bigger picture, down trend from 0.9267 (2022 high) is in progress. Next target is 0.8201 key support (2022 low). For now, outlook will remain bearish as long as 0.8643 resistance holds, even in case of strong rebound.
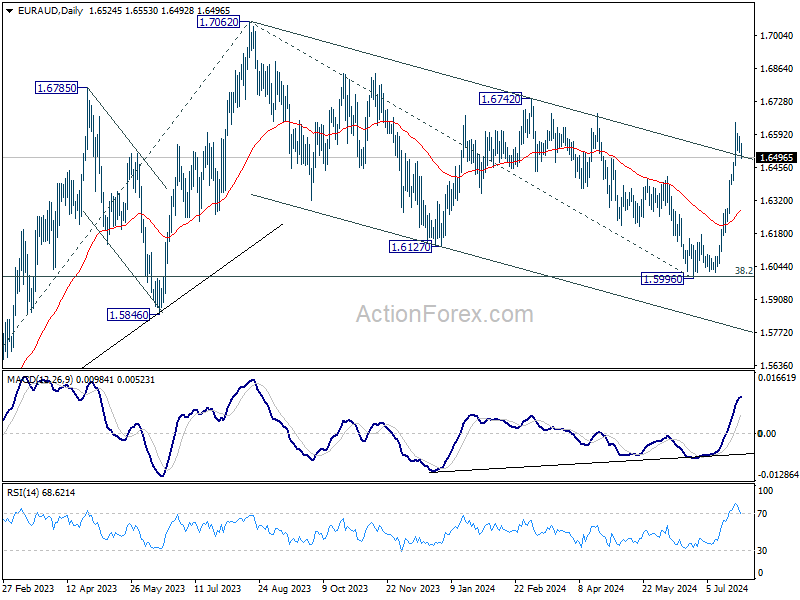
EUR/AUD Daily Outlook
Daily Pivots: (S1) 1.6498; (P) 1.6545; (R1) 1.6571; More...
Intraday bias in EUR/AUD stays neutral as consolidation from 1.6642 is extending. Further rally is expected as long as 1.6384 support holds. Corrective fall from 1.7062 should have completed with three waves down to 1.5998. Above 1.6642 will target 1.6742 resistance. Decisive break there will argue that larger up trend is going to resume through 1.7062 high.
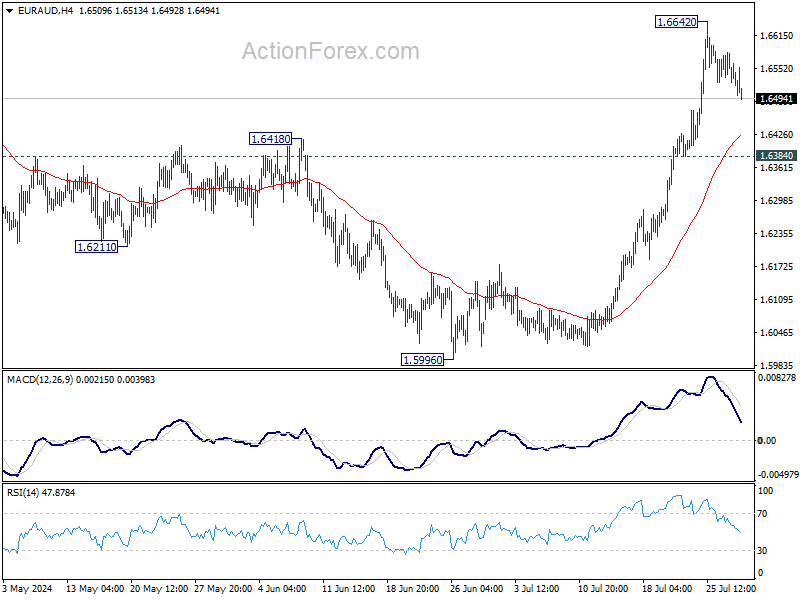
In the bigger picture, fall from 1.7062 medium term top is seen as a correction to the up trend from 1.4281 (2022 low) and could have completed after hitting 38.2% retracement of 1.4281 to 1.7062 at 1.6000. On resumption next target will be 61.8% projection of 1.4281 to 1.7062 from 1.5996 at 1.7715. This will now remain the favored case as long as 55 D EMA (now at 1.6264) holds.
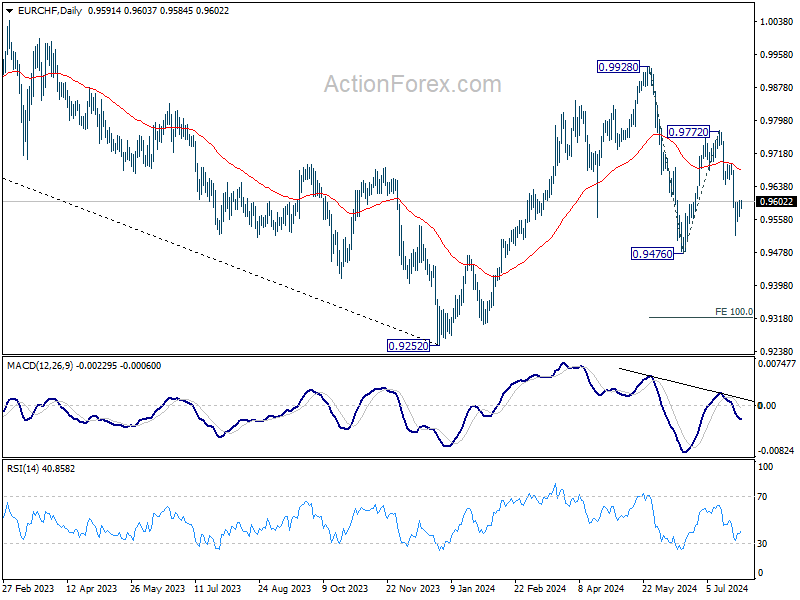
EUR/CHF Daily Outlook
Daily Pivots: (S1) 0.9569; (P) 0.9587; (R1) 0.9606; More....
Intraday bias in EUR/CHF remains neutral and more consolidations would be seen above 0.9159. Further decline is expected as long as 0.9641 support turned resistance holds. Rebound from 0.9476 should have completed as a corrective move at 0.9772. Below 0.9519 will bring retest of 0.9476. Firm break there will resume whole fall from 0.9928 to 100% projection of 0.9928 to 0.94767 from 0.9772 at 0.9320.
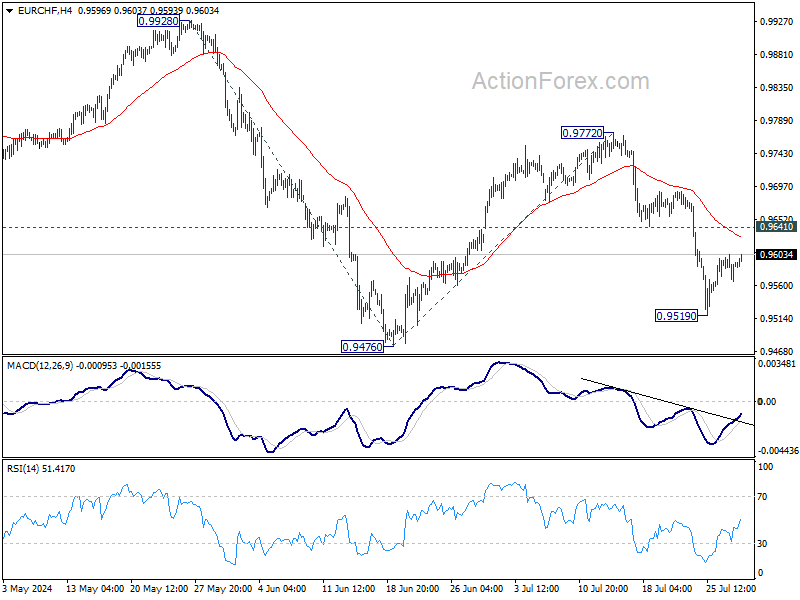
In the bigger picture, with 1.0095 key medium term resistance intact, price actions from 0.9252 (2023 low) are seen as a corrective pattern. Fall from 0.9928 might be the second leg and break of 0.9476 would bring deeper decline to retest 0.9252 low. But strong support should be seen there to extend the corrective pattern with another rising leg. In any case, medium term outlook will be neutral at best as long as 1.0095 structural resistance holds.
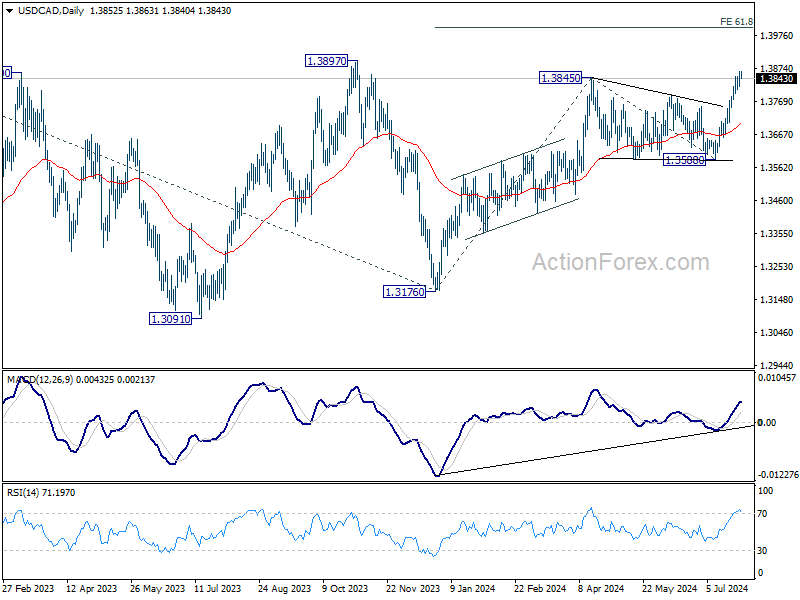
USD/CAD Daily Outlook
Daily Pivots: (S1) 1.3824; (P) 1.3845; (R1) 1.3872; More...
USD/CAD's breach of 1.3858 suggests that rise from 1.3176 is resuming. Intraday bias is back on the upside. Next target is 61.8% projection of 1.3176 to 1.3845 from 1.3588 at 1.4025. On the downside, below 1.3796 minor support will delay the bullish case and turn intraday bias neutral again.
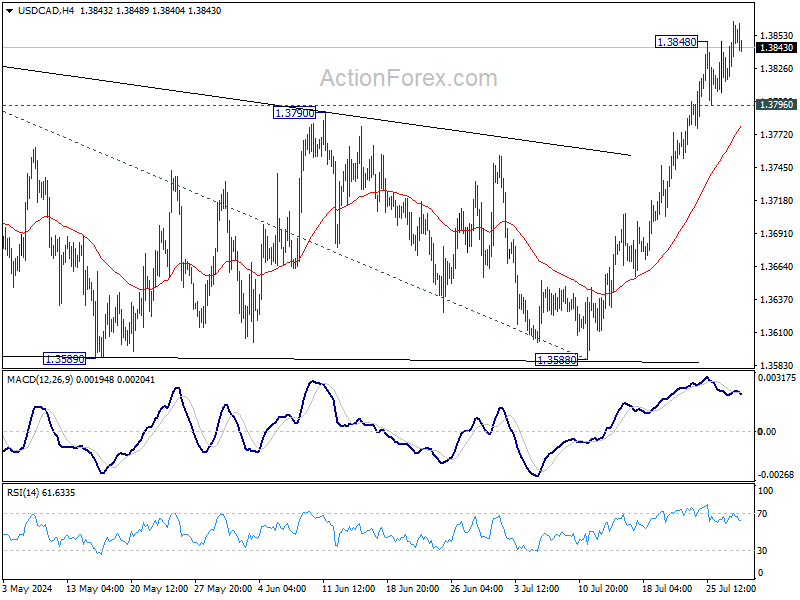
In the bigger picture, price actions from 1.3976 (2022 high) are viewed as a corrective pattern, that might have completed at 1.3176 (2023 low) already. Firm break of 1.3976 will confirm resumption of whole up trend from 1.2005 (2021 low). Next target is 61.8% projection of 1.2401 to 1.3976 from 1.3176 at 1.4149. This will be the favored case as long as 1.3588 support holds, in case of pullback.
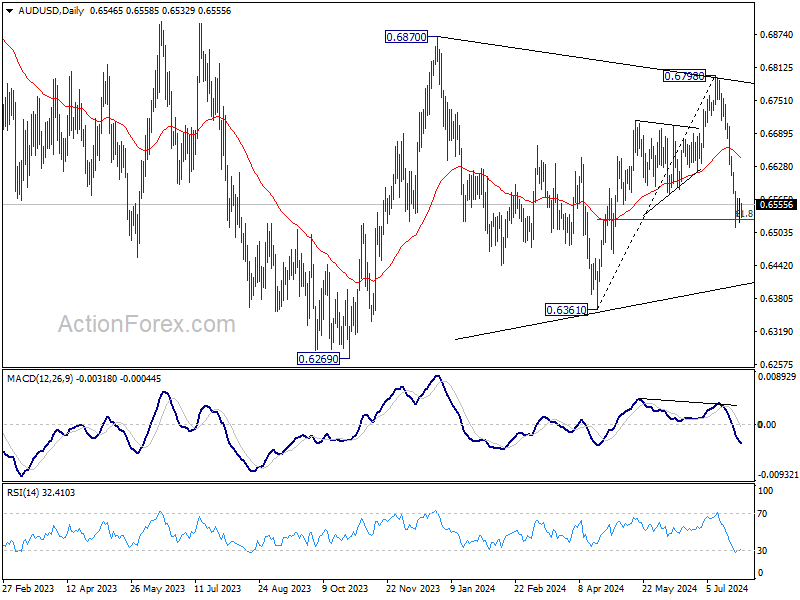
AUD/USD Daily Report
Daily Pivots: (S1) 0.6526; (P) 0.6547; (R1) 0.6570; More...
AUD/USD is staying in consolidation above 0.6513 and intraday bias remains neutral. Further decline is expected as long as 55 4H EMA (now at 0.6608) holds. On the downside, sustained break of 61.8% retracement of 0.6361 to 0.6798 at 0.6528 will resume the fall from 0.6798 to 0.6361 support next.
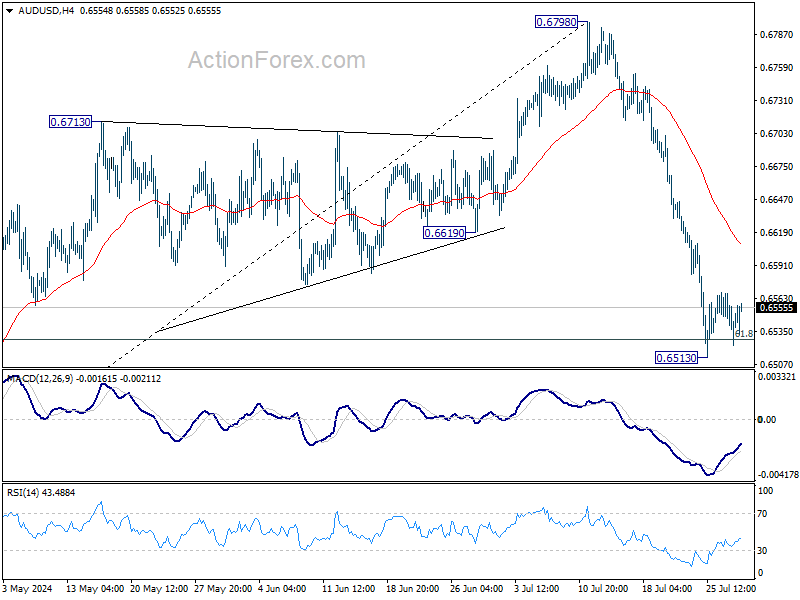
In the bigger picture, overall, price actions from 0.6169 (2022 low) are seen as a medium term corrective pattern, with fall from 0.6798 as another falling leg. Deeper fall could be seen to the lower side of the range between 0.6169/6361. But strong support should be seen there to contain downside. For now, risk will stay on the downside as long as 0.6798 resistance holds, in case of rebound.