

Sample Category Title
EUR/GBP Daily Outlook
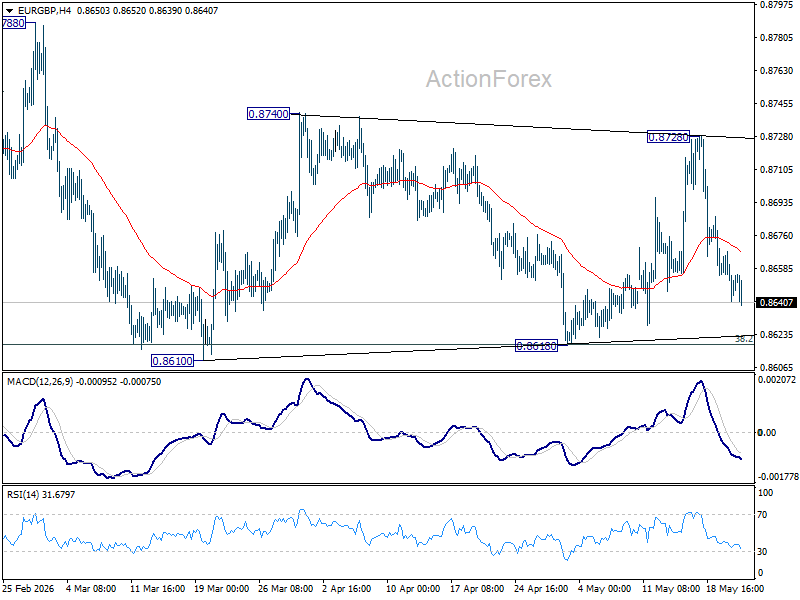
No change in EUR/GBP's outlook and intraday bias stays neutral for the moment. On the upside, decisive break of 0.8740 should pave the way through 0.8788 to retest 0.8863 high. Meanwhile, firm break of 0.8610 will revive the case of bearish trend reversal.
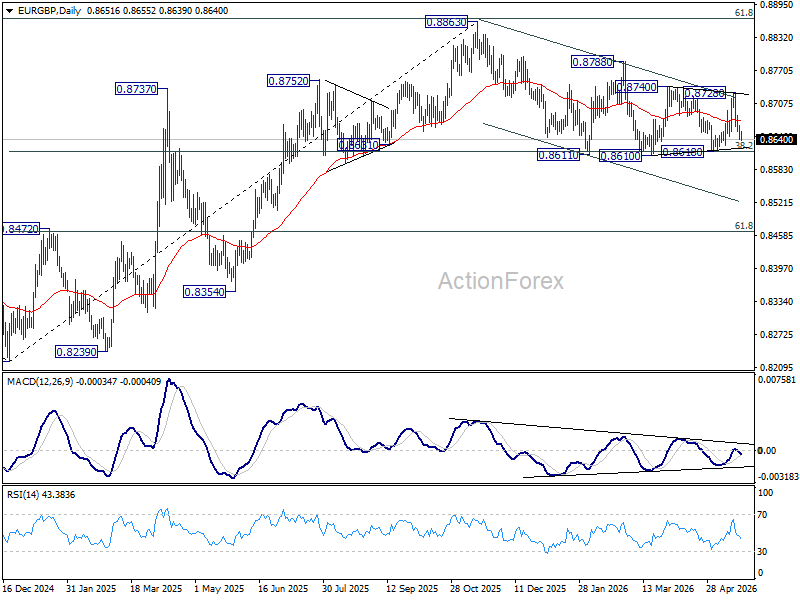
In the bigger picture, focus is back on 38.2% retracement of 0.8821 to 0.8863 at 0.8618. Strong rebound from there will retain medium term bullishness. Rise from 0.8221 should resume through 0.8863 at a later stage. Nevertheless, sustained break of 0.8618 will confirm that whole rise from 0.8221 has completed at 0.8863. Deeper decline should then be seen to 61.8% retracement at 0.8466 at least.
EUR/AUD Daily Outlook
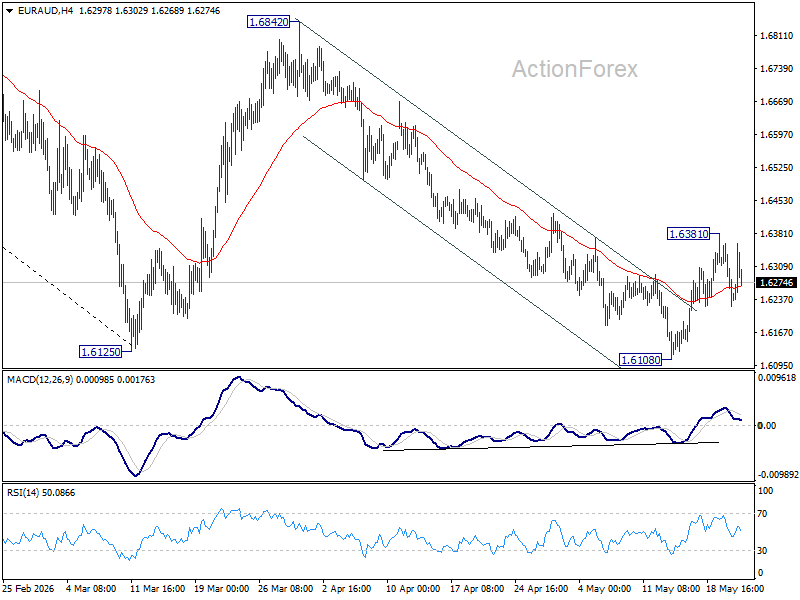
EUR/AUD is staying in range below 1.6381 and intraday bias stays neutral. Risk is mildly on the upside as long as 1.6108 support holds. Rise from there is seen as the third leg of the corrective pattern from 1.6125. Above 1.6381 will target 55 D EMA (now at 1.6444). On the downside, break of 1.6108 will resume larger fall from 1.8554 to 1.5913 fibonacci level.
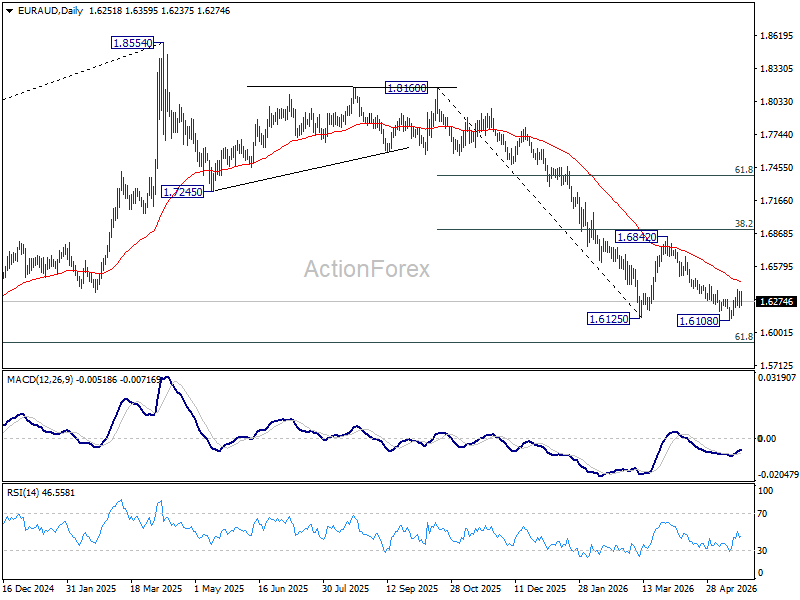
In the bigger picture, fall from 1.8554 (2025 high) is in progress and deeper decline should be seen to 61.8% retracement of 1.4281 to 1.8554 at 1.5913, which is slightly below 1.5963 structural support. Decisive break there will pave the way back to 1.4281 (2022 low). For now, risk will stay on the downside as long as 55 W EMA (now at 1.7012) holds, even in case of strong rebound.
EUR/CHF Daily Outlook
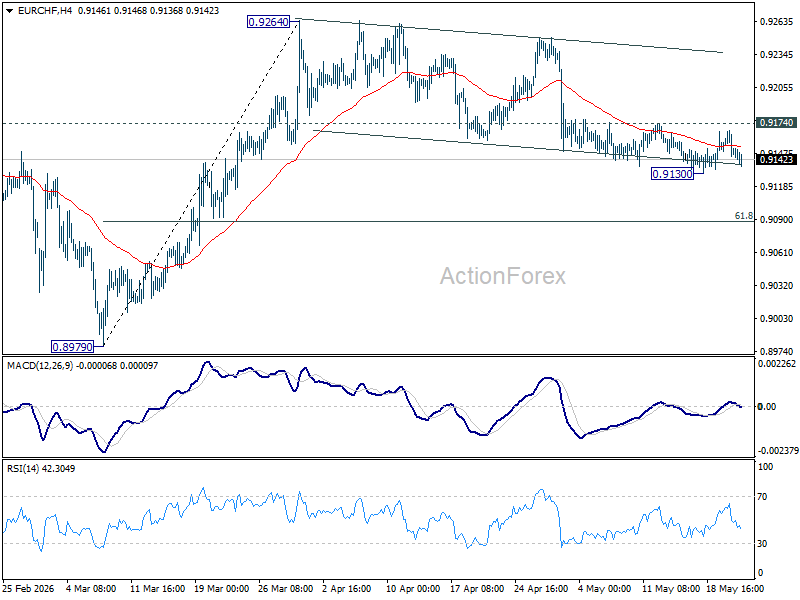
EUR/CHF is staying in range above 0.9130 and intraday bias stays neutral at this point. On the downside, below 0.9130 temporary low will extend the corrective fall from 0.9264 to 61.8% retracement of 0.8979 to 0.9264 at 0.9088. On the upside, however, break of 0.9174 will turn bias back to the upside for stronger rebound to retest 0.9264 high instead.
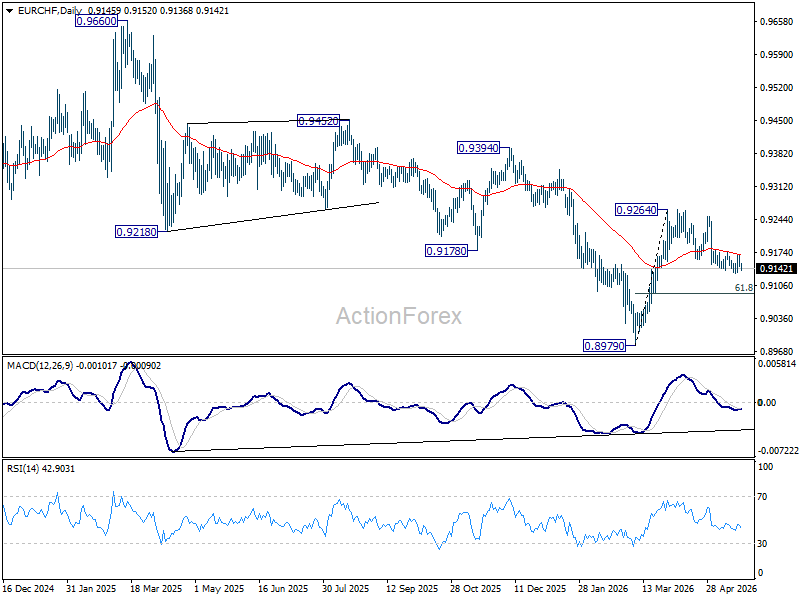
In the bigger picture, considering bullish convergence condition in W MACD, a medium term bottom should be in place at 0.8979. Sustained trading above 55 W EMA (now at 0.9241) will add more credence to this case. Further break of 0.9394 resistance will pave the way to 0.9660 resistance next. However rejection by the 55 W EMA will set up another fall through 0.8979 low at a later stage.
Fed Calmed the Markets Down
- The FOMC has started discussing rate hikes.
- Gold is under pressure amid Russia’s bullion sales.
The US dollar retreated as the odds of a year-end rate hike slipped from 57% to 52%, which was reflected in lower Treasury yields. Separately, equities were buoyed by NVIDIA’s first-quarter results and the SpaceX IPO filing.
The minutes of the April FOMC meeting showed that most officials are ready to raise rates if inflation persistently runs above 2%. At the same time, the overwhelming majority believe that bringing PCE back to target will take longer than previously assumed.
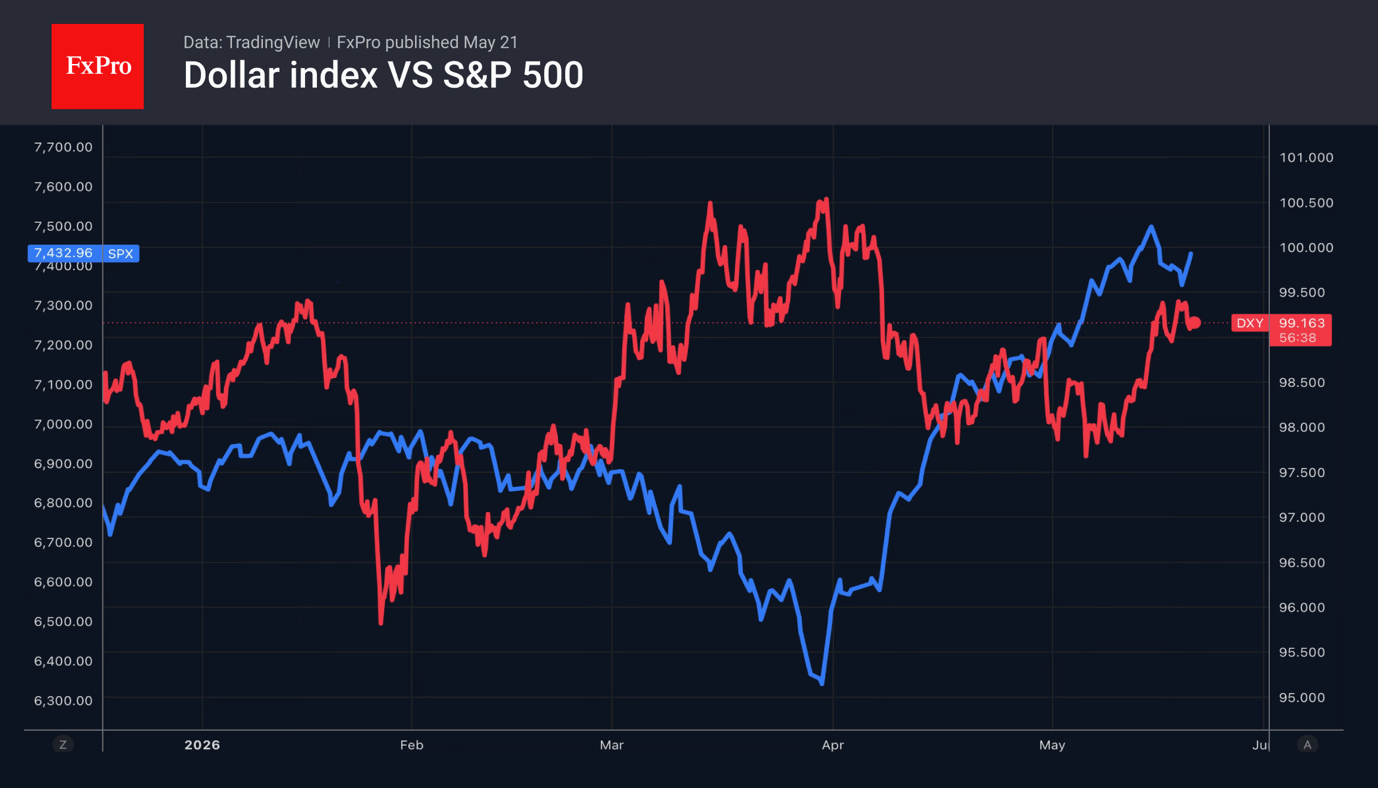
As a rule, a Fed pivot toward discussing rate hikes pushes Treasury yields higher and strengthens the dollar. This time, it played out differently, as markets saw that the central bank does not intend to ignore inflation. Nevertheless, over the medium term, expectations of a fed funds rate hike remain a bullish factor for the US currency.
The drop in Treasury yields was helped along by the largest Brent sell-off in two weeks, triggered by Donald Trump’s remarks. The President stated that the US is in the final stage of negotiations with Iran. However, the blockade of the Strait of Hormuz is accelerating the drawdown of global oil inventories. According to Goldman Sachs, in May, they are falling by 8.7 million b/d — twice as fast as at the start of the Middle East conflict.
If there is no progress toward a peaceful settlement, Brent will resume its rally, which would play into the dollar’s hands — especially in the event of further geopolitical escalation. Iran has vowed to respond harshly to any resumption of US military action, including by bombing countries beyond the Middle East.
The dollar’s retreat and falling Treasury yields allowed gold to find its footing. Even so, interest in the precious metal is being eroded by the highest yields in key sovereign bond markets since 2008.
Gold was also weighed down by news that Russia had sold gold, bringing its reserves to 73.9 million ounces — a four-year low.
Crypto Market is Creeping Upwards Across the Board
Market Overview
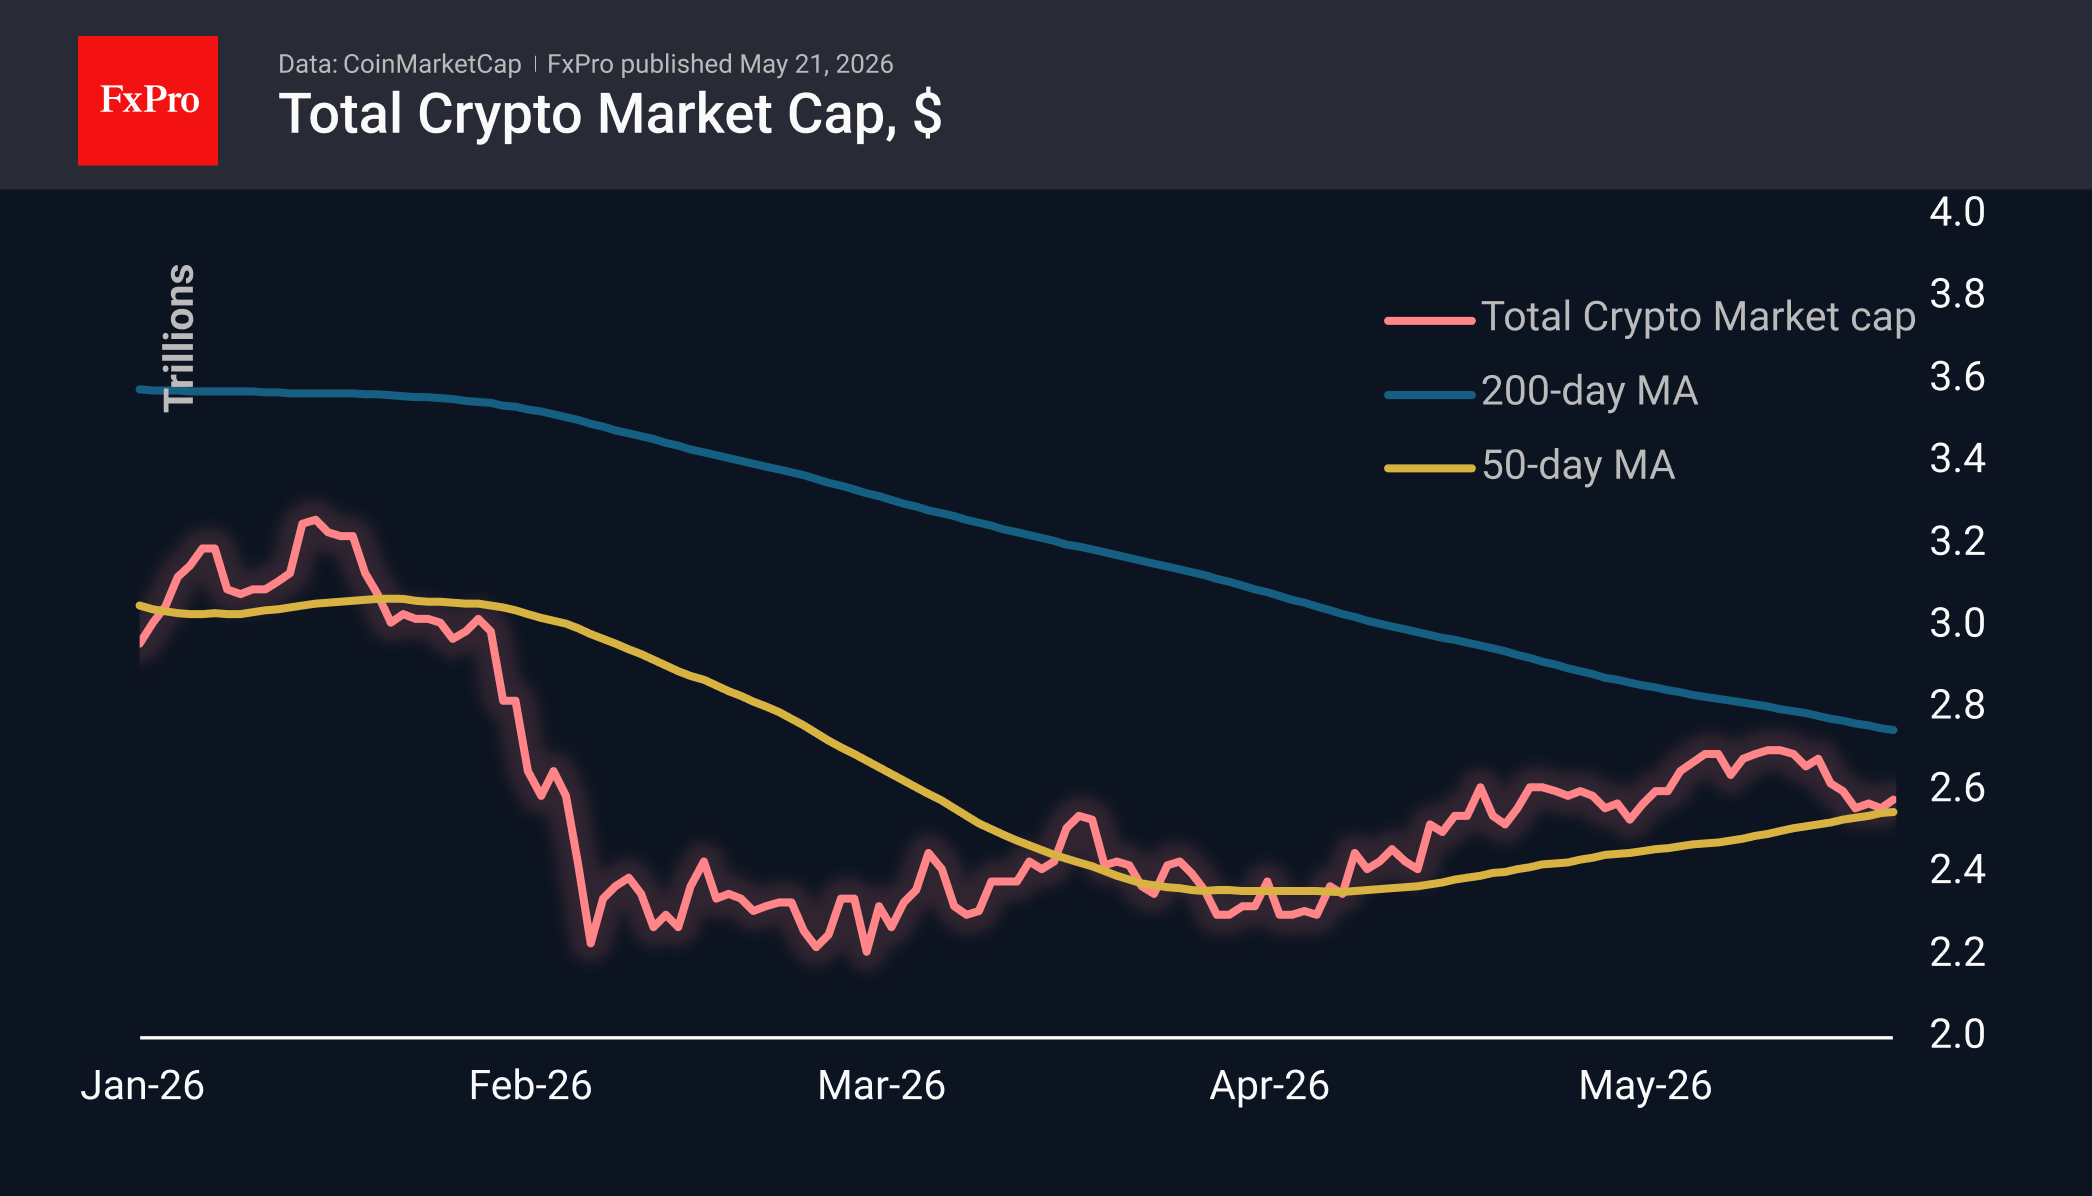
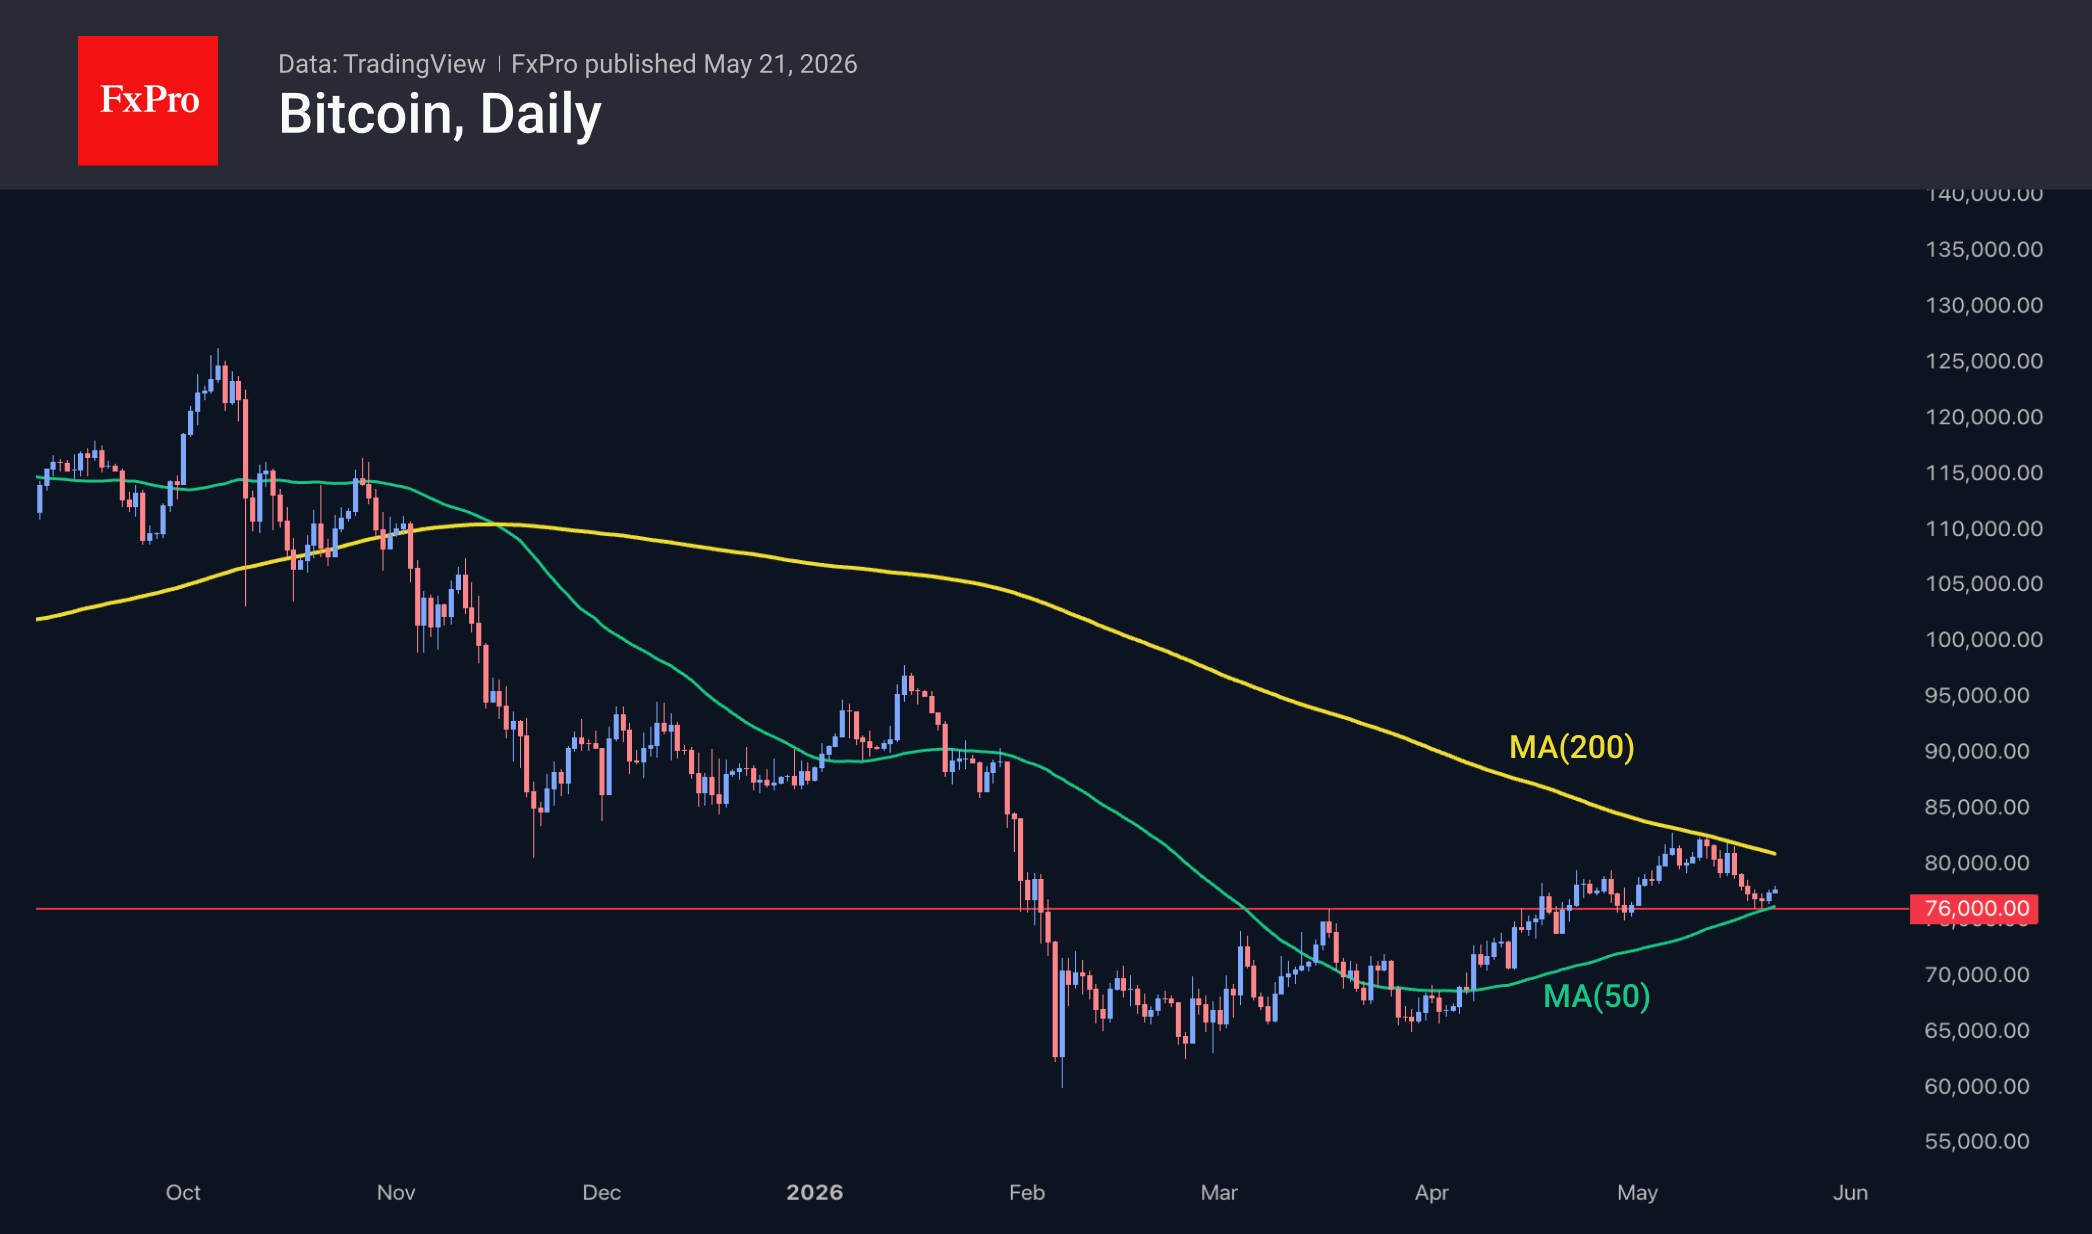
The crypto market capitalisation has risen by 1.3%, reaching $2.59T. The stock market’s return to growth has bolstered appetite for cryptocurrencies, allowing the market to rebound from the 50-day moving average. This could mark the start of a more sustained rally, similar to the one seen in April. Should the uptrend continue, the immediate resistance levels appear to be around $2.7T and $2.8T, where the previous local highs and the 200-day moving average are located, respectively. In terms of 24-hour performance, Zcash is once again leading the pack (+14%), followed by Dash (+8%) and the volatile Toncoin (+6.3%). Performing worse than the rest but still in positive territory are Hedera (+0.1%), Ethereum Classic (+0.2%), and Cardano (+0.4%). This is a good indicator of the breadth of buying in the crypto market.
Bitcoin is trading at $78K, rising for the third day in a row after rebounding from the 50-day moving average and the area of recent local lows. The rebound looks fairly cautious so far. Likely, altcoins are currently attracting some retail buyers, while institutional investors are cautiously selling ETFs ahead of a quieter market and focusing on big tech.
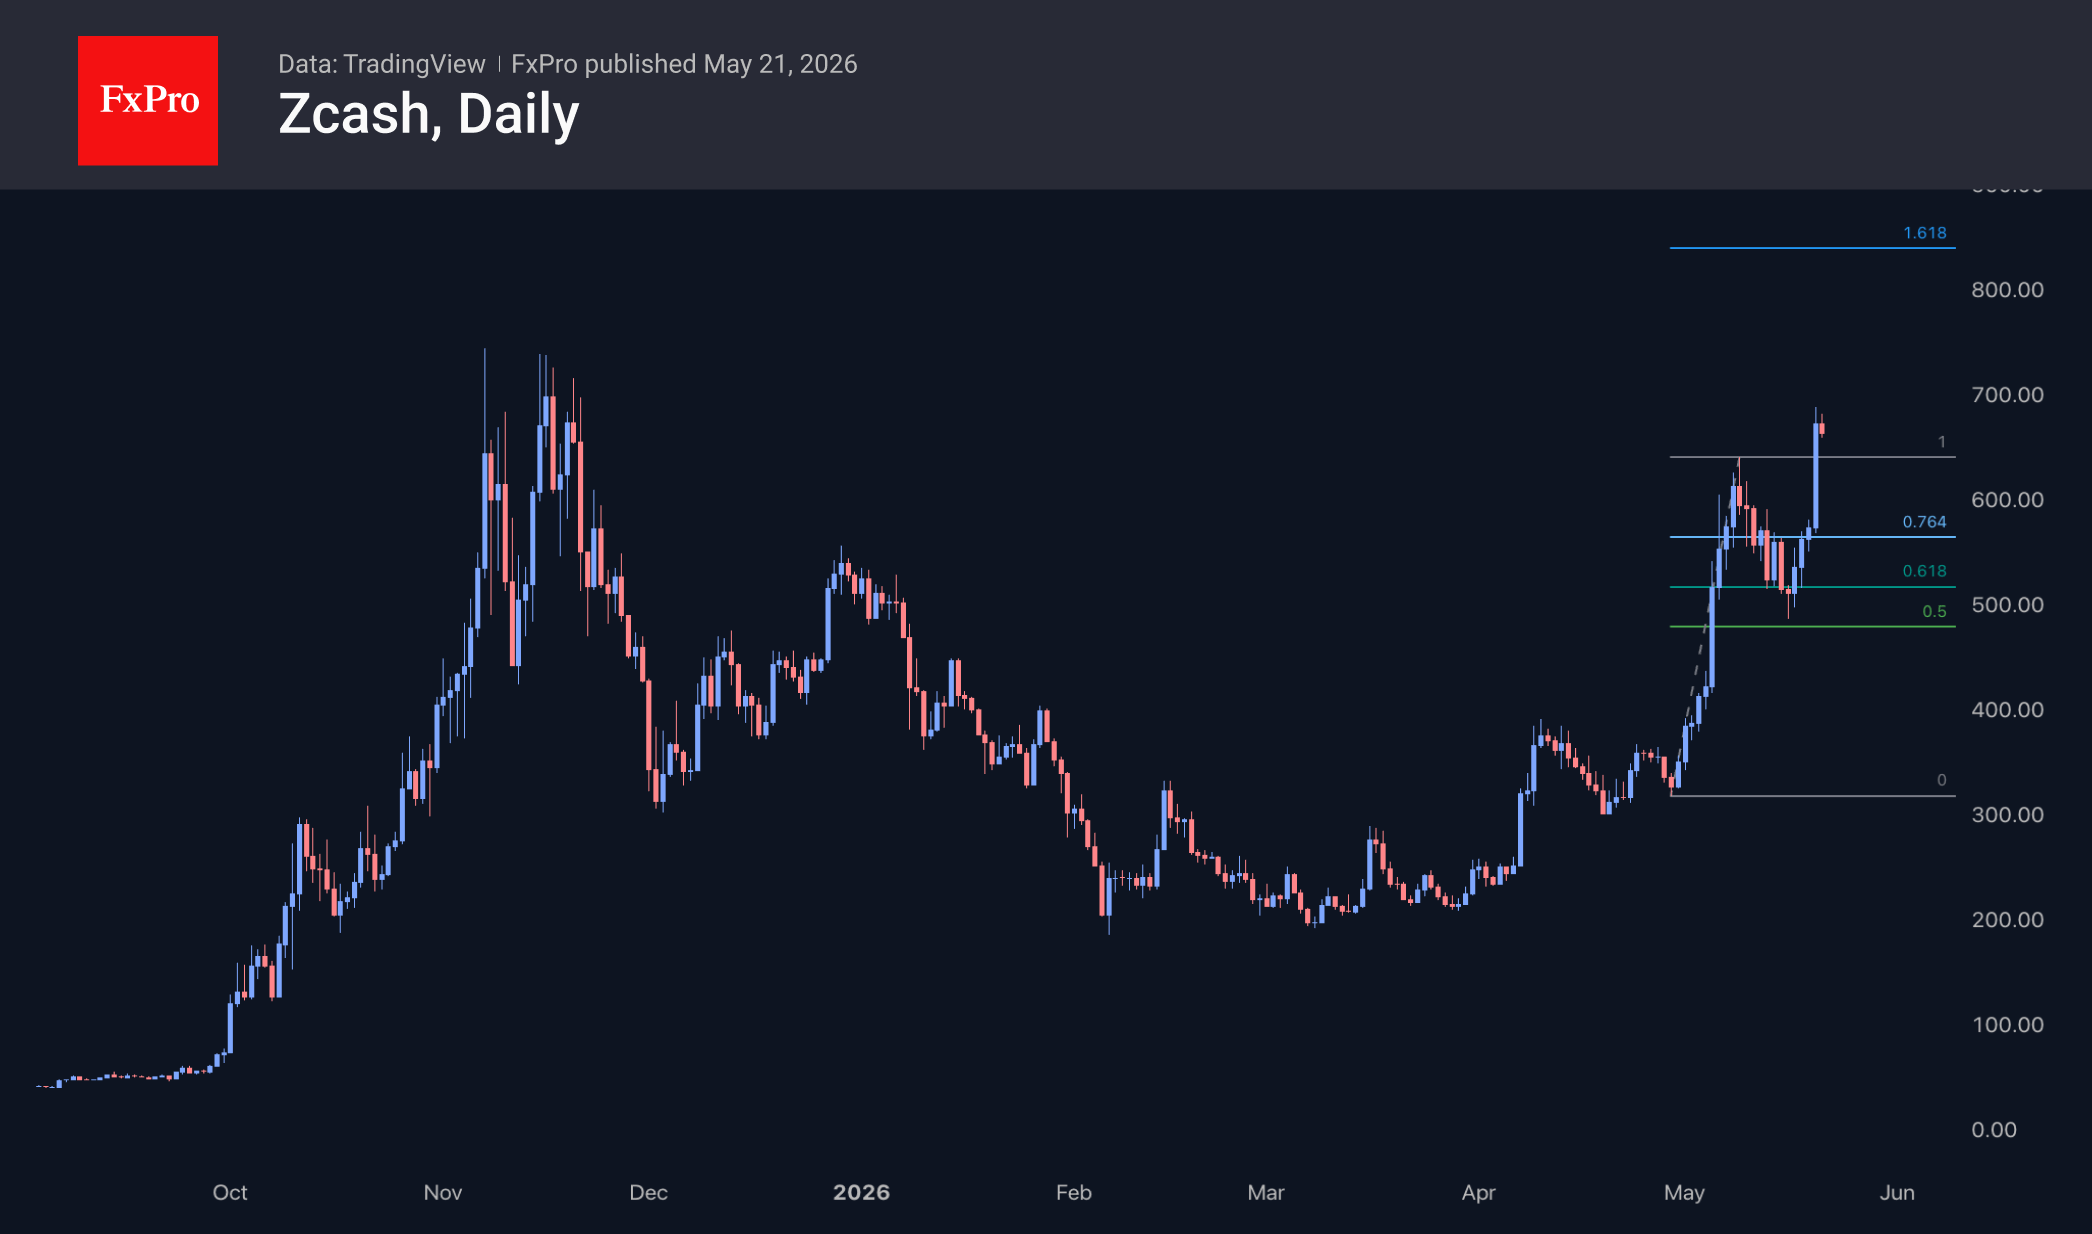
Zcash surged to $688 on Wednesday, surpassing the start-of-month highs and bringing the price back into the region of the November 2025 highs. The corrective pullback from 9–16 May wiped out half of the gains from the early-month rally. This is deeper than a typical correction, but not uncommon for volatile markets. The Fibonacci extension suggests a target of $840, which would bring the price back to the peak levels seen in early 2018. Historically, Zcash has surged when the crypto market peaks, and the current rally marks a departure from that pattern.
News Background
US President Donald Trump has signed an executive order to integrate cryptocurrencies into the traditional financial system and to revise rules governing crypto companies’ access to payment infrastructure. A period of 180 days has been allocated to implement measures to support innovation.
The presence of US Treasury bills in their portfolios does not guarantee Tether and Circle protection against a sudden liquidity crisis, warns Union Investment. The largest stablecoin issuers’ investments in gold and Bitcoin are more reminiscent of a speculative fund than a conservative monetary instrument.
According to Defillama, the total market capitalisation of stablecoins has reached another all-time high, exceeding $323 billion. USDT and USDC account for approximately 59% and 24% of the total market.
BNB Chain developers have reported on the results of testing the network’s transition to post-quantum cryptography. The experiment confirmed the blockchain’s theoretical readiness for future threats but revealed a significant drop in performance.
GBP/CHF Rebounds as UK Fiscal Worst-Case Fears Fade, Head-and-Shoulders Bottom Forming?
Sterling strengthened broadly on this week, but the rebound was driven less by optimism over the UK economy and more by the easing of immediate political and fiscal fears that had weighed heavily on British assets in recent weeks. Markets appeared willing to scale back worst-case scenarios involving political instability, fiscal slippage, and runaway inflation risks, helping support Pound against lower-yielding safe havens such as Swiss Franc.
A key source of reassurance came from comments by Andy Burnham, currently viewed by bookmakers as one of the leading potential successors to Prime Minister Keir Starmer following Labour’s internal fractures and recent local election setbacks. Burnham explicitly softened earlier anti-market rhetoric, saying he respected “the boundaries of the bond markets” and supported maintaining strict Treasury fiscal rules alongside “a plan to get debt down.” Those comments helped calm fears of a disorderly shift toward aggressive deficit spending or a repeat of the type of fiscal panic seen during the 2022 mini-budget crisis. The reduction in fiscal risk premium coincided with improving global sentiment after oil prices retreated from recent highs.
The International Monetary Fund also offered some support after upgrading the UK’s 2026 growth forecast, despite previously warning Britain could be among the advanced economies most vulnerable to the Iran war shock. While the UK economy still faces mounting stagflation risks from elevated energy costs and slowing domestic demand, the combination of easing oil panic and reduced political uncertainty has helped stabilize Sterling near term.
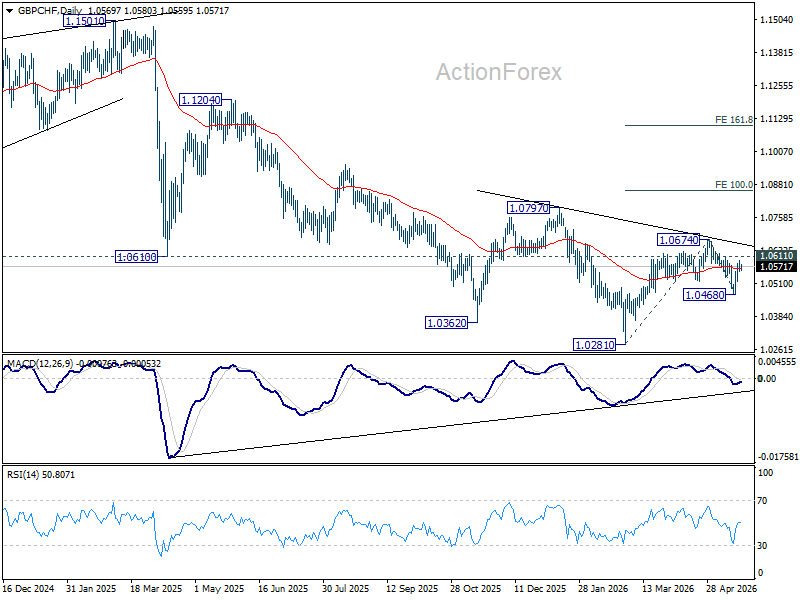
Technically, GBP/CHF’s rebound from 1.0468 suggests a short-term bottom may already be in place. Immediate focus now turns to 1.0611 resistance. A decisive break there would reinforce the bullish near-term case and expose 1.0674 next.
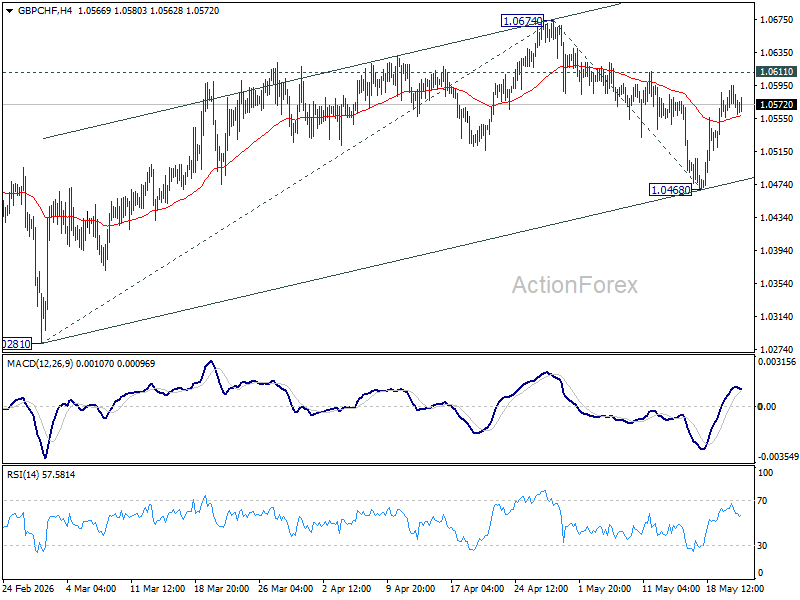
More importantly, sustained break above 1.0674 would complete a head-and-shoulders bottom pattern (ls: 1.0362, h: 1.0281, rs: 1.0468). Such a breakout would likely pave the way trhough 1.0797 resistance and eventually 100% projection of 10821 to 1.0674 from 1.0468 at 1.0861.
However, failure to break 1.0611 followed by a move back below 1.0468 would instead revive downside risks and bring a retest of the 1.0281 low back into focus.
UK PMI Composite Falls Into Contraction as BoE Faces “Major Quandary”
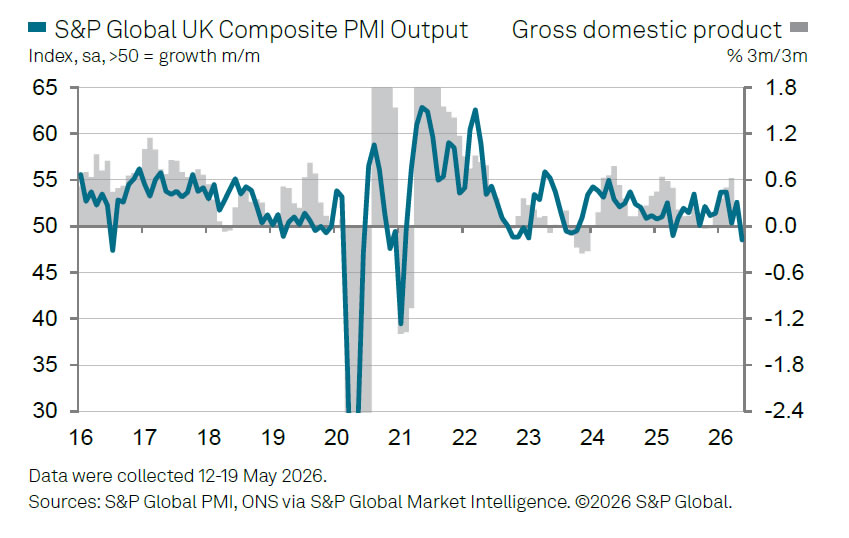
UK business activity deteriorated sharply in May as the economy was hit by a combination of Middle East-related energy pressures and rising domestic political uncertainty. Flash UK Composite PMI Output Index plunged from 52.6 to 48.5, its lowest level in 13 months and firmly back into contraction territory. The decline was driven overwhelmingly by the services sector, where Business Activity Index collapsed from 52.7 to 47.9, marking a 64-month low. Manufacturing activity remained comparatively resilient, with Manufacturing PMI holding steady at 53.7 and Manufacturing Output Index edging up to a three-month high of 52.4.
S&P Global’s Chris Williamson warned the UK economy is facing a “perfect storm,” with businesses increasingly reporting falling output, supply shortages, rising inflation pressures, and job cuts. According to Williamson, the latest PMI data point to the economy contracting at roughly a -0.2% quarterly pace in Q2, a sharp reversal from the stronger growth seen earlier this year. He noted that while the Middle East conflict remains the primary drag on activity through higher energy costs and supply disruptions, domestic political uncertainty is also increasingly damaging business confidence and investment decisions.
The survey also reinforced growing stagflation concerns for the Bank of England. Williamson warned that prices are “surging higher” even as economic activity weakens, with precautionary stockpiling still temporarily supporting manufacturing output. However, he cautioned that this support will likely fade once inventories are rebuilt.
The combination of slowing growth and rising inflation leaves the BoE in what Williamson described as a “major quandary,” as policymakers face growing pressure to contain inflation without pushing the economy deeper toward recession.
| Indicator | Previous | Latest |
|---|---|---|
| Composite PMI Output Index | 52.6 | 48.5 |
| Services PMI Business Activity Index | 52.7 | 47.9 |
| Manufacturing PMI | 53.7 | 53.7 |
| Manufacturing Output Index | 51.8 | 52.4 |
GBP/USD Recovers Amid UK Inflation Data: Positive Signals Emerge
GBP/USD was trading at 1.3428 on Thursday, following a period of volatility after the release of UK inflation data, which came in weaker than expected despite geopolitical tensions over Iran and rising oil prices.
The UK Consumer Price Index (CPI) slowed to 2.8% in April, down from 3.3% in March, while the market had anticipated a reading of 3%.
The market interpreted these figures as a signal that the Bank of England may not need to raise interest rates aggressively in the near term. This has reduced expectations of further tightening and weighed on the pound.
Weak labour market data in the UK added to the negative sentiment. Recent statistics indicated a slowdown in hiring and a decline in new vacancies, reflecting the impact of the broader economic environment.
It is important to note that the effect of slower inflation may be temporary. Since the onset of the Iran conflict, global oil prices have increased by approximately 50%, and this rise is likely to feed into the UK economy and consumer prices over time.
Technical Analysis
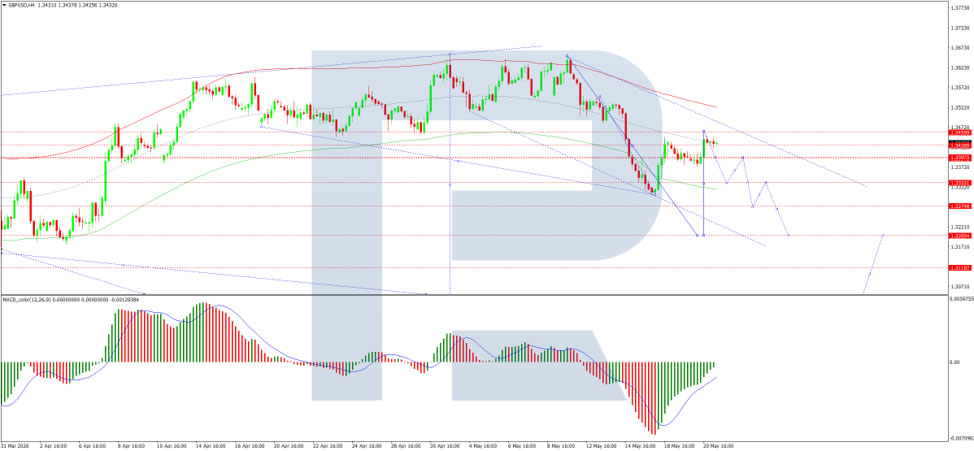
On the H4 GBP/USD chart, the pair is trading within a broad consolidation range above 1.3388, currently extending up to 1.3490. A move lower towards 1.3380 is likely. After this, the pair may consolidate, with potential to move to 1.3515 on the upside or decline towards 1.3200 on the downside. The MACD indicator supports this scenario, with the signal line below zero and pointing firmly downwards.
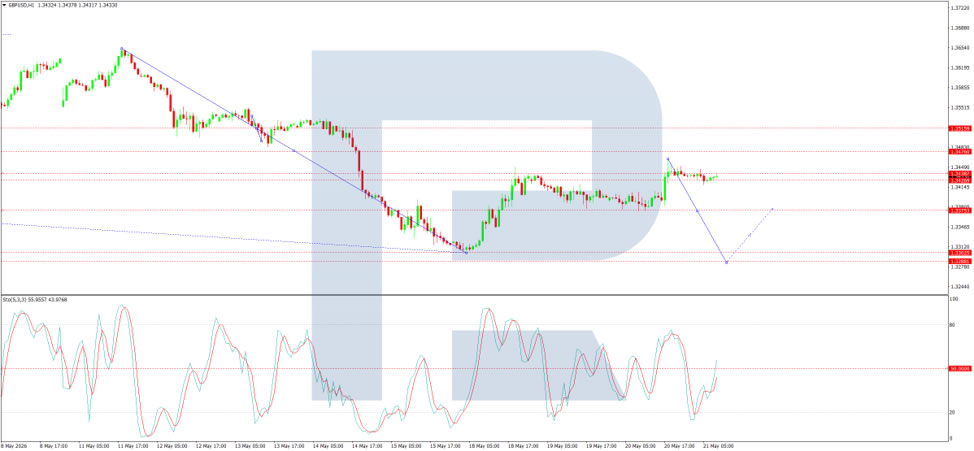
On the H1 chart, GBP/USD is trading within a compact consolidation range around 1.3434, currently extending up to 1.3464. A move lower towards 1.3333 is possible. The Stochastic oscillator confirms this scenario, with its signal line below 50 and pointing firmly downwards towards 20.
Conclusion
GBP/USD stabilised following weaker-than-expected UK inflation data, easing concerns about aggressive Bank of England rate hikes. However, the pound faces headwinds from a soft labour market and rising oil prices, suggesting that any recovery may be short-lived. Technical indicators point to a near-term correction before a potential continuation of the broader trend.
Eurozone PMI Composite Falls to 31-Month Low, Signals -0.2% Q2 GDP Contraction
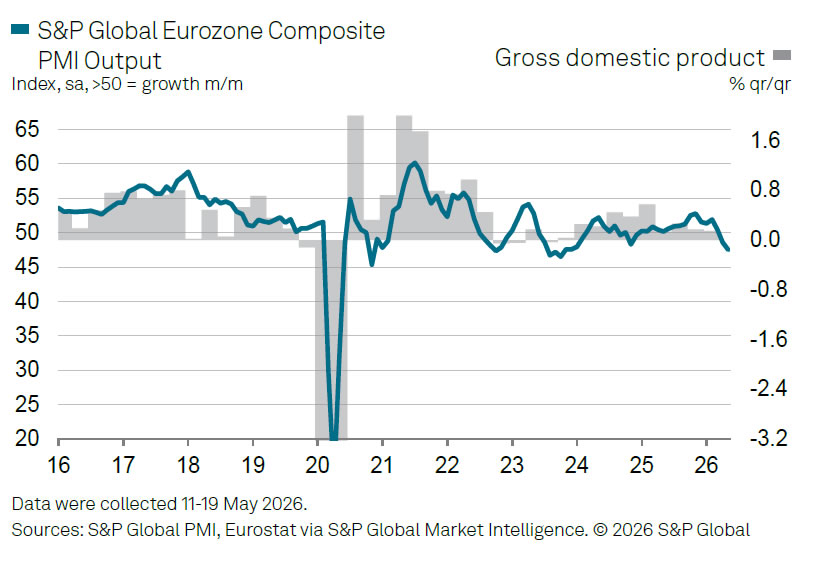
Eurozone business activity deteriorated further in May as the ongoing Middle East energy shock increasingly weighed on demand, confidence, and employment across the region. Flash Eurozone Composite PMI Output Index fell from 48.8 to 47.5, its lowest level in 31 months. Services PMI Business Activity Index dropped from 47.6 to 46.4, marking a 63-month low. Manufacturing activity also softened, with Manufacturing PMI easing from 52.2 to 51.4 and Manufacturing Output Index declining from 52.3 to 51.0.
According to S&P Global’s Chris Williamson, the latest survey data suggest the Eurozone economy is now on track to contract by around -0.2% in Q2. “Output has now contracted for two successive months, with the rate of decline accelerating in May to its highest for just over two-and-a-half years,” he said. The services sector was hit particularly hard as rising energy costs and broader cost-of-living pressures increasingly squeezed household demand. While manufacturing had previously found some support from precautionary stockpiling, Williamson noted that this boost is now beginning to fade as demand for both goods and services weakens.
The survey also highlighted growing stagflation risks for the region. Supply chain disruptions linked to the war are intensifying again, raising the risk of further shortages and additional inflation pressure in the months ahead. Williamson warned that the latest price gauges already point to inflation “running close to 4% in the coming months,” even as growth momentum deteriorates rapidly. The combination of slowing activity, rising job losses, and persistent inflation pressures is likely to deepen the policy dilemma facing the European Central Bank in the second half of the year.
| Indicator | Previous | Latest |
|---|---|---|
| Composite PMI Output Index | 48.8 | 47.5 |
| Services PMI Business Activity Index | 47.6 | 46.4 |
| Manufacturing PMI | 52.2 | 51.4 |
| Manufacturing Output Index | 52.3 | 51.0 |
Euro and Sterling Strengthen After Volatile Support Tests
EUR/USD and GBP/USD have moved into recovery mode following a sharp test of key support levels, although the market remains cautious ahead of the release of important macroeconomic data from the US, the eurozone and the UK. Earlier this week, the European currencies came under pressure: GBP/USD fell towards the 1.3300 area, while EUR/USD tested support at 1.1600. However, the successful defence of these levels triggered active profit-taking on the US dollar and a subsequent corrective rebound in the European currencies.
In the coming trading sessions, investors’ attention will focus on the publication of PMI business activity indices in the eurozone, the UK and the US, as well as US housing market data and jobless claims statistics. The market is assessing signs of a further slowdown in the US economy following recent indications of weakening business activity, which is partly limiting the potential for further dollar appreciation.
EUR/USD
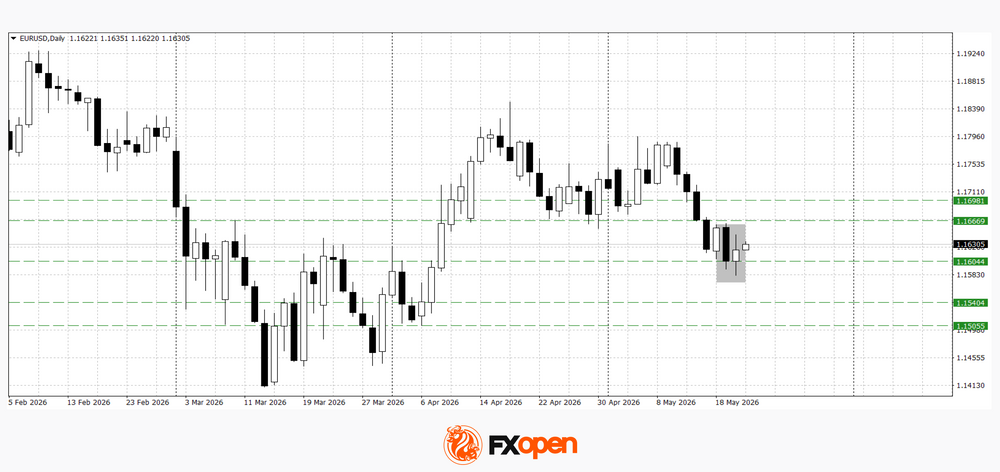
The EUR/USD pair recovered after testing support at 1.1600. Technical analysis of EUR/USD points to the possibility of growth towards 1.1670–1.1700, as a bullish piercing candlestick pattern has formed on the daily timeframe. Should yesterday’s low be broken, the pair may decline towards the 1.1540–1.1500 area.
Key events for EUR/USD:
- today at 10:15 (GMT+3): France Manufacturing PMI;
- today at 10:30 (GMT+3): Germany Composite PMI;
- today at 15:30 (GMT+3): Philadelphia Fed Manufacturing Index (US).
GBP/USD
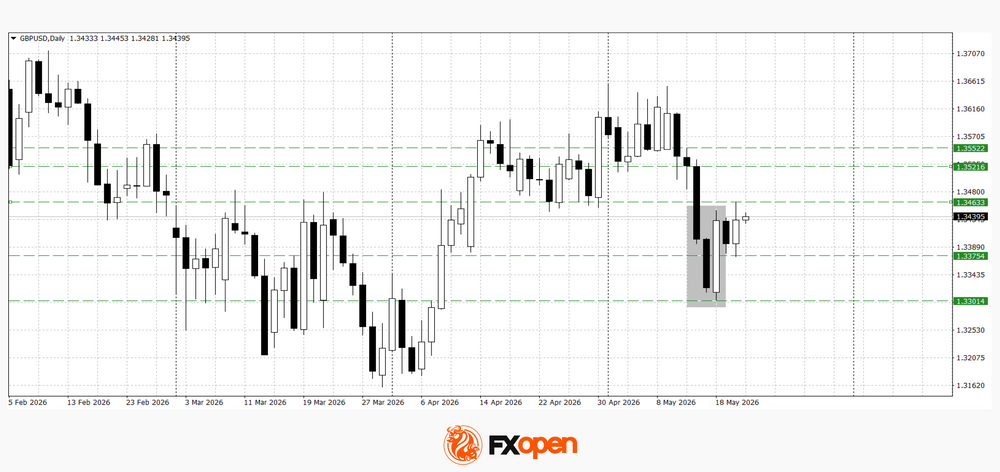
The GBP/USD pair fell sharply at the start of the week towards the important support level at 1.3300. The rebound from this support, followed by a recovery towards 1.3440, allowed a bullish engulfing reversal pattern to form. Technical analysis of GBP/USD suggests the potential for further growth towards 1.3520–1.3550 if the pair manages to consolidate above 1.3460. A move below yesterday’s low could trigger another test of 1.3300.
Key events for GBP/USD:
- today at 11:30 (GMT+3): UK Composite PMI;
- today at 16:45 (GMT+3): US Manufacturing PMI;
- today at 18:00 (GMT+3): speech by Bank of England Governor Bailey.
Overall, EUR/USD and GBP/USD are attempting to extend their recovery after sharply testing key support levels. However, the market has yet to receive sufficient fundamental confirmation for the formation of a полноценный upward trend. Upcoming macroeconomic data from the US, the eurozone and the UK will be the key driver of further price action: weak US figures could increase pressure on the dollar and support further gains in the European currencies, while stronger data may return the market to a bearish scenario and keep trading confined within established ranges.
Trade over 50 forex markets 24 hours a day with FXOpen. Take advantage of low commissions, deep liquidity, and spreads from 0.0 pips (additional fees may apply). Open your FXOpen account now or learn more about trading forex with FXOpen.
This article represents the opinion of the Companies operating under the FXOpen brand only. It is not to be construed as an offer, solicitation, or recommendation with respect to products and services provided by the Companies operating under the FXOpen brand, nor is it to be considered financial advice.