Sample Category Title
S&P 500: Beijing Optimism Overshadowed by Debt Risks
Fundamental Background
On 14–15 May, a high-level US–China summit took place in Beijing, where both sides discussed the potential easing of trade tensions and certain mutual concessions. Against a backdrop of positive expectations, the S&P 500 closed above 7,500 points for the first time, while the Dow Jones returned to the psychologically significant 50,000 mark.
At the same time, markets continue to feel pressure from US debt-related risks: the country’s credit rating remains below the highest tier, while the growing federal budget deficit and accumulated debt burden are increasing investors’ sensitivity to fiscal risks. The combination of trade optimism and budgetary vulnerabilities is creating a mixed and more volatile fundamental backdrop for the S&P 500.
Technical Picture
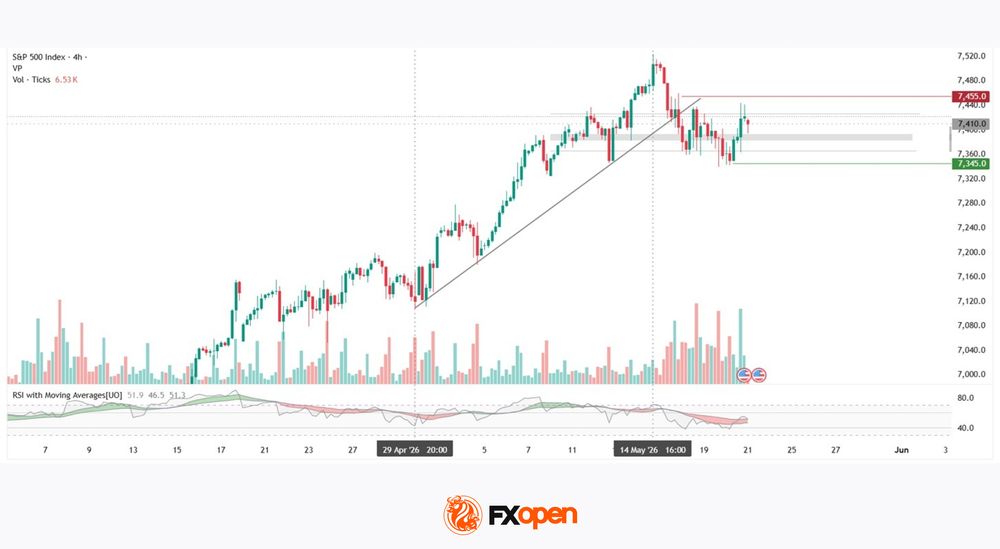
Since March 2026, the S&P 500 has remained in a medium-term uptrend, and between 29 April and 14 May it formed a new trending leg within the broader trend, reaching a peak around 7,520. The trend was subsequently broken, while trading volume increased noticeably, signalling heightened market participation. As a result of the standoff between equally matched buyers and sellers, the index has shifted into sideways movement and is currently determining its future direction.
The POC zone within the profile is concentrated around 7,385–7,390 — this is where the main area of confrontation is forming.
At present, the price remains above this zone (POC), but below the upper profile boundary at 7,425. Should the price resume its trend movement, the red resistance level at 7,455 may act as a limiting factor. The green support level at 7,345 remains a potential reference point should quotations move below the profile. RSI + MAs currently show readings of 51, 46 and 51 — the oscillator indicators remain in neutral territory, with no clearly defined directional momentum.
Key Takeaways
The index has completed its short-term bullish impulse and moved into sideways consolidation. RSI readings near neutral levels, without a pronounced directional impulse, reflect the current balance in the market — investors are weighing uncertainty surrounding trade negotiations against the backdrop of continued sensitivity to fiscal risks.
Trade global index CFDs with zero commission and tight spreads (additional fees may apply). Open your FXOpen account now or learn more about trading index CFDs with FXOpen.
This article represents the opinion of the Companies operating under the FXOpen brand only. It is not to be construed as an offer, solicitation, or recommendation with respect to products and services provided by the Companies operating under the FXOpen brand, nor is it to be considered financial advice.
Sunrise Market Commentary
Markets
Bond markets took a benign start yesterday after substantial losses over the previous sessions. In US dealings, headline driven action accelerated the move. One can argue whether it was real believe or just hope that a solution to the Iran conflict was coming closer. Whatever, headlines referring to sources close to Iran negotiators and President Trump repeating that the US was in final stages with Iran, triggered a Pavlov reaction. (Brent) Oil dropped from the $110/b+ area to near $105. Bond markets joined. After touching peak levels on Tuesday, German yields ceded between 10.2 bps (2-5 y sector) and 7.2 bps (30-y). US yields eased between 9.1 bps (5-y) and 5.6 bps (30-y). Minutes from the April FOMC meeting confirmed that the Fed is growing more concerned that it would take longer to return inflation back to target. In this respect, many officials advocated to remove the easing bias as some policy firming could be appropriate if inflation were to continue to run persistently above 2%. The less soft bias from the Minutes had hardly any impact on the bond-friendly intraday market momentum. UK gilts outperformed Bunds and Treasuries. They enjoyed softer than expected UK April CPI data. At a hearing before a Parliament Committee, BoE governor Bailey and other MPC members took quite a cautious approach on the need for tightening/rate hikes. Amongst others, they argued that conditions had already tightened due to the removal of rate cut expectations, giving the BoE time to assess the situation with the picture on growth and labour market softening. Markets at least for now turned their focus away from political and fiscal issues. UK yields declined between 13-14 bps across the curve. The relief rally on bond markets also triggered a further intraday improvement in equity sentiment. US indices rebounded up to 1.54% (Nasdaq). The Eurstoxx 50 gained 2.13%. Investors, both in bonds and equities apparently still are some kind of afraid to miss a rally on (hoped for) good news from the conflict in the Middle East. Moves in FX were again much more muted. DXY gave up on intraday gains but still closed north of 99. EUR/USD regained the 1.16 big figure. Sterling won modestly despite the loss of interest rate support (EUR/GBP 0.865).
Asia equites mostly join the risk-rebound this morning even as Investors reacted rather lukewarm to solid Nvidia results. Bond markets show no clear direction after yesterday’s rally. Idem for the dollar. EMU, and to a lesser extent US, PMI’s provide an update both on activity and prices pressures as supply chain disruptions from the Iran conflict continue. On Europe, the narrative might be stagflationary. With an initial 50 bps of ECB rate hikes priced in up until the September meeting, the market reaction might be muted, focusing again on headline news.
News & Views
Australian employment shrank by 18.6k last month. That followed an upwardly revised +23.3k growth registered in March. Both full-time (-10.7k) and part-time (-7.9k) employment fell. The number of unemployed rose by 33k, triggering an unexpected increase in the unemployment rate to 4.5% from 4.3% - the highest since end-2021. The participation rate eased a tad to 66.7%. Despite the fall in employment, hours worked rose, resulting in a 0.9% increase in hours worked per person. The sub-par labour market report doused some speculation for further rate hikes by the Reserve Bank of Australia. The central bank already did so three times in the face of stubbornly high and rising inflation before considering itself now “well placed to respond to developments”. That was taken by markets as the RBA headed towards a pause in the tightening cycle. Money markets currently still bet on one additional move by the end of the year. The Aussie dollar loses some ground today with AUD/USD easing to 0.712.
The Japan May PMI retreated to 51.1 from 52.2, the softest in five months. It still indicates economic expansion (>50), driven solely by the manufacturing sector (54.5 from 55.1). Services (50 from 51) stagnated for the first time in over a year. Stockpiling in response to the Middle East war continued to drive manufacturing (54.1 from 55.1). Japanese companies continued to report intense cost pressures. Input costs rose at a substantial pace that was the fastest since late-2022, particularly in manufacturing, on supply disruptions and raw material shortages. Own selling prices as a result increased again with the rate of charge across both sectors the sharpest in nearly 19 years of data collection. Japanese firms were generally upbeat in May for the year ahead. Optimism edged to a three-month high to nevertheless remain historically subdued. The Japanese yen shrugged at the PMIs. USD/JPY trades around 159.
BoJ’s Koeda Says Oil-Driven Inflation Risks Could Justify Further Rate Hikes
Bank of Japan board member Junko Koeda said on Thursday that persistent inflation pressures linked to the Middle East conflict could justify further interest rate hikes, adding to a growing chorus of hawkish voices inside the central bank. Speaking in Fukuoka, Koeda said there was “some possibility that underlying inflation may exceed 2% looking ahead” as elevated oil prices continue feeding through the economy. She added that recent increases in long-term inflation expectations also “warranted attention.”
Koeda stressed that her view was based on the risk that energy-driven inflation proves more persistent than initially expected. “I believe it's reasonable to raise the policy interest rate at an appropriate pace to address high inflation, while also considering the trade-offs for the economy,” she said.
She also warned that “developments over the past month or two may have increased the likelihood of a risk scenario in which high crude oil prices persist.” Her comments suggest she may align more closely with the hawkish faction on the board pushing for earlier normalization, though they do not necessarily represent the consensus position of the BoJ as a whole.
At the same time, Koeda argued Japan’s economy remains resilient enough to withstand tighter policy, citing a positive output gap and strong global IT demand. She also highlighted growing concern over the side effects of maintaining deeply negative real interest rates for too long, warning policymakers must pay greater attention to distortions caused by excessively accommodative settings.
Bitcoin (BTCUSD) Surges Higher From Key Support Zone
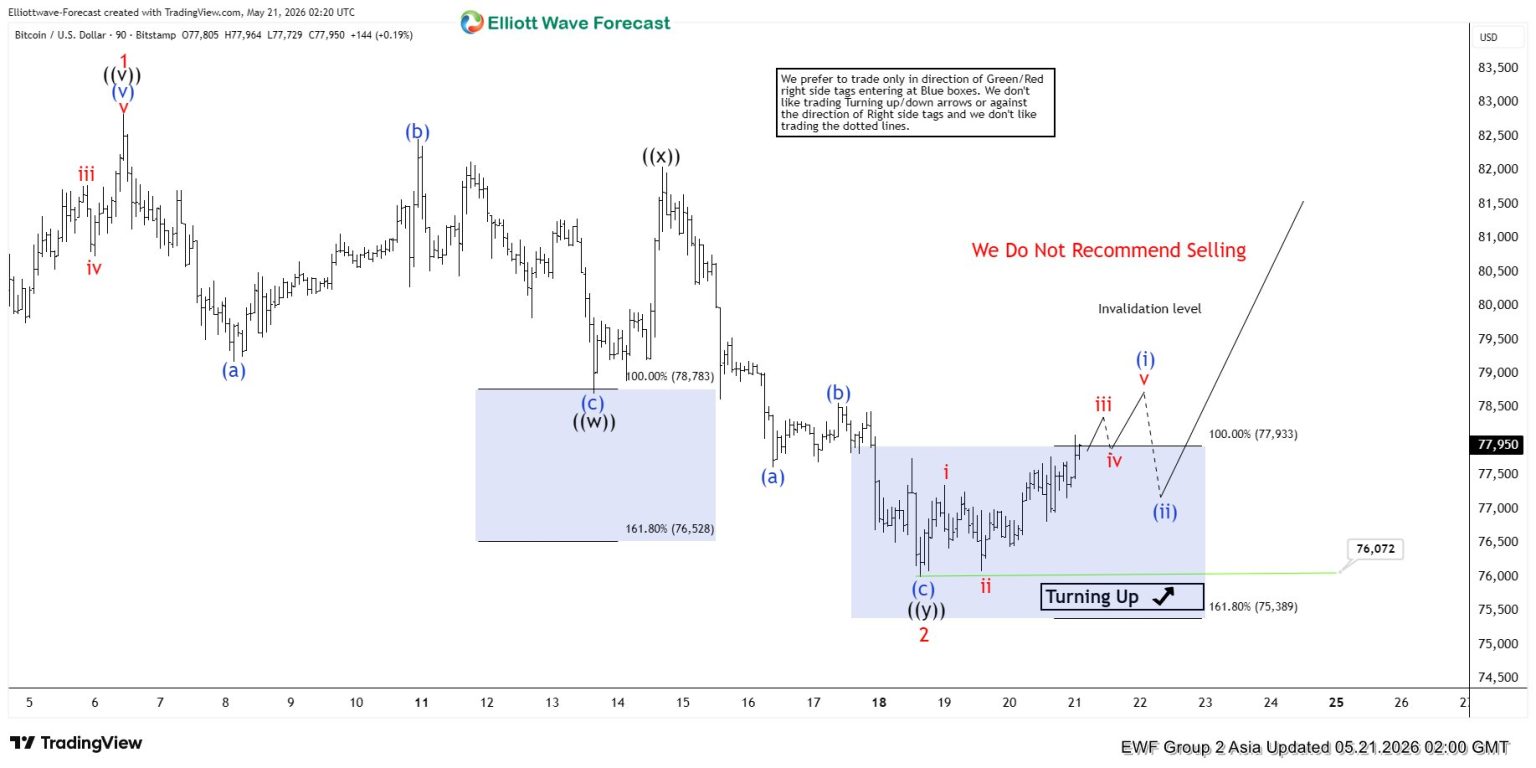
The short‑term Elliott Wave outlook for Bitcoin (BTCUSD) shows the rally from the March 29 low concluded as wave 1 at $82,833. After this peak, the market corrected in wave 2, unfolding as a double three Elliott Wave structure. From the wave 1 high, wave (a) ended at $79,168. The rally in wave (b) reached $82,458. Wave (c) then dropped to $78,704, completing wave ((w)) at a higher degree. Bitcoin rebounded in wave ((x)), which finished at $82,047, setting up the next decline.
The cryptocurrency extended lower in wave ((y)), which subdivided into a zigzag structure. From the wave ((x)) high, wave (a) ended at $77,614. A modest rally in wave (b) concluded at $78,573. The final leg, wave (c), dropped to $76,072, completing wave ((y)) of wave 2 at a higher degree. This decline brought Bitcoin into the blue box support zone, defined by the 100% to 161.8% Fibonacci extension of wave ((w)). Buyers responded at this level, producing a turn higher. Near term, as long as the pivot at $76,072 remains intact, Bitcoin is expected to extend its rally.
Bitcoin (BTCUSD) 90-Minute Elliott Wave Chart
BTCUSD Elliott Wave Video:
https://www.youtube.com/watch?v=hPYseqTBZ2k
Relief Rally in Stock Markets as Trump Signals Final Stages of US-Iran Peace Deal
Key Takeaways
- Global markets staged a strong relief rally after US President Donald Trump signalled that a US-Iran peace deal is entering its “final stages,” triggering a sharp unwind in geopolitical risk premiums and sending oil prices down 5%.
- NVIDIA delivered blockbuster Q1 earnings with revenue surging 85% year-over-year to US$81.6 billion, but its share price dropped 1.3% in after-hours trading.
- Federal Reserve policymakers remain concerned about persistent inflation, with the latest Fed minutes showing openness toward potential future rate hikes, even as bond yields temporarily eased from recent multi-decade highs.
- Chart of the day: AUD/USD bearish reaction after retest on 20-day MA, reversing almost all of Wednesday’s gains. 0.7180 key short-term resistance to maintain intraday bearish sentiment on the Aussie.
Top Macro Headlines
- US-Iran peace deal reaches “final stages”: Global risk sentiment shifted drastically after US President Donald Trump announced that the United States and Iran are in the “final stages” of negotiating a peace deal to end the conflict. Trump previously called off a planned retaliatory strike following a new proposal from Tehran, snapping a multi-day market panic.
- NVIDIA destroys expectations with blowout earnings but shares slide 1.3% after-hours: Chip giant NVIDIA reported record-shattering earnings for the April quarter, with sales reaching US$81.6 billion, up 85% year-over-year, and net income more than tripling to US$58.3 billion. The numbers beat analyst expectations across the board, supporting its position as the world's most valuable publicly listed company at a US$5.5 trillion market cap.
- Fed minutes reveal openness to rate hikes: The newly released minutes from the Federal Reserve's April policy meeting showed that multiple policymakers remain open to an interest rate hike if inflation proves persistent. The committee all but retired the rate-cut debate as structural price pressures linger ahead of incoming Fed Chair Kevin Warsh taking the helm.
- SpaceX files for massive history-making IPO: Elon Musk's SpaceX officially filed for its long-awaited initial public offering. Looking to raise tens of billions of dollars, the mid-June listing is on track to eclipse every other blockbuster IPO in history, splitting its rocket-launch, satellite, and nascent AI units.
- Japan reactor makers forecast nuclear resurgence: Following a decade-long lull, Japan's top reactor manufacturers are projecting record sales amid a major domestic nuclear power resurgence. Concurrently, Tokyo announced plans to unleash green bonds focused heavily on EV batteries and clean technology.
Key Macro Themes
- Geopolitical “risk on” realignment: Energy and capital markets are rapidly pricing out the immediate war premium after weeks of supply disruptions tied to the Strait of Hormuz. The sudden multi-percentage drop in crude highlights a volatile shift from stagflation fears back toward pro-growth assets.
- Bond market pressure limits central bank independence: Despite the single-session relief rally in bonds, long-dated yields remain near multi-decade highs, with the US 30-year yield touching 5.20%. This persistent structural inflation pressure has forced President Trump to cool his aggressive public demands for immediate interest rate cuts from the Fed.
- AI hardware and startup funding dominance: NVIDIA's stellar US$81.6B print, paired with Anthropic projecting a 130% revenue surge to US$10.9B for its first profitable quarter, demonstrates that the AI infrastructure supercycle shows no signs of structural deceleration. OpenAI is also reported to be preparing a confidential draft prospectus for an upcoming IPO.
Global Market Impact: Last 24 Hours
Equities: Wall Street snapped a three-day losing streak, with the main US indices rallying over 1% on peace deal optimism. Tech, up 2%, and consumer discretionary sectors, up 2.5%, led the charge, while the Philadelphia Semiconductor Index surged 4.5%. Europe and the UK gained 1% and 1.5%, respectively.
Fixed Income: Sovereign bond yields tumbled sharply, marking their biggest single-day decline since late March. The US 10-year Treasury yield fell by 10 basis points, while UK yields posted widespread double-digit drops across the entire curve.
FX: The US Dollar Index, DXY, weakened by 0.2%. The Australian Dollar, New Zealand Dollar, and Swedish Krona emerged as the top G10 gainers on renewed global risk appetite.
Commodities: WTI and Brent crude oil plummeted by 5% as geopolitical premium evaporated on the final-stage peace talks between the US and Iran. Non-yielding spot gold edged slightly higher by 1.4% to US$4,544/oz, bouncing off its recent 1.5-month lows as interest rate anxieties temporarily moderated but remained below its 20-day moving average at US$4,622/oz.
Asia Pacific Impact
- Stock markets: Semiconductor and tech supply chains are expected to gain a strong tailwind today, following NVIDIA's blowout earnings and Samsung's union tentatively suspending its strike. Major Asia Pacific benchmark stock indices are trading in positive territory in today’s Asia opening session. Nikkei 225 rose 3.4%, KOSPI surged 6.6%, Hang Seng Index gained 0.5%, China A50 added 0.7%, ASX 200 climbed 1.7%, and STI rose 0.3% at the time of writing.
- Currencies and interventions: Bank Indonesia's unexpected 0.5% policy interest rate hike successfully lifted the Rupiah, combating multi-month capital outflows. The Japanese Yen stabilized near 159 per USD as Tokyo continued to threaten immediate intervention ahead of the 160 threshold. The Aussie fell 0.5% against the USD, almost reversing all of yesterday’s gains, reinforced by weak labour data as the unemployment rate for April jumped to 4.5% from 4.3% in March.
Top 4 Events to Watch Today
- Eurozone S&P Global Manufacturing and Services PMI Prelim (May) - 4.00 pm SGT Impact: EUR/USD, EUR crosses, DAX
- UK S&P Global Manufacturing and Services PMI Prelim (May) - 4.30 pm SGT Impact: GBP/USD, GBP crosses, FTSE 100
- US Weekly Initial Jobless Claims - 4.30 pm SGT Impact: USD, US stock indices, US Treasuries
- US S&P Global Manufacturing and Services PMI Prelim (May) - 8.30 pm SGT Impact: USD, US stock indices, US Treasuries, Gold
Chart of the Day: AUD/USD Bearish Reaction at 20-Day MA
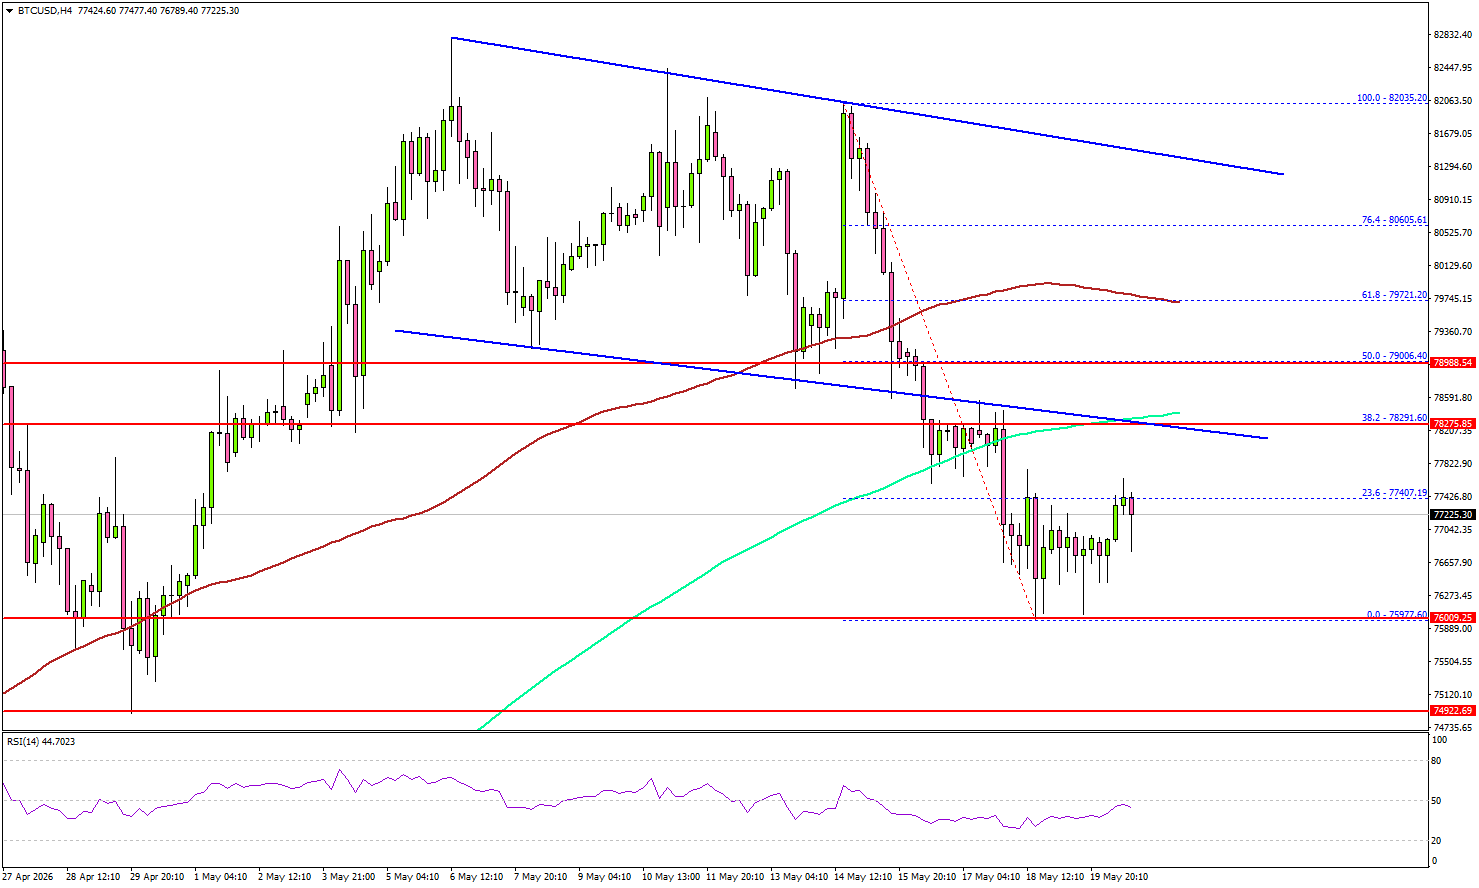
Fig. 1: AUD/USD minor uptrend as of 21 May 2026. Source: TradingView.
The price action of AUD/USD exhibited a bearish reaction after a retest of the 20-day moving average. The Aussie fell by 0.4% intraday in today’s Asia session, almost reversing all of the gains seen on Wednesday, 20 May 2026.
Technically speaking, AUD/USD remains entrenched in a minor downtrend phase since its failure to break above 0.7265, the swing highs of 4 May 2022 and 3 June 2022, on three recent occasions: 6 May, 13 May, and 14 May.
Watch the 0.7180 key short-term pivotal resistance to maintain the near-term bearish bias. A break below 0.7085, Tuesday, 19 May 2026 low, exposes the next intermediate supports at 0.7055 and 0.7030 in the first step.
However, a clearance and an hourly close above 0.7180 invalidates the bearish scenario for a squeeze up towards the next intermediate resistances at 0.7233 and 0.7265.
Bitcoin Holds Ground Following Losses, Though Upside Remains Fragile
Key Highlights
- Bitcoin declined heavily below $80,000 before the bulls emerged.
- A few hurdles are forming near $78,200 and $79,000 on the 4-hour chart of BTC/USD.
- Ethereum remains in a bearish zone below $2,400.
- Gold extended losses before the bulls took a stand near $4,465.
Bitcoin Price Technical Analysis
Bitcoin price failed to stay above $81,200 against the US Dollar. BTC reacted to the downside below $80,000 and $79,000.
Looking at the 4-hour chart, the price dipped below a declining channel with support at $78,500. The price even settled below $79,000, the 100 simple moving average (red, 4-hour), and the 200 simple moving average (green, 4-hour).
A low was formed at $75,977, and the price is now consolidating losses below the 38.2% Fib retracement level of the recent decline from the $82,035 swing high to the $75,977 low.
On the upside, the price now faces resistance near $78,200, the same channel, and the 200 simple moving average (green, 4-hour). The first key hurdle could be $79,000 and the 50% Fib retracement level of the recent decline from the $82,035 swing high to the $75,977 low.
A close above $79,000 could send the price toward $80,500. Any more gains might call for a test of $82,000. Immediate support sits at $76,500. The first key support could be $76,000. The main breakdown support could be $75,000.
A downside break below $75,000 might start another decline. The next major support might be $72,000, below which BTC could decline toward $70,000.
Looking at Ethereum, the price also gained bearish momentum below $2,300 and remains at risk of more downside.
Today’s Key Economic Releases
- US Initial Jobless Claims - Forecast 210K, versus 211K previous.
- US S&P Global Manufacturing PMI for June 2026 (Preliminary) – Forecast 54.0, versus 54.5 previous.
- US S&P Global Services PMI for June 2026 (Preliminary) – Forecast 51.0, versus 51.0 previous.
Aussie Rebound Runs Into Domestic Reality as Weak Jobs Lock In RBA June Hold
The Aussie tried to rally on improving global sentiment. Australia’s economy had other ideas.
AUD/USD bounced earlier today as markets reacted positively to signs that Washington and Tehran may be moving closer toward a diplomatic breakthrough. President Donald Trump’s claim that the US was in the “final stages” of negotiations with Iran helped cool fears surrounding the Strait of Hormuz and triggered a sharp retreat in oil prices, with Brent falling back below $106 after briefly surging above $112 earlier this week. Asian stocks rebounded, safe-haven Dollar demand eased, and the Aussie initially joined the relief rally.
But the recovery quickly lost momentum once Australia’s weak labor market data hit the wires. Employment unexpectedly contracted by -18.6k in April instead of rising by the expected 15.2k, while unemployment rate jumped from 4.3% to 4.5%. The report reinforced growing signs that the RBA’s aggressive tightening campaign — combined with the broader global slowdown and prolonged energy shock — is finally starting to bite into domestic demand and hiring conditions.
That shift matters because the RBA had spent much of this year maintaining a relatively hawkish posture amid concerns about inflation expectations and energy-driven price pressures. Now the narrative could be changing. The central bank has all the justification it needs to pause in June and reassess conditions rather than continue tightening immediately. The weak jobs report effectively shut down remaining speculation about another near-term hike.
The result is an Aussie Dollar caught in a classic macro tug-of-war. On one side, improving global risk sentiment and falling oil prices support commodity-linked currencies. On the other, weakening domestic fundamentals increasingly undermine confidence in Australia’s own economic outlook. So far, neither side has fully won — but the domestic story is starting to look heavier.
Technically, AUD/USD is also showing signs that rallies are increasingly being sold into rather than extended. The pair’s rejection at the 55 4H EMA (now at 0.7168) keeps short-term bias pointed lower, while a break below 0.7076 would resume the decline from 0.7277.
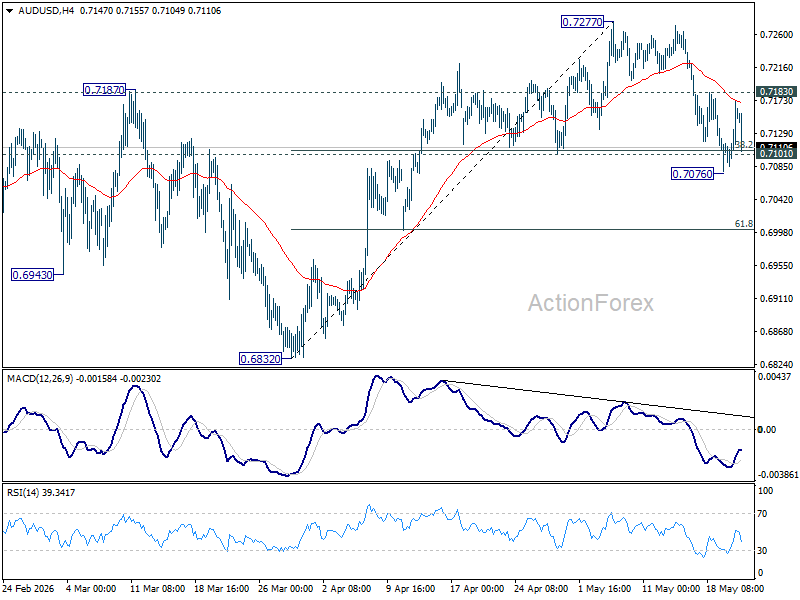
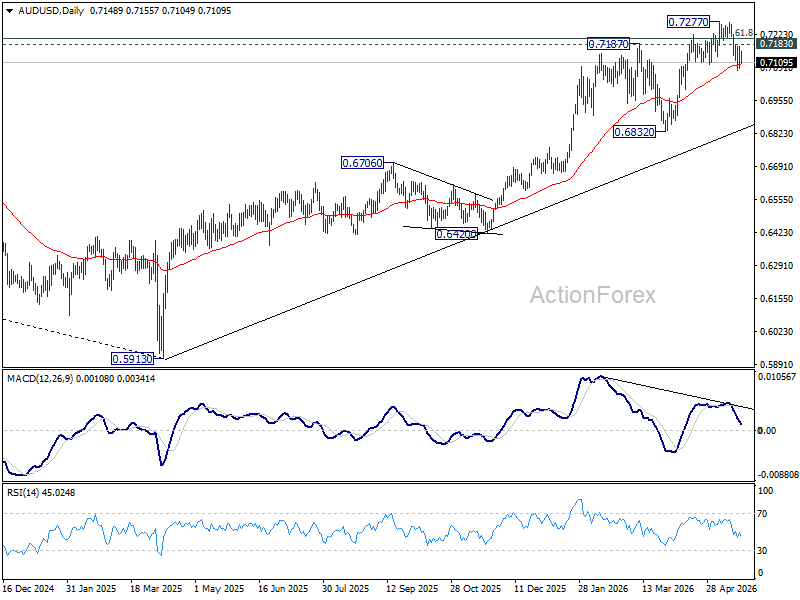
More importantly, bearish divergence on the D MACD strengthens the case that 0.7277 may already have marked a medium-term top. If downside momentum accelerates through 55 D EMA (now at 0.7104) decisively, AUD/USD would likely shift into a broader corrective phase against the entire rise from 0.5913, opening the door toward 0.6832 support next.
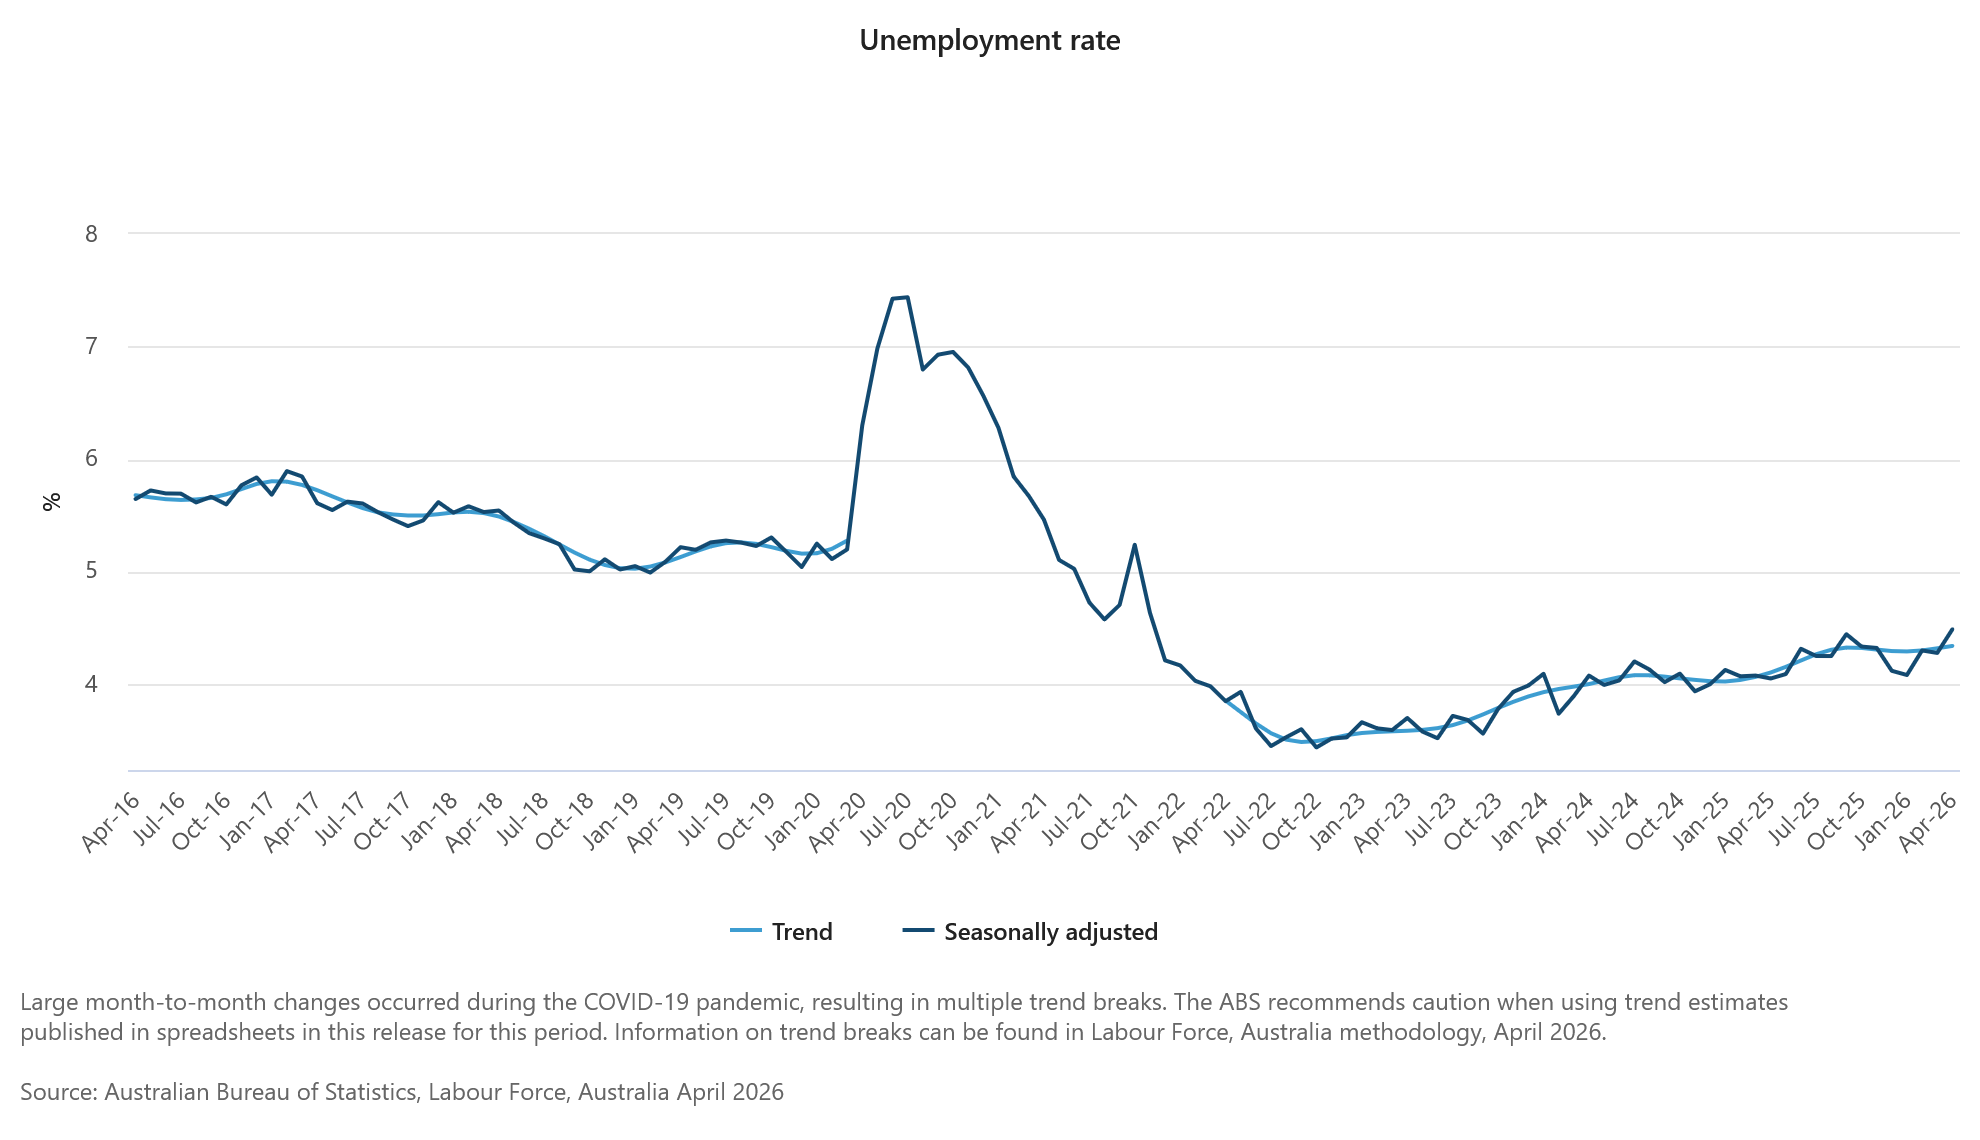
Australia Employment Unexpectedly Contracts as Unemployment Rate Jumps to 4.5%
Australia’s labor market weakened sharply in April as employment unexpectedly contracted and the unemployment rate climbed to its highest level since 2021, reinforcing signs that higher interest rates and slowing demand are beginning to weigh more heavily on the economy. Employment fell by -18.6k, sharply missing expectations for a 15.2k increase, while unemployment rate rose from 4.3% to 4.5%, above forecasts for an unchanged reading.
The weakness was broad-based across the labor market. Full-time employment declined by -10.7k to 10.16 million, while part-time employment fell by -7.9k to 4.58 million. Participation rate also edged lower from 66.8% to 66.7%, suggesting some workers may already be stepping out of the labor force as hiring conditions soften.
One area of resilience came from hours worked, which rose 0.8% mom despite the drop in employment, indicating firms may still be relying on existing staff rather than aggressively expanding payrolls. Nevertheless, the overall report strengthens expectations that the Reserve Bank of Australia will maintain its tactical wait-and-see stance near term after signaling earlier this week that policy settings are now restrictive.
| Indicator | Previous | Latest | Expectation |
|---|---|---|---|
| Employment Change | 17.9k | -18.6k | 15.2k |
| Unemployment Rate | 4.3% | 4.5% | 4.3% |
| Participation Rate | 66.8% | 66.7% | — |
| Monthly Hours Worked (mom) | — | 0.8% | — |
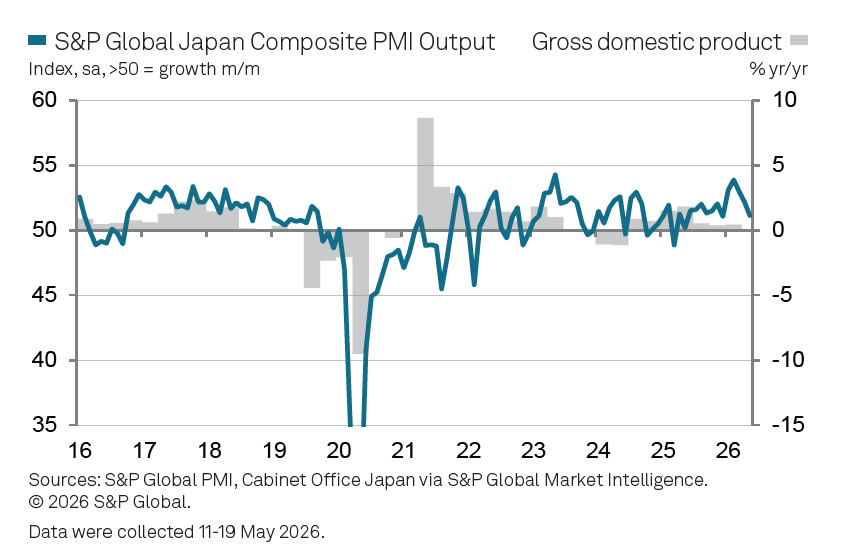
Japan PMI Growth Slows as Manufacturing Strength Offsets Stagnating Services Sector
Japan’s private sector growth slowed in May as momentum weakened across both manufacturing and services activity, though the economy continued expanding overall thanks to resilient factory output. Flash Japan Composite PMI Output Index eased from 52.2 to 51.1, while Services PMI Business Activity Index slowed sharply from 51.0 to 50.0, effectively signaling stagnation after 13 consecutive months of expansion. Manufacturing PMI also eased modestly from 55.1 to 54.5, while Manufacturing Output Index slipped from 55.1 to 54.1.
According to S&P Global’s Annabel Fiddes, the latest expansion was “driven entirely by manufacturing,” with factory activity continuing to benefit partly from stockpiling efforts linked to disruptions caused by the Middle East conflict. Firms reportedly increased inventories amid concerns over product availability and rising prices. Even with the moderation in May, manufacturing output growth remained close to April’s strongest pace in more than 12 years.
At the same time, inflation pressures intensified further. Fiddes warned that overall business costs rose at the fastest pace in three-and-a-half years, while selling price inflation accelerated to a fresh survey high. The combination of rising costs and softening demand is beginning to create a more challenging backdrop for Japanese firms. While the PMI data still point to a relatively solid manufacturing-led expansion in the second quarter, the loss of momentum in May reinforces concerns that persistent energy-related inflation pressures could eventually weigh more heavily on confidence, domestic demand, and broader economic growth.
| Indicator | Previous | Latest |
|---|---|---|
| Composite PMI Output Index | 52.2 | 51.1 |
| Services PMI Business Activity Index | 51.0 | 50.0 |
| Manufacturing PMI | 55.1 | 54.5 |
| Manufacturing PMI Output Index | 55.1 | 54.1 |
Australia PMIs Fall Back Into Contraction as Demand and Confidence Deteriorate
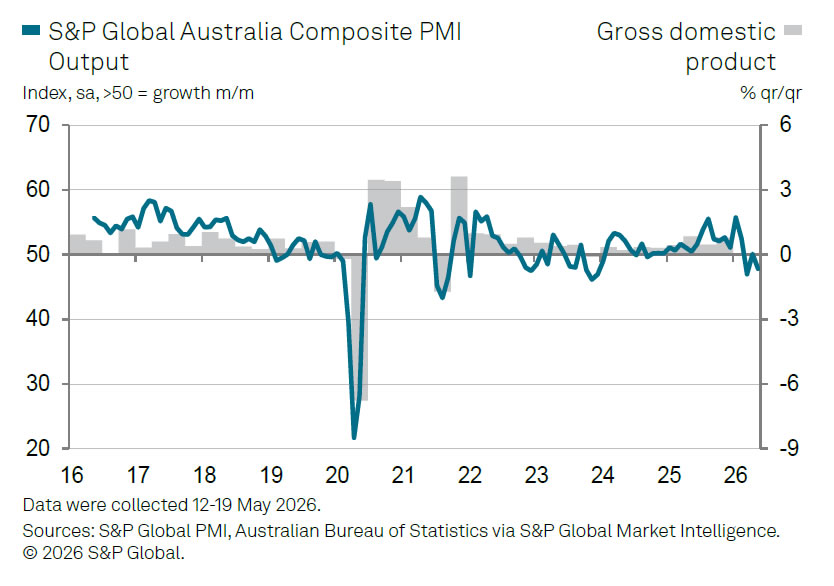
Australia’s private sector slipped back into contraction in May as weakening demand, softer employment conditions, and persistent energy-related cost pressures weighed heavily on business activity. Flash Australia Composite PMI Output Index fell from 50.4 to 47.8, marking the second contraction in three months. The downturn was led by services activity, with Flash Services PMI Business Activity Index dropping sharply from 50.7 to 47.7. Manufacturing PMI eased from 51.3 to 50.2.
The report painted a picture of an economy increasingly struggling under the prolonged fallout from the Middle East conflict and elevated energy costs. S&P Global economist Eleanor Dennison said firms continued reporting “significantly elevated price pressures often linked to raised energy costs and its knock-effects,” although inflation pressures softened somewhat from April. Manufacturers appeared particularly affected, with companies reducing stockpiling efforts as they attempted to minimize exposure to volatile input costs. Manufacturing output itself remained weak at 48.5, unchanged from April.
More concerningly, the demand backdrop deteriorated further, with businesses reporting a “faster and solid reduction in orders,” according to Dennison. That decline in demand contributed to fresh output weakness and renewed retrenchment in employment. Business confidence also deteriorated sharply, with sentiment falling to levels “only matched by that seen during the first pandemic lockdown in March 2020.”
| Indicator | Previous | Latest |
|---|---|---|
| Composite PMI Output Index | 50.4 | 47.8 |
| Services PMI Business Activity Index | 50.7 | 47.7 |
| Manufacturing PMI | 51.3 | 50.2 |
| Manufacturing PMI Output Index | 48.5 | 48.5 |