Sample Category Title
EUR/AUD Weekly Outlook
EUR/AUD's down trend resumed last week but downside momentum has been unconvincing with bullish convergence condition in 4H MACD. Still, there is no clear sign of bottoming yet. Further fall is expected this week to 138.2% projection of 1.8554 to 1.7245 from 1.8160 at 1.6351. However, firm break of 1.6830 resistance will confirm short term bottoming, and turn bias back to the upside for stronger rebound.
In the bigger picture, fall from 1.8554 medium term top is seen as reversing the whole up trend from 1.4281 (2022 low). Deeper decline should be seen to 61.8% retracement of 1.4281 to 1.8554 at 1.5913, which is slightly below 1.5963 structural support. For now, risk will stay on the downside as long as 1.7245 support turned resistance holds, even in case of strong rebound.
In the longer term picture, rise from 1.4281 is seen as the second leg of the pattern from 1.9799 (2020 high), which is part of the pattern from 2.1127 (2008 high). Current development argue that it has already completed at 1.8554. Sustained trading below 55 M EMA (now at 1.6603) will confirm this bearish case, and pave the way back towards 1.4281.
EUR/CHF Weekly Outlook
EUR/CHF's down trend resumed by late break of 0.9092 support last week. Initial bias is back on the downside. Next target is 61.8% projection of 0.9347 to 0.9092 from 0.9149 at 0.8991. For now, near term outlook will stay bearish as long as 0.9149 resistance holds, in case of recovery.
In the bigger picture, down trend from 0.9928 (2024 high) is still in progress. Next target is 61.8% projection of 1.1149 to 0.9407 from 0.9928 at 0.8851. Outlook will stay bearish as long as 0.9394 resistance holds, in case of rebound.
In the long term picture, EUR/CHF is also holding well inside long term falling trend channel. Down trend from 1.2004 (2018 high) is still in progress. Outlook will continue to stay bearish as long as falling 55 M EMA (now at 0.9739) holds.
Credit Crunch Fears to Conclude a Temperamental Month; NFP Incoming – Markets Weekly Outlook
- Discover our Weekly Market Outlook, exploring themes and events that forged financial flows throughout the week.
- This week concludes a heavy February trading month, with a weighty week incoming right after.
- Get ready for next week's action by exploring upcoming events across global Markets.
Week in review – Markets remain very anxious, and they just found a new reason.
It seems traders will have to keep looking for reasons for volatility, as things won't settle anytime soon.
Since Kevin Warsh's nomination to head the Federal Reserve, Markets have been raging in brutal up-and-down swings.
Despite the harsh narratives, Stock Benchmarks remain near their all-time highs, and the immediate action looks more like a widespread rebalancing than a full-blown risk dump.
The most speculative assets have been slowly being tossed out since the October risk peaks, and this move is quickly translating into a newfound interest in quality (albeit not yet a real migration).
As some analysts call for a transition to the peak of the economic cycle, defensive assets and sectors are attracting attention. Bonds and Metals are actually the best performers this week.
1-month Performance Market Performance – Source: TradingView
After cryptocurrencies, tech/software, and semiconductors, a more concerning wave is gripping Financial Markets.
Waves of defaults among Private Equity and some of the most shaky tech companies are dragging down private lenders, Venture Capital firms, and some financials.
In case you forgot, this comes promptly after Credit Spreads reached new 2007 lows, and within not even a month, they are coming back to their December highs.
What could be concerning is how highly correlated the financial system has become since the Great Financial Crisis. Banks grew enormously, and it seems people quickly turned the page on the 2023 SVB blow-up, which raised questions about how large a credit spider web it has become.
Credit Spreads since mid-December – February 27, 2026 – Source: X, Bloomberg
In any case, the monthly picture is a scary one for Financials, and that's getting even more amplified today – Bank of America is down close to 4%, Goldman Sachs and Morgan Stanley are closer to -8%, but that's only the major banks.
Smaller lenders like Blackstone, Jefferies, and KKR & Co are down close to 30% on the month, and even Robinhood is suffering similar-sized drops. UBS is sending their own warnings and they're not pretty.
Current session in Banks – Source: CNBC – February 27, 2026
This will surely maintain more anxiety in the Markets. It's not that AI will lead to immediate spikes in layoffs; it's more about what happens to those who get replaced and how it spreads through the financial system at this point.
Weekly Performance across Asset Classes
Weekly Asset Performance – February 27, 2026 – Source: TradingView
Silver is calling and it wants its crown back!
The precious metal is closing well above its early February monthly highs as Metals caught a strong bid in today's action. These are preparations for something happening over the weekend.
The Week Ahead – NFP and PMIs all around the globe
Asia Pacific Markets – A condensed data package for APAC
Next week should be exiting for APAC traders. Without countic geopolitics, macro traders will await three PMI reports for China – There has been a surprising drop in the data as of late and the PBoC is talking about supporting their economy, not through Market-wide stimulus but with targeted assistance.
It will be interesting to see how it plays out in the data.
The Australian Dollar will once again be on the front-scene, between Inflation surveys, a speech from Governor Bullock, PMIs, Trade data and GDP.
It's going to be a very essential week for the 2026 FX leader – Let's see if it holds the test.
In Japan, traders will be listening closely to Governor Ueda's speech on Monday night. A hike could be coming towards mid-month for the Bank of Japan and he upped his tone recently regarding the possibility.
With two new decision-makers entering the Bank of Japan in the next months, it could be his last opportunity to build some form of consensus.
Europe and UK Markets – Eurozone and Swiss Inflation
The heavy slate of data also spreads to Europe with Inflation data (Consumer Prices and Producer Prices) releasing. Friday will also see the Yearly data for EU GDP, so keep this one in check.
But the largest culprit will be Swiss Inflation report, where traders should confirm whether negative rates will be a thing or not. A heavy test for FX markets.
North American Markets – More PMIs, but most importantly, Non-Farm Payrolls
Next week is going to be huge for North America. Without mentioning Iran, traders will receive a streak of PMIs from Canada and the US. A first round will come on Monday (Manufacturing) and the second will be on Wednesday (Services), along with the Beige Book (which had been a no-show but slowly getting interesting).
But Markets will have to await for the real Parade: Friday will release a Retail Sales and Non-Farm Payrolls double decker at 8:30 A.M..
Retail sales sent an honest shocker last month, missing by 0.5 percentage points, while Non-Farm Payrolls remained surprisingly strong – Make sure to not miss our incoming Previews.
Now, with a finally timely NFP, Participants shall see if this boost in employment really proves to be solid or just a seasonal one (with new year employment).
Even after the latest ease in narrative, keep a close eye on geopolitical developments, particularly those involving the US-Iran talks, as they are likely to continue influencing Commodity and broader Markets.
Next Week's High Tier Economic Events
For all market-moving economic releases and events, see the MarketPulse Economic Calendar. (High-tier data only)
Friday 27's Market Wrap
Cross-Asset Daily Performance, February 27, 2026 – Source: TradingView
Today's session really continued the past session's turn towards geopolitical hedges and a general turn towards quality.
As mentioned in the introduction, banks have seen bloodshed along with tech companies, and this comes right after the gigantic Nvidia earnings.
A very concerning picture for what's coming. Still, Stock markets are closing off-of their session lows, supported by calmer month-end flows in the afternoon.
The US Dollar is also surprisingly at the bottom of the FX board, victim of some heavy repositioning or month-end settling flows. The CHF leading isn't much surprising however.
Expect to hear about Iran this weekend. Stay safe everyone!
Safe Trades and enjoy your weekend!
The Weekly Bottom Line: Weak Q4 Headline GDP Number Masks Solid Domestic Demand
Canadian Highlights
- Capital spending intentions for 2026 flagged a pick-up in nominal private sector investment, alongside continued growth in the public sector.
- Canadian GDP contracted 0.6% annualized in the fourth quarter, thanks to an inventory draw down. Beneath the headline, domestic demand and net trade were much healthier.
- The solid details of the GDP report likely left the Bank of Canada comfortable with its current on-hold stance.
U.S. Highlights
- President Trump focused on tariffs and cost of living issues in his State of the Union Address.
- Consumer confidence edged higher in February on improved expectations, but views of current conditions weakened further as labor market pessimism persisted.
- Mortgage rates fell below 6% for the first time in over three years, offering modest support to the housing market.
Canada – Weak Q4 Headline GDP Number Masks Solid Domestic Demand
Financial markets were hit with a bevy of crosscurrents this week. In the bond market, Canadian yields declined alongside U.S. yields, as ongoing tariff uncertainty encouraged investors to seek the relative safety of U.S. bonds. Oil prices were volatile, affected by fluctuating perceptions of U.S.-Iran tensions as negotiators from both countries met. Oil was up for the month overall, which will upwardly pressure Canadian CPI inflation in February. Equity markets, meanwhile, were higher again this week, supported by bank earnings and commodity prices.
Data flow was mixed this week. Given the importance of business investment in forecasts for Canadian economic growth, we were eagerly anticipating this week’s release of the survey of capital spending for 2026. Last year, nominal non-residential spending on structures and machinery and equpiment increased about 5%. Economic uncertainty led to a pullback in private sector investment, although the public sector increased its investment spending significantly. Investment intentions for 2026 in the survey flagged another outperformance by the public sector. However, the picture is a bit brighter compared to last year for the private sector, where nominal investment is slated to advance 3% (Chart 1).
This week’s Survey of Employment, Payrolls and Hours offered a pulse-check on the jobs market in December. The report sent a much weaker signal than the earlier-released LFS jobs data, as payroll hiring was off 0.2% in the month while hours worked sagged.
While these reports gave important signals on the economy, the marquee event this week was this morning’s release of Q4 Canadian GDP. Real GDP contracted by 0.6% annualized in Q4. The knee-jerk reaction of markets was to shift the odds slightly more towards a rate cut this year (though they’re assigning less than a 50% chance of one this year) on the headline number. But, peeling back the layers showed a better performance (Chart 2). For starters, inventories were the main growth drag, as final domestic demand was up a sturdy 2.4% annualized (stronger than our expectation) boosted by consumption growth and government spending. There was also a partial bounce-back in non-residential investment, consistent with the tone of the capital intentions survey. Net trade also contributed positively, driven by a solid gain in exports. Even the monthly, industry-based GDP for December was stronger than Statcan had previously guided.
If there was one blemish in the GDP report it was that output may have moderated in January, though even here, winter storms may have had a hand. Overall Canada’s economy felt the impact of U.S. tariffs in 2025. GDP growth slowed from 2% in 2024 to 1.7%, with Statistics Canada pointing out the slowdown was mainly due to weaker exports to the United States.
For the Bank of Canada, there was likely enough in the GDP report to leave them comfortable in their current hold stance, despite the weak headline figure.
U.S. – The State of the Union and the State of the Economy
This week’s economic calendar was light, with highlights including a modest rise in consumer confidence, a drop in mortgage rates, the State of the Union Address (SOTU), and ongoing trade policy uncertainty. In his SOTU, President Trump reaffirmed support for tariffs as a government revenue tool. The U.S. has imposed 10% duties on imports from all countries for 150 days under Section 122, pivoting quickly after last week’s Supreme Court decision striking down the administration’s use of tariffs under the International Emergency Economic Powers Act (IEEPA). The President subsequently threatened to raise the 10% blanket tariff to 15%, but no executive order has been signed.
Questions also remain about whether the $133 billion in IEEPA revenues—60% of total U.S. tariff revenue in 2025—will need to be refunded. The Court did not decide on this, so further litigation is likely. The potential revenue loss could push U.S. Treasury yields higher, as tariff revenue was expected to offset much of the One Big Beautiful Bill Act’s cost. However, markets appear unconcerned, either expecting the administration to find other ways to secure tariff funds or anticipating a lengthy litigation process. So far only a small fraction of importers has filed lawsuits for refunds.
Cost-of-living concerns were also addressed in the speech. The president noted that prices for some key goods have moderated, even as prices broadly continued to rise. He urged Congress to address healthcare costs and highlighted efforts to lower prescription drug prices. Housing affordability was mentioned, with a renewed call to restrict large institutional ownership of single-family homes. On that note, mortgage rates continued to ease this week. The average 30-year fixed rate fell to 5.98% on Thursday—the first sub-6% reading in over three years. Lower rates and a steady labor market should help boost home sales, but without broader affordability and supply improvements, a major turnaround in the housing market is unlikely.
Cost-of-living worries and a slowing labor market remain top of mind for consumers. While consumer confidence index edged up in February, rising from 89.0 to 91.2, the gain was due entirely to improved expectations. Meanwhile, households’ views of current conditions softened further, with the present situation subcomponent declining to its lowest level since the pandemic, pointing to persistent pessimism about the job market. The gap between the share of households saying jobs are plentiful versus hard to get has been narrowing, weighing on confidence (Chart 1).
Consumer spending momentum faded at the end of last year (Chart 2), suggesting a weak handoff for Q1 and likely slower spending growth, before a possible Q2 pickup as higher tax refunds arrive. Next week, February’s jobs report should show labor market stabilization, while retail sales and ISM indexes will offer insights into consumer and business activity. We expect these indicators to show the economy continues to chug along despite the uncertainty, keeping the Fed on hold for now, especially with tariff policy in flux and inflation still above target.
International Week Ahead: Broader Disinflation to Keep ECB Asymmetry for Rate Cuts
International Week Ahead
- Eurozone CPI: Disinflation to Keep ECB Asymmetry for Rate Cuts
- Australia GDP: Q4 Growth Recovery Expected, Driven by Consumption
- China PMIs: Contraction, but IEEPA Ruling May Cloud Takeaways
- China Inflation: Deflation Pressures to Remain Present
- China NPC and 15th Five-Year Plan: Significance Has Dwindled
G10
Eurozone February CPI • (03/03)
Broader Disinflation to Keep ECB Asymmetry for Rate Cuts
We expect preliminary readings for February CPI to come in at 0.4% month-over-month, below consensus at 0.5% (per Bloomberg). In terms of the year-over-year numbers, we expect headline inflation to decline to 1.6% from 1.7% and core to hold at 2.2%. Disinflationary pressures have broadened in recent months beyond energy prices and have encompassed both non-energy industrial goods (NEIG) and services. A stronger EUR, goods diversion from China and weak global demand has helped drive the softness in NEIG price inflation, whereas easing wage momentum has helped push services inflation lower. Although our baseline remains for the European Central Bank (ECB) to remain on hold, the asymmetry remains firmly tilted towards easing, in our view. The ECB appears comfortable with a slight undershoot of inflation vs. its target (ECB forecast of 1.9% and 1.8% for 2026 and 2027, respectively), however larger shortfalls are likely to bring rate cuts back on the table. Moreover, the ECB is likely to be sensitive to signs of weakness in growth and/or tightness in credit conditions. We continue to believe meaningful support from fiscal policy is not likely until 2027. On the flip side, upside risks to inflation have dissipated significantly absent a meaningful rebound in oil/gas prices.
Australia GDP • (03/04)
Q4 Growth Recovery Expected, Driven by Consumption
Australia’s growth likely strengthened at year-end after a softer Q3 print. While we and consensus expect a Q4 rebound, we see less upside, with GDP rising 0.6% quarter-over-quarter on a seasonally adjusted basis and 2.1% year-over-year (versus consensus expectations of 0.7% and 2.2%, respectively). Q3 GDP grew 0.4% quarter-over-quarter and 2.1% year-over-year, driven mainly by a 0.8% increase in private business investment led by a 7.6% rebound in machinery and equipment. That momentum appears to have faded, as recent capital expenditure data show machinery and equipment spending slowing, and while non-residential construction remained firm, overall business investment momentum likely softened. Consumption, which accounts for roughly half of GDP, was more resilient in Q4, with monthly household spending indicators pointing to stronger activity despite a weaker December, and should be the main growth driver as Reserve Bank of Australia (RBA) rate cuts continued to filter through the economy. As in Q3, net exports and inventories are likely to weigh on growth, with imports continuing to outpace exports and monthly trade data pointing to another drag. In terms of monetary policy implications, we remain comfortable with our base case of one additional rate hike in May, taking the Cash Rate to 4.10%, given still-elevated inflation. However, a weaker-than-expected Q4 growth outcome could likely cap the tightening cycle at a single hike and reduce the risk of further increases later this year.
EM
China Manufacturing & Non-Manufacturing PMI • (03/04)
Contraction Territory, but IEEPA Tariff Ruling May Cloud Takeaways
With most hard activity data delayed due to Lunar New Year celebrations, PMIs will be closely watched to gauge underlying economic sentiment in China. As of January, both the manufacturing and non-manufacturing PMIs are in contraction territory and expectations are for both sentiment indices to remain below 50 when February data are released. Historically, PMI data have been useful to gauge trend direction of China's economy. Below 50 prints are consistent with decelerating activity, and vice versa. But keep in mind, while February data may show both sectors in contraction, they both may not fully capture a lower effective tariff rate applied to Chinese exports headed for the U.S. after the U.S. Supreme Court's IEEPA tariff ruling. So while we will be paying attention to both, we will take each with a modest grain of salt. March PMIs next month will likely be more reflective of whether U.S. importers will rush to place orders in China as tariff rates are lower, especially with the Trump administration set to raise the baseline tariff to 15% in the coming weeks and possibly explore new country-specific tariffs through another legal avenues in the coming months. While we remain steadfast in our view that China's economy is riddled with structural imbalances that will pressure long-term growth rates, short-term growth prospects are holding up on exports with risks to our 4.7% 2026 GDP forecast tilted to the upside.
China Inflation • (03/09)
Weak Consumer Spending and Subdued Export Prices Keep Deflation Pressures Present
Deflation pressures are one of the structural deficiencies within China's economy, a challenge for short and long-term growth that should be on display when February CPI and PPI data are released next week. On the consumer side, subdued inflation is a product of weak consumer confidence and subdued domestic demand. We can point to a myriad of issues that contribute to soft consumer spending, but an unwillingness by Chinese policymakers to reflate the economy via monetary policy accommodation and fiscal support should mean soft consumer activity likely remains a theme for the foreseeable future. For producers, exporters are still trying to clear our excess inventory and still keeping export prices low. Export prices have come up a bit as authorities have pursued an anti-involution agenda, but we would not expect any significant changes to export prices nor PPI next month. Thematically, exporters may also look to keep prices permanently lower in an effort to maintain market share won last year. China now has ~22% of the global export market, up from ~17% at the end of 2024. How does China maintain market share? Pull-forward of external demand and front-running tariff hikes will help, but keeping prices low doesn't hurt either.
China National People's Congress and 15th Five-Year Plan • (03/05 – ~03/19)
Significance Has Dwindled and We Do Not Expect Anything Groundbreaking
The annual gathering of the National People's Congress (NPC) will start next week, yet will run over the course of the next two weeks. Typically, the NPC is a forum for implementing policy already decided and does not generate much in terms of surprises. We expect a similar result this year. But at least this year's NPC will be marked by the Chinese Communist Party (CCP) releasing its updated and 15th "Five-Year Plan" designed to offer insight into economic priorities, how the economy will be managed and economic goals for the next five years. In the past, Five-Year Plans were significant—especially during the Great Leap Forward years and the subsequent recovery and pursuit of a more market-driven economy under Deng. But more recently, Five-Year Plans have not offered much in terms of detail nor significant adjustments to how the CCP wants to evolve China's economy. For the 15th Plan, CCP members have already released a tentative summary of what the final Five-Year Plan will address. Long document, but skimming through suggests little in terms of surprises or significance. While we will pay attention, we anticipate headlines that sound material and economy-altering, particularly in the current tariff and trade backdrop, to amount to more of the same recent trends. We expect market participants to ultimately shrug off the Five-Year Plan and focus elsewhere going forward.
Weekly Economic & Financial Commentary: ISM Surveys, Employment, Retail Sales
Summary
U.S. Week in Review
- The economic data calendar was relatively light this week. However, the major indicators that were published showed that inflation pressures continue to percolate with few signs of the labor market exiting its soft patch. Meanwhile, the Fed communication channel provided comments underscoring the lack of consensus on which side of the Fed’s dual mandate demands the most attention, given still-elevated inflation and labor market risks.
U.S. Week Ahead
- Next week will bring some key readings on the economy's early year momentum. We look for the February ISM surveys to show a modest firming in services activity and that the factory sector is continuing to reemerge from the prior year's slump. Yet, the February employment report is likely to indicate that, while the labor market remains roughly in balance, job growth is struggling more than last month's jump in payrolls indicated. We believe the temperate labor market backdrop along with adverse winter weather led to a muted rise in January retail sales.
U.S. Week in Review
The economic data calendar was relatively light this week. However, the indicators that were published showed that inflation pressures continue to percolate with few signs of the labor market exiting its soft patch.
The soft labor market narrative was on display within the details of January’s consumer confidence print. Top-line consumer confidence is still bouncing around at the lower end of its past five-year range but came in a bit stronger than expected during January. The upside surprise was an encouraging development in that it suggests consumers are not feeling any worse about the current state of the economy. That said, the labor differential subcomponent, i.e., the difference between respondents saying “jobs are plentiful” and those saying “jobs are hard to get,” remains a glaring weak spot.
Breaking it down, just 28% of people think “jobs are plentiful,” up slightly during the month but still well off the recent cycle peak of over 50%. This suggests firms are still being cautious on adding to headcounts. But are they reducing payrolls in a material way? “Jobs hard to get” has averaged just 20% over the past several months, up from recent lows but hardly consistent with skyrocketing unemployment. In addition, initial jobless claims declined to 212K during the week ended Feb. 21, further evidence that overall unemployment is not surging higher. The message is that the labor market is currently lethargic, with very slow rates of new hiring. But deep and widespread layoffs (beyond a select few industries) do not appear to be happening either.
The thin flow of major indicators allowed plenty of time to parse through a full week of Fed speak. Generally speaking, the comments provided underscored that there is no clear consensus at the FOMC and among the regional bank presidents on which side of the Fed’s dual mandate demands the most attention. For example, Chicago Fed President Goolsbee stated “I remain optimistic that there can be more rate cuts this year. But that hinges on seeing actual progress on inflation that shows we are on a path back to 2%.” Governor Miran seemed more concerned about downside risks to employment, saying "I think it's way too early to sort of sound an all clear that the labor market doesn't need more support from the Federal Reserve” and “four cuts I think are appropriate and I’d rather get them sooner rather than later.”
However, comments from Governor Waller at the NABE policy conference in D.C. on Monday especially stood out to us. "If the labor market data for February are consistent with the stronger job creation and low unemployment rate initially reported in January, indicating that downside risks to the labor market have diminished, it may be appropriate to hold the FOMC's policy rate at current levels and watch for continued progress on inflation and strength in the labor market. But if the good labor market news of January is revised away or evaporates in February, it would support my position at the FOMC's last meeting, that a 25-basis-point reduction in the policy rate was appropriate, and that such a cut should be made at the March meeting. As things stand today, I rate these two possible outcomes as close to a coin flip."
In our view, January's "strong" employment growth may have been overstated and a more moderate payroll gain in February seems likely. For more on our nonfarm payroll forecast, please see below in our Outlook section. Nevertheless, labor market conditions do not appear to be deteriorating and look to have stabilized, albeit within a "low hire, low fire" context. Meanwhile, January's hotter-than-expected rise in both the headline and core Producer Price Index is the latest reminder that price pressures are still evident and that most inflation measures are still running above the FOMC's 2% target. From our standpoint, this lowers the likelihood of a March rate cut, though two additional 25 bps cuts later this year are still on the table, given still-present downside risks in the labor market.
U.S. Week Ahead
Monday & Wednesday • ISM Surveys
The ISM manufacturing index crossed into expansion territory in January for the first time in 10 months. The improvement comes amid an upswing in capital spending—highlighted by broadening in durable goods orders—as well as restocking efforts in the wake of last year's tariff hikes. We would not be surprised to see a little giveback in February following last month's leap, however, and estimate a February print of 52.0. The nearly 10-point jump in the new orders component in January overstates underlying momentum in the factory sector in our view. Regional PMIs for February show manufacturing activity continued to expand last month, but a more even-keeled pace.
Non-manufacturing activity continues to hold up better, as indicated by the ISM services index maintaining its 14-month high in January. Although firms remain cautious when it comes to hiring, business activity has been sturdy. We look for the February reading, due Wednesday, to edge up to 54.2.
Friday • Employment
We expect the February employment report to show that January’s robust pace of payroll growth overstated underlying momentum in the labor market. While some stabilization in demand for workers is evident, a range of indicators, including JOLTS and consumers' perception of job availability, continue to point to a gradual loosening in labor market conditions rather than a renewed acceleration in hiring. We look for nonfarm payrolls to rise by 45K in February, with weakness in weather-sensitive industries like construction and leisure & hospitality and some payback in healthcare & social assistance after a significantly above-trend reading in January.
We estimate the unemployment rate held steady at 4.3% in February, but see two-sided risk to this call. The household survey's measure of employment growth has been running well ahead of its trend the past two months, leaving some scope for payback in February that could push the jobless rate up to 4.4%. However, the implementation of the household survey's annual population adjustment poses downside risks, given the shift in immigration trends last year. Ratios from the household survey such as the labor force participation rate and unemployment rate are less affected by the population control adjustments than level data, but can move slightly under meaningful changes in the composition of the population.
The roughly balanced labor market should lead to average hourly earnings advancing a trend-like 0.3% in February and 3.7% over the past year. For more information, please see our employment preview.
Friday • Retail Sales
The shutdown-delayed January retail sales report is expected to show spending got off to a modest start in 2026. A large winter storm across the central and eastern U.S. likely crimped activity, with auto sales in January already reported to have fallen to nearly a three-year low. Lower gasoline prices will also have weighed on sales, leading us to expect just a 0.1% increase in total retail sales last month.
Yet, consumers are still finding ways to spend despite the cooler jobs market leading to slower income growth and a dampened consumer mood. High-frequency credit card data showed some modest firming in spending in January, leading us to expect retail sales ex-autos rose 0.3% last month. We expect retail sales to show more signs of life in the coming months as larger tax refunds and stabilizing labor market conditions support more discretionary spending.
New Tariff Regime Kicks in with Eye on U.S. Jobs Impacted by Trade Headwind
A quiet Canadian economic data calendar will leave focus on U.S. jobs next Friday—particularly on the disproportionately trade impacted industrial sector where cross-border economic ties with Canada are closest.
We look for the February report to be consistent with stabilizing broader U.S. labour market conditions. We expect the unemployment rate to tick up to 4.4% to reverse a decline to 4.3% in January, but hold below the recent 4.5% peak in November.
Job growth likely remained subdued (we expect a 65,000 increase), but slow underlying labour force growth due to an aging population and immigration curbs has lowered the breakeven rate of employment needed to keep the unemployment rate from rising more significantly.
Employment in the heavily tariff-exposed U.S. manufacturing sector has underperformed—mirroring conditions north of the border given tight Canada/U.S. industrial integration. But, it posted a small increase for the first time since November 2024 in January.
For Canada, we’re watching the February S&P manufacturing Purchasing Manager’s Index on Monday after it ticked above the neutral growth 50 level in January for the first time in a year.
U.S. tariff regime shifting with rates edging lower
U.S. trade policies are in flux again after the Supreme Court ruled against the use of IEEPA to impose broad-based tariffs last week. The U.S. administration announced a new 10% global tariff via Section 122 on the same day as the ruling, citing balance-of-payments deficit concerns.
The administration has already threatened to raise that to 15% (maximum allowable under that authority), but the list of exemptions from the measures is also long. Critically for Canada, trade compliant with CUSMA rules of origin is exempt as it was under IEEPA rules.
There is a list of more than 1,600 products where tariffs don’t apply “because of the needs of the United States economy.” By our count, products on that exemption list accounted for roughly half of U.S. global imports in 2025. For some trade partners, that share is substantially higher—for example, the exemption list covers more than 80% of U.S. imports from Taiwan in 2025.
Accounting for the exemptions, the new Section 122 tariffs likely represent a step lower in the average effective U.S. tariff rate overall. This aligns with our expectation that U.S. tariff collection may have already peaked given elevated affordability concerns.
Canada’s tariff backdrop unchanged after court ruling
The new measures don’t significantly change the international trade backdrop for Canada.
CUSMA exemptions mean Canada should retain among the lowest average U.S. effective tariff, even as significant targeted tariffs remain in effect on products like steel, aluminum and the auto sector (measures not impacted by the U.S. Supreme Court ruling).
We’ve long highlighted the importance of preserving CUSMA and related exemptions to our Canadian outlook. But, the U.S. administration’s decision last week to uphold these exemptions underscores the agreement is mutually beneficial on both sides of the border—including lowering costs for the 22 U.S. states that counted Canada as their largest source of imports in 2025.
Summary 3/2 – 3/6
Monday, Mar 2, 2026
| GMT | Ccy | Events | Cons | Prev |
|---|---|---|---|---|
| 00:30 | JPY | Manufacturing PMI Feb F | 52.8 | 52.8 |
| 07:00 | EUR | Germany Retail Sales M/M Jan | 0.00% | 0.10% |
| 07:30 | CHF | Real Retail Sales Y/Y Jan | 2.70% | 2.90% |
| 08:30 | CHF | PMI Manufacturing Feb | 50.1 | 48.8 |
| 08:50 | EUR | France Manufacturing PMI Feb F | 49.9 | 49.9 |
| 08:55 | EUR | Germany Manufacturing PMI Feb F | 50.7 | 50.7 |
| 09:00 | EUR | Eurozone Manufacturing PMI Feb F | 50.8 | 50.8 |
| 09:30 | GBP | Mortgage Approvals Jan | 62K | 61K |
| 09:30 | GBP | M4 Money Supply M/M Jan | 0.20% | 0.30% |
| 09:30 | GBP | Manufacturing PMI Feb F | 52 | 52 |
| 14:30 | CAD | Manufacturing PMI Feb | 50.4 | |
| 14:45 | USD | Manufacturing PMI Feb F | 51.2 | 51.2 |
| 15:00 | USD | ISM Manufacturing PMI Feb | 51.9 | 52.6 |
| 15:00 | USD | ISM Manufacturing Prices Paid Feb | 59 | |
| 15:00 | USD | ISM Manufacturing Employment Feb | 48.1 |
| 00:30 | JPY |
| Manufacturing PMI Feb F | |
| Consensus | 52.8 |
| Previous | 52.8 |
| 07:00 | EUR |
| Germany Retail Sales M/M Jan | |
| Consensus | 0.00% |
| Previous | 0.10% |
| 07:30 | CHF |
| Real Retail Sales Y/Y Jan | |
| Consensus | 2.70% |
| Previous | 2.90% |
| 08:30 | CHF |
| PMI Manufacturing Feb | |
| Consensus | 50.1 |
| Previous | 48.8 |
| 08:50 | EUR |
| France Manufacturing PMI Feb F | |
| Consensus | 49.9 |
| Previous | 49.9 |
| 08:55 | EUR |
| Germany Manufacturing PMI Feb F | |
| Consensus | 50.7 |
| Previous | 50.7 |
| 09:00 | EUR |
| Eurozone Manufacturing PMI Feb F | |
| Consensus | 50.8 |
| Previous | 50.8 |
| 09:30 | GBP |
| Mortgage Approvals Jan | |
| Consensus | 62K |
| Previous | 61K |
| 09:30 | GBP |
| M4 Money Supply M/M Jan | |
| Consensus | 0.20% |
| Previous | 0.30% |
| 09:30 | GBP |
| Manufacturing PMI Feb F | |
| Consensus | 52 |
| Previous | 52 |
| 14:30 | CAD |
| Manufacturing PMI Feb | |
| Consensus | |
| Previous | 50.4 |
| 14:45 | USD |
| Manufacturing PMI Feb F | |
| Consensus | 51.2 |
| Previous | 51.2 |
| 15:00 | USD |
| ISM Manufacturing PMI Feb | |
| Consensus | 51.9 |
| Previous | 52.6 |
| 15:00 | USD |
| ISM Manufacturing Prices Paid Feb | |
| Consensus | |
| Previous | 59 |
| 15:00 | USD |
| ISM Manufacturing Employment Feb | |
| Consensus | |
| Previous | 48.1 |
Tuesday, Mar 3, 2026
| GMT | Ccy | Events | Cons | Prev |
|---|---|---|---|---|
| 21:45 | NZD | Building Permits Jan | -4.60% | |
| 23:30 | JPY | Unemployment Rate Jan | 2.60% | 2.60% |
| 23:50 | JPY | Capital Spending Q4 | 3.00% | 2.90% |
| 23:50 | JPY | Monetary Base Y/Y Feb | -10.20% | -9.50% |
| 00:01 | GBP | BRC Shop Price Index Y/Y Feb | 1.20% | 1.50% |
| 00:30 | AUD | Current Account (AUD) Q4 | -16.3B | -16.6B |
| 00:30 | AUD | Building Permits M/M Jan | 5.60% | -14.90% |
| 10:00 | EUR | Eurozone CPI Y/Y Feb P | 1.70% | 1.70% |
| 10:00 | EUR | Eurozone Core CPI Y/Y Feb P | 2.20% | 2.20% |
| 21:45 | NZD |
| Building Permits Jan | |
| Consensus | |
| Previous | -4.60% |
| 23:30 | JPY |
| Unemployment Rate Jan | |
| Consensus | 2.60% |
| Previous | 2.60% |
| 23:50 | JPY |
| Capital Spending Q4 | |
| Consensus | 3.00% |
| Previous | 2.90% |
| 23:50 | JPY |
| Monetary Base Y/Y Feb | |
| Consensus | -10.20% |
| Previous | -9.50% |
| 00:01 | GBP |
| BRC Shop Price Index Y/Y Feb | |
| Consensus | 1.20% |
| Previous | 1.50% |
| 00:30 | AUD |
| Current Account (AUD) Q4 | |
| Consensus | -16.3B |
| Previous | -16.6B |
| 00:30 | AUD |
| Building Permits M/M Jan | |
| Consensus | 5.60% |
| Previous | -14.90% |
| 10:00 | EUR |
| Eurozone CPI Y/Y Feb P | |
| Consensus | 1.70% |
| Previous | 1.70% |
| 10:00 | EUR |
| Eurozone Core CPI Y/Y Feb P | |
| Consensus | 2.20% |
| Previous | 2.20% |
Wednesday, Mar 4, 2026
| GMT | Ccy | Events | Cons | Prev |
|---|---|---|---|---|
| 21:45 | NZD | Terms of Trade Index Q4 | -0.20% | -2.10% |
| 00:30 | AUD | GDP Q/Q Q4 | 0.70% | 0.40% |
| 00:30 | JPY | Services PMI Feb F | 53.8 | 53.8 |
| 01:30 | CNY | NBS Manufacturing PMI Feb | 49.1 | 49.3 |
| 01:30 | CNY | NBS Non-Manufacturing PMI Feb | 49.8 | 49.4 |
| 01:45 | CNY | RatingDog Manufacturing PMI Feb | 50.2 | 50.3 |
| 01:45 | CNY | RatingDog Services PMI Feb | 52.3 | 52.3 |
| 05:00 | JPY | Consumer Confidence Index Feb | 38.2 | 37.9 |
| 07:30 | CHF | CPI M/M Feb | 0.50% | -0.10% |
| 07:30 | CHF | CPI Y/Y Feb | -0.10% | 0.10% |
| 08:50 | EUR | France Services PMI Feb F | 49.6 | 49.6 |
| 08:55 | EUR | Germany Services PMI Feb F | 53.4 | 53.4 |
| 09:00 | EUR | Eurozone Services PMI Feb F | 51.8 | 51.8 |
| 09:30 | GBP | Services PMI Feb F | 53.9 | 53.9 |
| 10:00 | EUR | Eurozone Unemployment Rate Jan | 6.20% | 6.20% |
| 10:00 | EUR | Eurozone PPI M/M Jan | 0.20% | -0.30% |
| 10:00 | EUR | Eurozone PPI Y/Y Jan | -2.70% | -2.10% |
| 13:15 | USD | ADP Employment Change Feb | 45K | 22K |
| 13:30 | CAD | Labor Productivity Q/Q Q4 | -0.10% | 0.90% |
| 15:00 | USD | ISM Services PMI Feb | 53.8 | 53.8 |
| 15:30 | USD | Crude Oil Inventories (Feb 27) | 3.0M | 16.0M |
| 19:00 | USD | Fed's Beige Book |
| 21:45 | NZD |
| Terms of Trade Index Q4 | |
| Consensus | -0.20% |
| Previous | -2.10% |
| 00:30 | AUD |
| GDP Q/Q Q4 | |
| Consensus | 0.70% |
| Previous | 0.40% |
| 00:30 | JPY |
| Services PMI Feb F | |
| Consensus | 53.8 |
| Previous | 53.8 |
| 01:30 | CNY |
| NBS Manufacturing PMI Feb | |
| Consensus | 49.1 |
| Previous | 49.3 |
| 01:30 | CNY |
| NBS Non-Manufacturing PMI Feb | |
| Consensus | 49.8 |
| Previous | 49.4 |
| 01:45 | CNY |
| RatingDog Manufacturing PMI Feb | |
| Consensus | 50.2 |
| Previous | 50.3 |
| 01:45 | CNY |
| RatingDog Services PMI Feb | |
| Consensus | 52.3 |
| Previous | 52.3 |
| 05:00 | JPY |
| Consumer Confidence Index Feb | |
| Consensus | 38.2 |
| Previous | 37.9 |
| 07:30 | CHF |
| CPI M/M Feb | |
| Consensus | 0.50% |
| Previous | -0.10% |
| 07:30 | CHF |
| CPI Y/Y Feb | |
| Consensus | -0.10% |
| Previous | 0.10% |
| 08:50 | EUR |
| France Services PMI Feb F | |
| Consensus | 49.6 |
| Previous | 49.6 |
| 08:55 | EUR |
| Germany Services PMI Feb F | |
| Consensus | 53.4 |
| Previous | 53.4 |
| 09:00 | EUR |
| Eurozone Services PMI Feb F | |
| Consensus | 51.8 |
| Previous | 51.8 |
| 09:30 | GBP |
| Services PMI Feb F | |
| Consensus | 53.9 |
| Previous | 53.9 |
| 10:00 | EUR |
| Eurozone Unemployment Rate Jan | |
| Consensus | 6.20% |
| Previous | 6.20% |
| 10:00 | EUR |
| Eurozone PPI M/M Jan | |
| Consensus | 0.20% |
| Previous | -0.30% |
| 10:00 | EUR |
| Eurozone PPI Y/Y Jan | |
| Consensus | -2.70% |
| Previous | -2.10% |
| 13:15 | USD |
| ADP Employment Change Feb | |
| Consensus | 45K |
| Previous | 22K |
| 13:30 | CAD |
| Labor Productivity Q/Q Q4 | |
| Consensus | -0.10% |
| Previous | 0.90% |
| 15:00 | USD |
| ISM Services PMI Feb | |
| Consensus | 53.8 |
| Previous | 53.8 |
| 15:30 | USD |
| Crude Oil Inventories (Feb 27) | |
| Consensus | 3.0M |
| Previous | 16.0M |
| 19:00 | USD |
| Fed's Beige Book | |
| Consensus | |
| Previous | |
Thursday, Mar 5, 2026
| GMT | Ccy | Events | Cons | Prev |
|---|---|---|---|---|
| 00:30 | AUD | Trade Balance (AUD) Jan | 3.95B | 3.37B |
| 07:45 | EUR | France Industrial Output M/M Jan | 0.40% | -0.70% |
| 08:00 | CHF | Unemployment Rate M/M Feb | 3.00% | 2.90% |
| 09:30 | GBP | Construction PMI Feb | 47.9 | 46.4 |
| 10:00 | EUR | Eurozone Retail Sales M/M Jan | 0.20% | -0.50% |
| 12:30 | EUR | ECB Meeting Accounts | ||
| 13:30 | USD | Initial Jobless Claims (Feb 27) | 215K | 212K |
| 13:30 | USD | Import Price Index M/M Jan | 0.20% | 0.10% |
| 13:30 | USD | Nonfarm Productivity Q4 P | 1.70% | 4.90% |
| 13:30 | USD | Unit Labor Costs Q4 P | 2.20% | -1.90% |
| 15:30 | USD | Natural Gas Storage (Feb 27) | -122B | -52B |
| 00:30 | AUD |
| Trade Balance (AUD) Jan | |
| Consensus | 3.95B |
| Previous | 3.37B |
| 07:45 | EUR |
| France Industrial Output M/M Jan | |
| Consensus | 0.40% |
| Previous | -0.70% |
| 08:00 | CHF |
| Unemployment Rate M/M Feb | |
| Consensus | 3.00% |
| Previous | 2.90% |
| 09:30 | GBP |
| Construction PMI Feb | |
| Consensus | 47.9 |
| Previous | 46.4 |
| 10:00 | EUR |
| Eurozone Retail Sales M/M Jan | |
| Consensus | 0.20% |
| Previous | -0.50% |
| 12:30 | EUR |
| ECB Meeting Accounts | |
| Consensus | |
| Previous | |
| 13:30 | USD |
| Initial Jobless Claims (Feb 27) | |
| Consensus | 215K |
| Previous | 212K |
| 13:30 | USD |
| Import Price Index M/M Jan | |
| Consensus | 0.20% |
| Previous | 0.10% |
| 13:30 | USD |
| Nonfarm Productivity Q4 P | |
| Consensus | 1.70% |
| Previous | 4.90% |
| 13:30 | USD |
| Unit Labor Costs Q4 P | |
| Consensus | 2.20% |
| Previous | -1.90% |
| 15:30 | USD |
| Natural Gas Storage (Feb 27) | |
| Consensus | -122B |
| Previous | -52B |
Friday, Mar 6, 2026
| GMT | Ccy | Events | Cons | Prev |
|---|---|---|---|---|
| 08:00 | CHF | Foreign Currency Reserves (CHF) Feb | 712B | |
| 10:00 | EUR | Eurozone GDP Q/Q Q4 F | 0.30% | 0.30% |
| 13:30 | USD | Retail Sales M/M Jan | -0.20% | 0.00% |
| 13:30 | USD | Retail Sales ex Autos M/M Jan | 0.00% | 0.00% |
| 13:30 | USD | Nonfarm Payrolls Feb | 65K | 130K |
| 13:30 | USD | Unemployment Rate Feb | 4.30% | 4.30% |
| 13:30 | USD | Average Hourly Earnings M/M Feb | 0.30% | 0.40% |
| 15:00 | USD | Business Inventories Dec | 0.10% | 0.10% |
| 15:00 | CAD | Ivey PMIFeb | 51.2 | 50.9 |
| 08:00 | CHF |
| Foreign Currency Reserves (CHF) Feb | |
| Consensus | |
| Previous | 712B |
| 10:00 | EUR |
| Eurozone GDP Q/Q Q4 F | |
| Consensus | 0.30% |
| Previous | 0.30% |
| 13:30 | USD |
| Retail Sales M/M Jan | |
| Consensus | -0.20% |
| Previous | 0.00% |
| 13:30 | USD |
| Retail Sales ex Autos M/M Jan | |
| Consensus | 0.00% |
| Previous | 0.00% |
| 13:30 | USD |
| Nonfarm Payrolls Feb | |
| Consensus | 65K |
| Previous | 130K |
| 13:30 | USD |
| Unemployment Rate Feb | |
| Consensus | 4.30% |
| Previous | 4.30% |
| 13:30 | USD |
| Average Hourly Earnings M/M Feb | |
| Consensus | 0.30% |
| Previous | 0.40% |
| 15:00 | USD |
| Business Inventories Dec | |
| Consensus | 0.10% |
| Previous | 0.10% |
| 15:00 | CAD |
| Ivey PMIFeb | |
| Consensus | 51.2 |
| Previous | 50.9 |
Weekly Gold (XAU/USD) Forecast: US-Iran Standoff Trumps US PPI, Setting Stage for $5300/oz
- Gold has pushed above the $5200/oz handle, eyeing a seventh straight monthly gain.
- The rally is primarily driven by a surge in haven demand following news of potential imminent US military action against Iran, escalating geopolitical risk.
- High-impact US data next week (ISM, jobs report) will influence the US Dollar. The Fed is not anticipated to cut rates until at least June due to lukewarm job breadth and elevated price pressures.
- Gold maintains a bullish trajectory, with the next resistance challenges at $5249/oz and $5300/oz, and downside support at $5,150/oz.
Gold prices have pushed beyond the $5200/oz handle on Friday with a hot US PPI print failing to deter Gold bulls. The PPI release led to temporary US Dollar strength but the DXY has since pushed lower to trade in the red for the day.
As discussed in the previous piece on February 25, Gold needs acceptance above the $5200 for bulls to seize the initiative. Well, what better way to achieve this than a break and weekly candle close above the $5200/oz handle?
Gold fundamental outlook
Gold is heading into the end of February eyeing a seventh straight monthly gain. The recent selloff did give market participants food for thought but a renewed surge in haven demand has boosted the precious metal.
News earlier today from various sources point to the potential of an imminent US attack on Iran. Chinese authorities have warned their citizens to leave Iran and Israel while an Al-Arabiya correspondent on X posted that the US State Department has ordered the evacuation of non-essential staff and their families from the US Embassy in Baghdad.
These moves together point to a rise in geopolitical risk which could explain the rally to end the week.
Add to this the pivot away from US stocks and NVIDIA selloff post what was a rather upbeat earnings outlook, markets appear to have found the needed catalyst for bullish momentum to prevail.
Given that the weekend is ahead, any move by the US on Iran could lead to significant haven demand and thus Gold could open with a significant gap after the weekend.
This is definitely worth monitoring if you are holding trades heading into the weekend.
The week ahead - ISM, NFP in focus
The week ahead brings high impact US data releases, which together with the Geopolitical risk angle could have a massive impact on the US Dollar which remains under pressure as the DXY remains below the 98.00 handle.
The ISM Manufacturing and Services report will be a major data release next week.
The ISM showed significant strength in January, more recent regional Federal Reserve surveys indicate a slight softening in economic activity for February. Despite this cooling trend, "prices paid" components are expected to remain high, driven by rising oil prices and a heightened risk premium resulting from escalating tensions between Iran and the US.
On the labor front, the Friday jobs report is expected to reveal a steady but narrow expansion.
Current estimates suggest the economy is adding approximately 50,000 jobs per month; however, the lack of broad-based growth remains a concern. Roughly 70% of all employment gains over the last three years have been concentrated in the private education and healthcare sectors.
Following a surprise drop in the previous month, the unemployment rate is projected to tick back up to 4.4%.
Ultimately, these combined factors, a lukewarm job breadth and elevated price pressures are unlikely to prompt immediate action from the Federal Reserve.
Given this data, a rate cut is not anticipated until at least June. Will we get a surprise?
For all market-moving economic releases and events, see the MarketPulse Economic Calendar. (click to enlarge)
Technical Analysis - Gold (XAU/USD)
From a technical standpoint, Gold is currently maintaining a bullish trajectory.
A weekly candle close above the $5200/oz handle will ensure the bullish momentum remains strong heading into next week.
The next xhallenge will be a break above the $5249/oz handle before the $5300 mark comes into focus.
Of course, a US attack on Iran could see these levels smashed as the new week starts with further resistance ahead at $5337 before the $5400 handle comes into fcous.
Downside support rests at $5,150/oz. If that level fails to hold, the price may slide further toward the February 24 low of $5,093/oz.
Gold (XAU/USD) Four-Hour Chart, February 27, 2026
Source: TradingView (click to enlarge)
Week Ahead – All Eyes on Nonfarm Payrolls and ISM PMI Data
- Investors reduce Fed cut bets ahead of NFP and ISM PMI data.
- Eurozone CPI and ECB minutes in focus amid strong euro concerns.
- Will Japan’s employment numbers allow the BoJ to hike rates in April?
- Australian GDP and Switzerland’s inflation numbers also in focus.
Dollar fragile even as investors scale back Fed cut bets
The US dollar remained on the back foot against most of its major counterparts this week, gaining notable ground only against the Japanese yen. Strangely, this has been the case even after investors scaled back their rate cut bets to price in 55bps worth of rate cuts.
In early February, they were expecting around 65bps, which translates into two quarter-point reductions and a more-than-50% chance of a third. However, following the blockbuster NFP report for January, some Fed officials showed little willingness to further loosen monetary policy immediately. Even the minutes of the latest FOMC decision, which took place before the jobs data revealed a divided Committee, with several members open to rate hikes if inflation remains elevated and others leaning towards more rate cuts should inflation further cool down.
Maybe the dollar stayed on the back foot as, even with 55bps worth of expected rate cuts, the Fed remains the most dovish major central bank, keeping the divergence with some others, like the RBA, very wide. The greenback may have also been sold following the latest saga between US President Trump and the Supreme Court. After the court ruled some of Trump’s tariffs as illegal, the US President announced a 15% duty on global goods, using a law that does not fall under the court’s decision.
NFP and ISM PMI data take center stage
With all that in mind, next week, dollar traders are likely to lock their gaze on the US employment report for February, but before the NFP release, the ISM manufacturing and services PMIs on Monday and Wednesday may also attract special attention. The Atlanta Fed GDPNow model is pointing to a rebound in economic growth from 1.4% in Q4 to 3.1% in Q1, and should this be confirmed by the ISM numbers, the dollar is likely to strengthen as investors become more convinced that the Fed does not need to rush into further lowering borrowing costs.
However, given the Fed’s dual mandate of full employment and stable inflation at 2%, investors may put some emphasis on the employment and prices subindices of the ISM surveys. The ADP private employment report on Wednesday could also be monitored ahead of Friday’s non-farm payrolls.
Although the Bureau of Labor Statistics (BLS) announced strong jobs data for January, the ADP reported sluggish growth in private employment during the month, while the JOLTS job openings dropped to their lowest since September 2020 in December. This means that more improvement in labor market data may be needed for investors to further scale back their rate cut bets. That said, for the dollar to stage a meaningful and lasting recovery, rate cut expectations may need to start reflecting less than 50bps worth of rate cuts. In other words, traders may need to start questioning a second quarter-point reduction for 2026.
Will the EZ CPI data raise speculation of lower ECB rates?
The euro held onto its gains, with euro/dollar aided by the divergence in monetary policy expectations between the ECB and the Fed. Although at their prior gathering, ECB officials appeared worried about the latest strength of the euro, they later clarified that they see no need for an imminent policy change, allowing market participants to price in a small 25% chance of a rate cut by December.
That said, with the nominal effective exchange rate (NEER) of the euro against the currencies of 41 of Eurozone’s biggest trading partners still hovering near record highs, the preliminary CPI data for February on Tuesday could enter the spotlight.
In January, the headline CPI slowed to 1.7% y/y from 1.9%, and the core rate, which excludes the volatile items of food, energy, alcohol and tobacco, ticked down to 2.2% from 2.3%. Further slowdown in the Eurozone’s consumer prices may spark some concerns about whether a strong euro could eventually harm the broader economy, thereby prompting participants to add to the likelihood of a contingency rate cut by the ECB at some point in the foreseeable future.
This could weigh on the euro, especially if the minutes of the latest ECB gathering, due out on Thursday, reveal that there were members discussing the option of additional reductions in interest rates due to a stubbornly strong euro. Eurozone’s retail sales for January, will also be released on Thursday.
Japan’s jobs data on tap amid BoJ hike confusion
The yen saw its wounds deepening this week as focus on PM Takaichi’s plans of aggressive fiscal spending returned, with headlines hitting the wires that she expressed concerns about additional BoJ rate hikes during a meeting with Governor Ueda on February 17. She went a step further earlier this week and appointed two dovish-leaning policymakers to join the Bank’s Board.
That said, after BoJ hawk Takata insisted that more hikes are needed due to “heated” inflation, the probability of a 25bps rate hike in April rose to around 55%. A quarter-point increase is nearly fully priced in for June. Overall, market expectations suggest that the BoJ will wait for the outcome of the spring wage negotiations before deciding to press the hike button again.
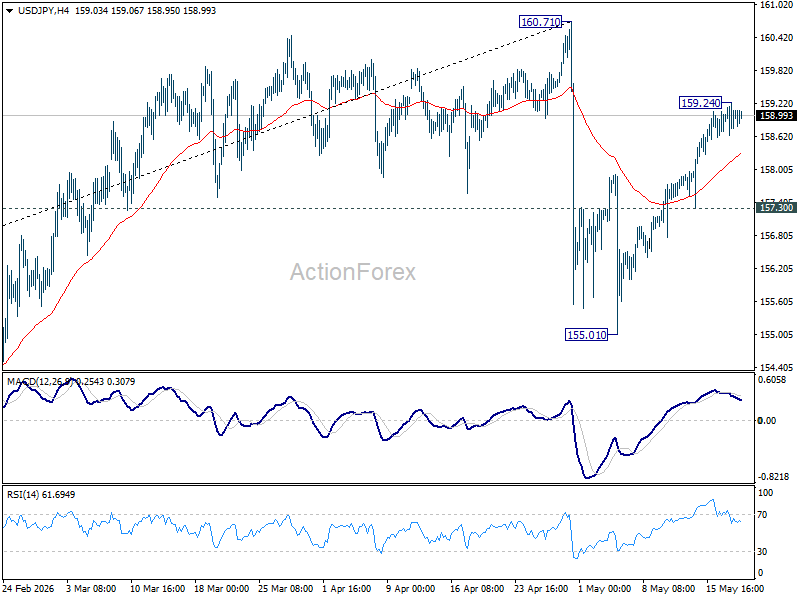
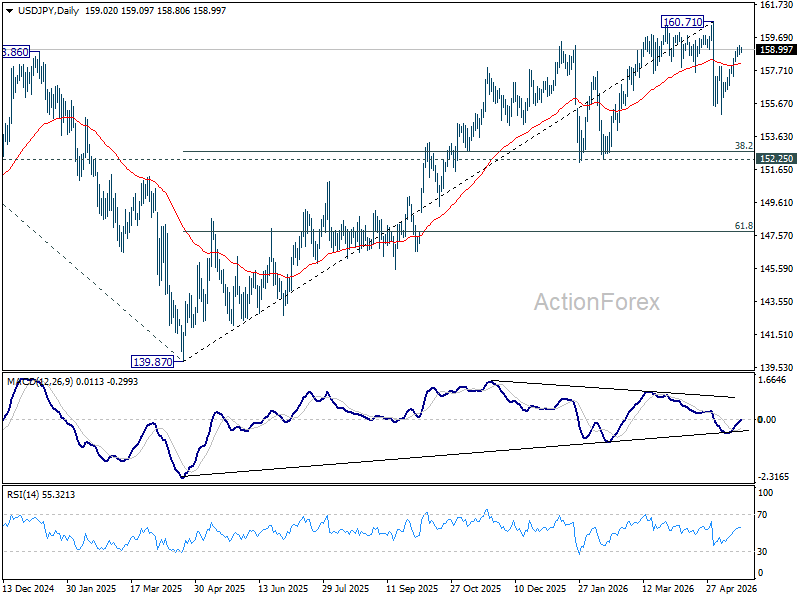
On that note, Japan’s employment report for January will be released on Tuesday and signs of further improvement could add to the notion that the BoJ may consider raising rates again in coming months and thereby support somewhat the yen. The opposite may be true in case of weak data, but further declines in the yen could trigger fresh intervention warnings by finance minister Katayama. Thus, the broader picture of dollar/yen may continue pointing to a trendless phase with volatile swings.
Aussie GDP and Swiss inflation data also on the agenda
The aussie continued benefitting from the divergence in monetary policy expectations between the RBA and the Fed, with Australia’s sticky CPI data this week keeping the probability of a back-to-back rate hike on March 17 at a low but decent 20%. Therefore, should Wednesday’s Australian GDP for Q4 and the Chinese PMIs for February come in on the strong side, the commodity-linked currency may extend its uptrend as investors become more convinced about additional RBA rate increases. Australia’s trade data will be released on Thursday.
Switzerland’s CPI data will also be released amid increased concerns about how the SNB could stop further advances in the all-mighty franc and thereby prevent the economy from falling into deflation.
The tools available for the central bank are negative interest rates and intervention, but SNB President Schlegel recently noted that the bar for adopting a negative-rate policy again is very high. Intervention may be the more likely choice, although it does not come without risks. So, should the CPI reveal that indeed prices in Switzerland stagnated or even dropped in January, concerns about potential SNB intervention may increase and the Swiss franc may be sold.