Sample Category Title
EUR/USD Takes Hit And At Risk of More Downsides
Key Highlights
- EUR/USD struggled near 1.1020 and started a fresh decline.
- It traded below a key bullish trend line with support at 1.0860 on the 4-hour chart.
- GBP/USD is also correcting gains below the 1.2600 level.
- Gold prices declined heavily and traded below $2,000.
EUR/USD Technical Analysis
The Euro failed to gather momentum above the 1.1000 level against the US Dollar. EUR/USD formed a short-term top and started a fresh decline below 1.0920.
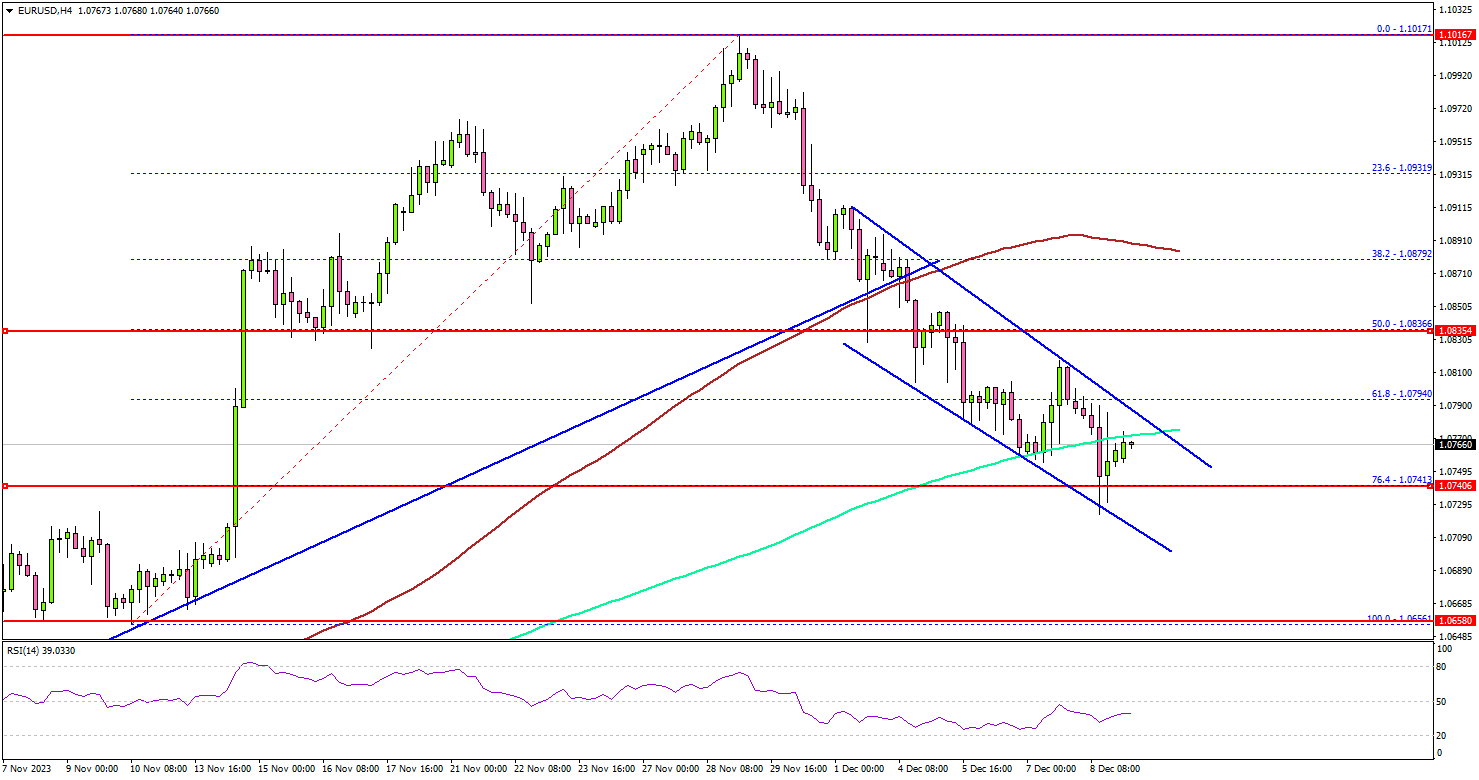
Looking at the 4-hour chart, the pair settled below the 1.0880 support, the 100 simple moving average (red, 4 hours), and the 200 simple moving average (green, 4 hours).
It traded below a key bullish trend line with support at 1.0860 on the same chart. There was a drop below the 61.8% Fib retracement level of the upward move from the 1.0656 swing low to the 1.1017 high.
The pair is now consolidating above the 76.4% Fib retracement level of the upward move from the 1.0656 swing low to the 1.1017 high.
If there is a downside break below the 1.0740 support, the pair could drop toward the 1.0700 level. The next major support is 1.0650, below which the bears might take control.
On the upside, immediate resistance is near the 1.0820 level. The next key resistance is near the 1.0880 level. The main resistance is near 1.0920. A close above the 1.0920 zone could open the doors for more upsides. The next stop for the bulls might be 1.1000.
Looking at GBP/USD, the pair is also moving lower and there is a risk of a drop toward the 1.2440 support in the near term.
Economic Releases
- Japanese Machine Tool Orders (YoY) for Nov 2023 – Forecast -18.0%, versus -20.6% previous.
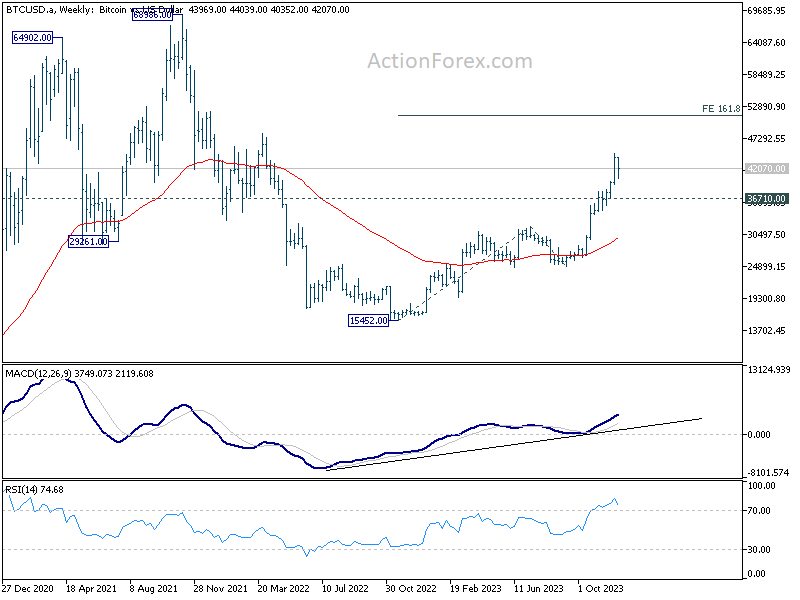
Bitcoin and Ether undergo sudden pullback as consolidation phase commences
The cryptocurrency markets saw a sharp downturn in today's Asian session. The decline doesn't seem to be triggered by any specific event and might be amplified by the typically low liquidity on Mondays in the Asian markets. Another contributing factor could be profit-taking by traders following a recent strong bull run, especially with the impending FOMC rate decision looming on Wednesday.
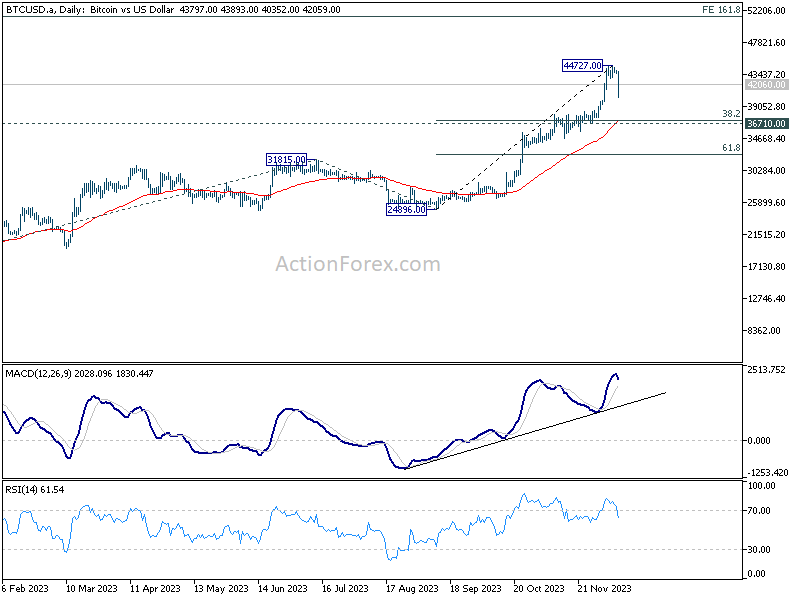
Technically speaking a short term top should be in place at 44727 in Bitcoin. Consolidations should follow in the near term, and deeper pull back cannot be ruled out. But downside should be contained by 36710 cluster support (38.2% retracement of 24896 to 44727 at 37151) to bring rebound. Larger uptrend from 15452 is expected to resume at a later stage.
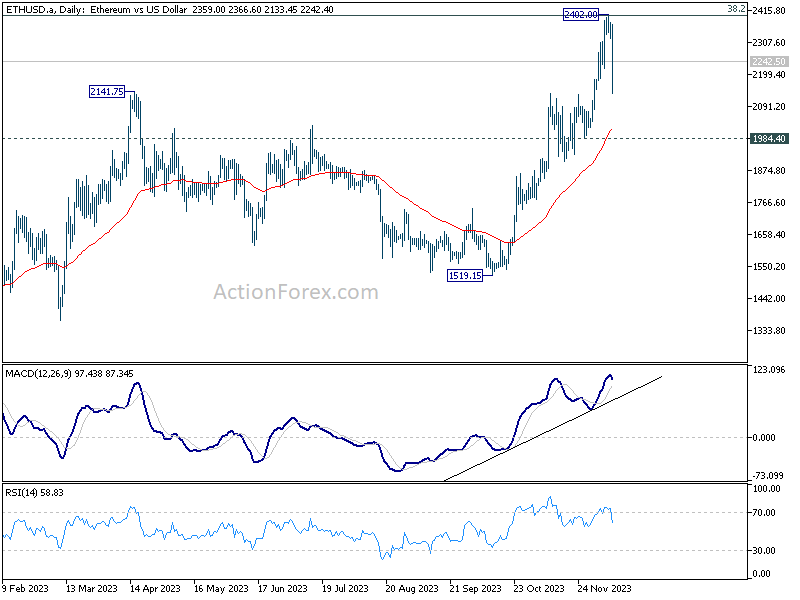
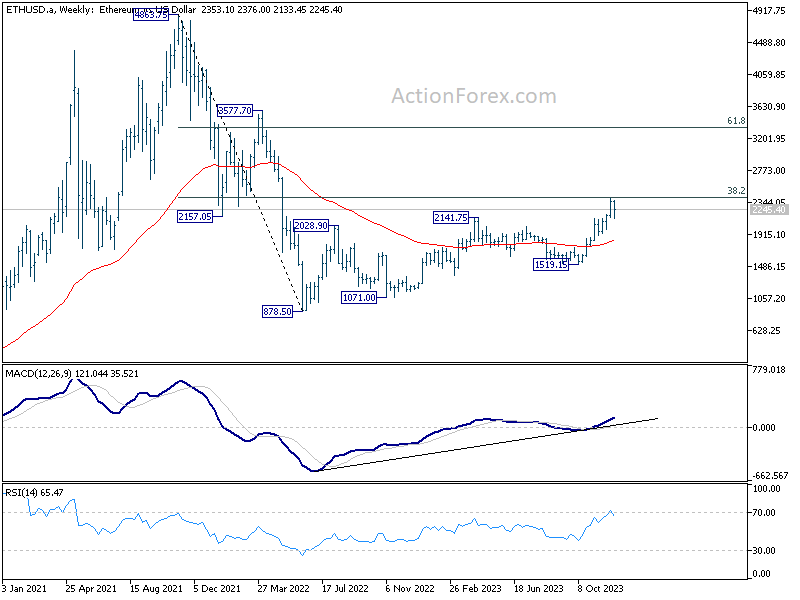
As for Ethereum, a short term top is in place at 2402, and more consolidative trading would be seen in the near term. There is risk of deeper pull back from outlook will stay cautiously bullish as long as 1984.4 support holds, which is close to 55 D EMA (now at 2017).
However, the larger outlook of Ethereum is less bullish, as it's just capped by 38.2% retracement of 4863.7 to 878.5 at 2400. Break of above mentioned 1984.4 support will indicate rejection by 2400 fibonacci level, and keeps medium term outlook neutral at best.
China’s CPI fell to -0.5% yoy in Nov, deepening deflation
Released over the weekend, China's economic data revealed a concerning trend as CPI plunged further into negative territory in November, marking the country's deepest deflationary period in three years. CPI fell to -0.5% yoy, a notable decline from -0.2% yoy in the previous month and falling short of the expected -0.2% yoy. This deflationary reading is the most significant since November 2020, indicating mounting economic pressures. Core CPI, which excludes volatile items such as food and fuel, remained stable at 0.6% yoy, mirroring October's figures.
National Bureau of Statistics chief statistician, Dong Lijuan, highlighted that the overall decline was driven primarily by decrease in energy and food prices. In particular, food prices dropped by -4.2% yoy, significantly impacted by a sharp -31.8% yoy decrease in pork prices. Meanwhile, non-food prices saw a modest increase of 0.4% yoy, with services prices climbing by 1.0% yoy.
On a month-on-month basis, CPI also experienced a downturn, falling by -0.5% mom in November from the previous month. This decline was characterized by a -0.9% drop in food prices and a -0.4% decrease in non-food prices.
From January to November, the average CPI increase was a mere 0.3% yoy, starkly undershooting China's set annual inflation target of around 3%.
Furthermore, PPI also recorded a downturn, declining by -3.0% yoy, which is worse than the prior month's -2.6% yoy and below the anticipated -2.8% yoy. This marks the 14th consecutive month of negative PPI readings, the worst since August.
Markets Daily
A solid US November employment report sparked a rise in US yields, though a slide in consumer inflation expectations reinforced Fed easing expectations. Equities rallied but AUD slipped to 0.6570. This week’s calendar is crowded but there is little today.
Friday
Australia’s calendar was quiet though we did see the Statement on the Conduct of Monetary Policy agreed between the Treasurer and the RBA Board. This marks the next step in the response to the RBA Review earlier this year. The changes are in line with the Review recommendations. We expect the February post-meeting communication to include unattributed votes and much more detailed forecasts. Most regional bourses rallied, the ASX 200’s 0.3% gain an underperformance. The exception was Japan, where further (more modest) upward pressure on Japanese government bond yields and the yen upset the Nikkei 225.
Currencies/Macro
The US dollar rose against all G10 currencies except CAD on Friday on the better profile of data and the rebound against JPY. EUR/USD was volatile, closing at 1.0762 (-0.3%) but off a spike low of 1.0724, GBP closed -0.35% at 1.2550. USD/CAD chopped around 1.3580. AUD/USD was around 0.6600 pre-NFP and opens the week around 0.6570. NZD/USD slipped about 55 pips or -0.9% to 0.6120, leaving AUD/NZD up 40 pips at 1.0745.
US November non-farm payrolls rose 199k (consensus 185k) though the prior two months were revised down a combined -35k. November unemployment declined to 3.7% (consensus unchanged at 3.9%) and underemployment pared back to 7.0% from prior 7.2%. The participation rate ticked up to 62.8% (prior 62.7%), but the pullback in unemployment was more pronounced. Average weekly hours worked also rose to 34.4 (est. unch. at 34.3) though average hourly earnings were unchanged (as expected) at 4.0%y/y.
US preliminary December consumer sentiment (University of Michigan) firmed to 69.4 (est. 62.0, prior 61.3) on higher expectations of 66.4 (est. 57.0, prior 56.8) and current conditions at 74.0 (est. 68.5, prior 68.3). Inflation expectations surprised with 1yr pulling back to 3.1% (est. 4.3%, prior 4.5%) and 5-10yr slipping to 2.8% (est. 3.1%, prior 3.2%).
UK November BoE/Ipsos 12 month Inflation Expectation pulled back to 3.3% (prior 3.6%).
German final November CPI was unchanged from preliminary levels with headline CPI at 3.2% and EU harmonised 2.3%.
Interest rates
The US 2yr treasury yield bounced from 4.63% pre-data to 4.72% while 10yr yields firmed from 4.18% pre-NFP to 4.225%. Though markets are not pricing any move at this week’s FOMC meeting, March 2024 pricing was pared back to around 70% for a cut, and December 2024 Fed pricing pared back some 16bps to -111bps or 4.22%.
Australian 3yr government bond yields (futures) pared -7bps to imply 3.97%, while 10yr yields also firmed +6bps to 4.36%. Market pricing in February 2024 and March 2024 is effectively for zero change.
New Zealand rates markets price the OCR, currently at 5.50%, to be unchanged on 28 February, with no further rate hikes in this cycle, and around 30bps cut for August 2024.
Credit spreads were firm with Main marginally tighter at 66.5, CDX in a bp to 61.5 to be just off its ytd lows, and US IG cash was 1-3bp better on the combination of sound underlying sentiment and lack of primary activity (no supply in either Europe or the US on Friday) as the year draws to a close. The majority of the remaining supply for the year is expected to be completed early this week ahead of the Fed.
Commodities
Crude markets managed a small bounce on Friday as equity markets hit 21-month highs though we still closed lower on the week, for the seventh consecutive weekly loss. The US DoE announced it will purchase 3mmb of crude for March delivery and will hold monthly tenders through at least May to refill the SPR. The DoE has bought close to 9mmb in 2023 and has secured nearly 4mmb on exchange returns so far this year. Venezuelan President Maduro threatened to annex the disputed oil region of Essequibo which is claimed by Guyana after holding a referendum last week which, if he follows through, would likely see US sanctions reinstated. Guyana is intensifying border security measures while Brazil has increased its military presence along its borders. The US has called on Venezuela to respect the territory as Guyana’s until the matter is settled. Guyana has denounced Venezuelan aggression and vowed to resist the claim. Exxon and Chevron are significant operators in the region. Reuters reported that the Venezuelan President Maduro and Guyana President Mohamed Irfaan Ali will meet on Thursday to discuss the dispute. Bloomberg reported that Europe is poised for an influx of US diesel this month according to data from Kpler as a result of worsening bottlenecks in the Panama Canal. And the EU reached a deal Friday that would allow member states to ban Russian LNG without EU wide sanctions.
Metals ended the week on a positive note with copper bouncing 1.15% to $8,438 and nickel up 1.8% to $16,805. There was little fresh news though the ‘Goldilocks’ NFP report and risk on move helped lift sentiment. First Quantum called on Panama to clear “illegal roadblocks” noting that the “access road to the mine and the international port must be urgently cleared”. Over the weekend however the Panama government formally ordered First Quantum to end all operations at the Cobre Panama mine. Anglo American shares plunged 18% Friday after it announced plans to cut copper production in mines including the Los Bronces mine in Chile. Chinese press noted that a Politburo meeting was held December 8, vowing that fiscal policy will be stepped up “appropriately” under the slogan of “using progress to promote stability” though monetary policy was ‘downgraded’ to “targeted” rather than forceful.
Iron ore markets closed the week on a high with the Politburo meeting lifting sentiment further. The January SGX contract is down 15c from the same time Friday morning at $134.60 though the 62% Mysteel index rose $1.35 to $137.30. The FT reported that the authorities have told steel manufacturers that annual production caps would not apply this year while the weaker yuan has allowed excess steel supply to be exported, helping iron ore prices to surge against expectations. Chinese iron ore imports in November came in at 102.74mt up 7.3% versus the 5yr seasonal average. China will report industrial production and fixed asset investment for November on Friday. Mysteel will also hold its annual steel conference in Shanghai on Friday.
Day ahead
A huge week for central bank meetings – Fed, Bank of England, ECB – starts with a quiet calendar.
NZ: November’s REINZ house sales and REINZ house prices are expected to reflect a strengthening housing market, though interest rates are still a suppressing factor.
UK: Following recent rapid falls, December’s Rightmove house prices are expected to be near lows.
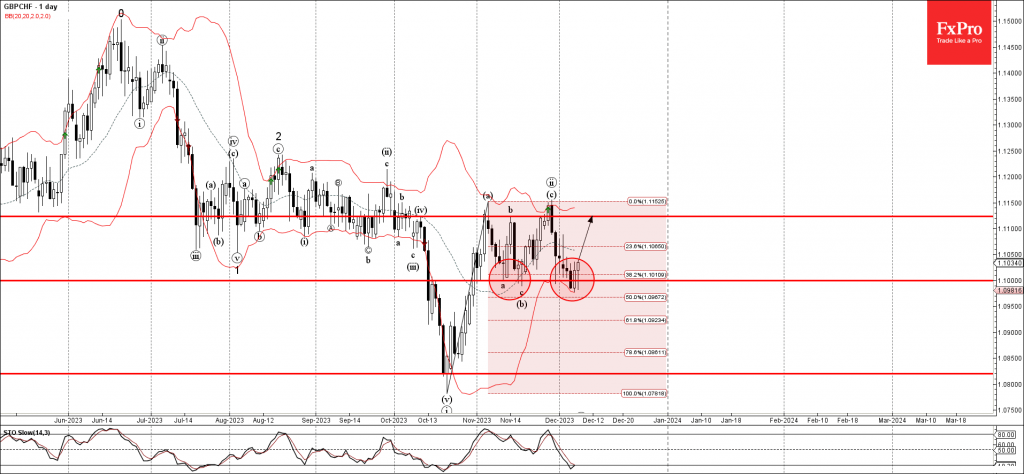
GBPCHF Wave Analysis
- GBPCHF reversed from support level 1.1000
- Likely to rise to resistance level 1.1125
GBPCHF recently reversed up from the round support level 1.1000, lower boundary of the sideways price range inside which the pair has been trading from the start of November.
The support level 1.1000 was strengthened by the lower daily Bollinger Band and by the 38.2% Fibonacci correction of the upward impulse from October.
Given the strength of the support level 1.1000, GBPCHF currency pair can be expected to rise further to the next resistance level 1.1125 (upper boundary of the active sideways price range).
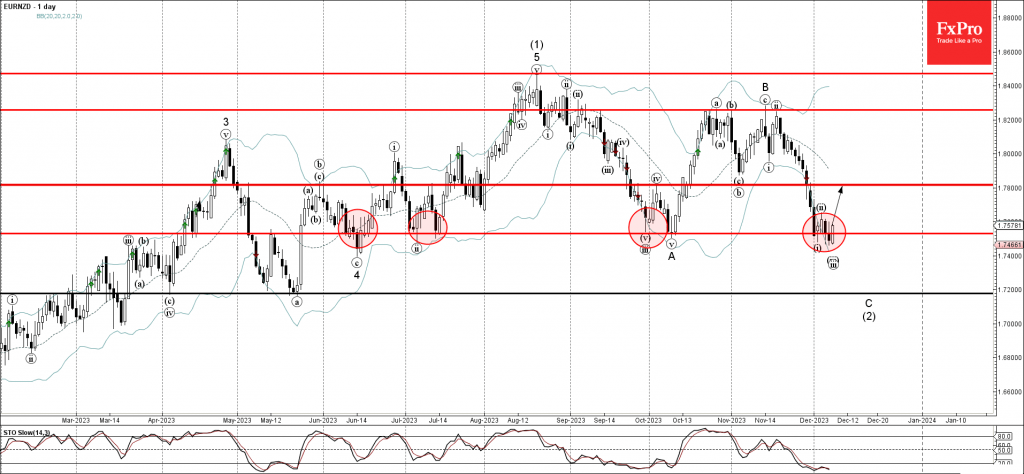
EURNZD Wave Analysis
- EURNZD reversed from support level 1.7530
- Likely to rise to resistance level 1.7800
EURNZD recently reversed up from the strong support level 1.7530, which has been steadily reversing the pair from the middle of January.
The support level 1.7530 was strengthened by the lower daily Bollinger Band.
Given the strength of the support level 0.9420 and the oversold daily Stochastic, EURNZD can be expected to rise further to the next resistance level 1.7800.
Forex and Cryptocurrencies
EUR/USD: Continuation of the Rate War
The labour market and inflation: these are the factors that Central Banks closely monitor when making decisions regarding monetary policy and interest rates. It is sufficient to recall the significant shift that occurred after the publication of October's inflation data in the United States. In November, the dollar weakened significantly, and the classical portfolio of stocks and bonds yielded the highest profit in 30 years! EUR/USD, starting at 1.0516, reached a monthly peak on November 29 at 1.1016.
Regarding the labour market, crucial indicators were released on Friday, December 8, including the unemployment rate and the number of new non-farm payrolls (NFP) in the United States. The first indicator revealed a decline in unemployment: in November, the rate dropped to 3.7%, surpassing both the forecast and the previous value of 3.9%. The second indicator showed an increase in the number of new jobs: 199K were created in a month, surpassing both the October figure of 150K and the market expectations of 180K. It cannot be said that such statistics significantly supported the dollar. However, at the very least, it did not harm it.
Two to three months ago, the market's reaction to such data would have been more intense, as there were still hopes for further increases in the Federal Reserve's interest rates in 2023. Now, those expectations are nearly reduced to zero. The discussions revolve not around how the key rate will rise, but rather how long it will be maintained at the current level of 5.50% and how actively the regulator will reduce it.
An economist survey conducted by Reuters revealed that just over half of the respondents (52 out of 102) believe that the rate will remain unchanged at least until July. The remaining 50 respondents expect the Federal Reserve to start cutting before that. 72 out of 100 respondents believe that by 2024, the rate will gradually be reduced by a maximum of 100 basis points (bps), possibly even less. Only 5 experts still hold hope for further rate increases, even if it's just by 25 bps. It's worth noting that Reuters' survey results do not align with the immediate market expectations, which forecast five rate cuts of 25 bps each starting from March.
A Citi economist, as part of the Reuters survey, noted that an increase in core inflation would disrupt the narrative of the Federal Reserve lowering interest rates and delay this process. The upcoming inflation data in the United States will be available on Tuesday, December 12, and Wednesday, December 13, with the release of the November Consumer Price Index (CPI) and Producer Price Index (PPI), respectively. Following this, on Wednesday, we can expect the Federal Open Market Committee (FOMC) meeting of the U.S. Federal Reserve, where decisions on interest rates will be made. Market participants will undoubtedly focus on the economic forecasts presented by the FOMC and the comments from the leadership of the Federal Reserve.
However, it's not only the Federal Reserve that influences the EUR/USD pair; the European Central Bank (ECB) also plays a significant role, and its meeting is scheduled for next week on Thursday, December 14. Currently, the base rate for the euro stands at 4.50%. Many market participants believe it is too high and could push the fragile economy of the region into recession.
Deflation in the Eurozone is considerably outpacing that in the United States. Last week, Eurostat reported that, according to preliminary data, the Harmonized Index of Consumer Prices (HICP) fell to its lowest level since June 2021, at 2.4% (y/y), which is lower than both October's 2.9% and the expected 2.7%. This is very close to the target level of 2.0%. Hence, to support the economy, the ECB may soon initiate the process of easing its monetary policy.
Market forecasts suggest that the first cut in the key rate could occur in April, with a 50% probability even a month earlier in March. There is a 70% probability that by 2024, the rate will be reduced by 125 bps. However, the consensus estimate among Reuters experts is more conservative, anticipating a decrease of only 100 bps.
So, the rate war between the Federal Reserve and the European Central Bank will continue. While the one who previously prevailed was the one with faster advancing rates, now the advantage will be with the one whose retreat occurs more slowly. It is entirely possible that investors will receive some information regarding the regulators' plans after their meetings next week.
As for the past week, EUR/USD concluded at the level of 1.0760. Currently, expert opinions regarding the pair's immediate future are divided as follows: 75% voted for the strengthening of the dollar, while 25% sided with the euro. Among trend indicators on D1, the distribution is the same as with experts: 75% for the dollar and 25% for the euro. For oscillators, 75% favor the red side (with a quarter of them in the overbought zone), while 10% point in the opposite direction, and 15% remain neutral.
The nearest support for the pair is situated around 1.0725-1.0740, followed by 1.0620-1.0640, 1.0500-1.0520, 1.0450, 1.0375, 1.0200-1.0255, 1.0130, and 1.0000. Bulls will encounter resistance around 1.0800-1.0820, 1.0865, 1.0965-1.0985, 1.1020, 1.1070-1.1110, 1.1150, 1.1230-1.1275, 1.1350, and 1.1475.
In addition to the events mentioned earlier, the economic calendar highlights the release of the summary data on the U.S. retail market on Thursday, December 14th. On the same day, the number of initial claims for unemployment benefits will be traditionally published, and on December 15th, the preliminary values of the Purchasing Managers' Index (PMI) in the manufacturing and services sectors of the United States will be released. Additionally, on Friday, preliminary data on business activity in Germany and the Eurozone as a whole will be disclosed.
GBP/USD: Should We Expect a Surprise from the BoE?
The Bank of England (BoE) conducted its quarterly survey on December 8. It turns out that inflation expectations for the UK population in November 2024 are 3.3%, which is lower than the previous quarter's figure of 3.6%. Meanwhile, 35% of the country's population believes that they would personally benefit from a decrease in interest rates. In other words, the majority (65%) is not concerned about this indicator. However, it is a matter of concern for market participants.
The BoE meeting will also take place next week, on Thursday, December 14, shortly before the ECB meeting. What will be the decision on the interest rate? Lately, the hawkish rhetoric of the Bank of England's leadership has verbally supported the British currency. For instance, BoE Governor Andrew Bailey recently stated that rates should rise for longer, even if it may negatively impact the economy. However, experts predict that the regulator will likely maintain the status quo at the upcoming meeting, keeping the key interest rate at 5.25%, which is already the highest level in the last 15 years.
Expectations for the rate in 2024 imply an 80 bps decrease to 4.45%. If the Federal Reserve lowers its rate to 4.25%, it would give the pound some hope for strengthening. However, this is a matter of the relatively distant future. Last week, the dollar actively recouped November losses, resulting in the GBP/USD pair finishing the five-day period at 1.2548.
Speaking of its immediate future, 30% voted for the pair's rise, another 30% for its fall, and 40% remained indifferent. Among trend indicators on D1, 60% point north, while 40% point south. Among oscillators, only 15% are bullish, 50% bearish, and the remaining 35% remain neutral. In the event of the pair moving south, it will encounter support levels and zones at 1.2500-1.2520, 1.2450, 1.2370, 1.2330, 1.2210, 1.2070-1.2085, and 1.2035. In case of an upward movement, the pair will face resistance at levels 1.2575, then 1.2600-1.2625, 1.2695-1.2735, 1.2800-1.2820, 1.2940, 1.3000, and 1.3140.
Among the important events in the upcoming week, in addition to the Bank of England meeting, the release of a comprehensive set of data from the United Kingdom labour market is scheduled for Tuesday, December 12. Additionally, the country's GDP figures will be published on Wednesday, December 13.
USD/JPY: Is the Bank of Japan Losing Caution?
The strengthening of the Japanese currency has taken on a sustained character since the beginning of November. This occurred a couple of weeks after the peak in yields of U.S. ten-year Treasury bonds when the markets were convinced that their decline had become a trend. It's worth noting that there is traditionally an inverse correlation between these securities and the yen. If Treasury yields rise, the yen weakens against the dollar. Conversely, if bond yields fall, the yen strengthens its positions.
A significant moment for the Japanese currency was on Thursday, December 7, when it strengthened across the market spectrum, gaining approximately 225 points against the U.S. dollar and reaching a three-month peak. USD/JPY recorded its minimum at that moment at the level of 141.62.
The main reason for the yen's advance has been the growing expectations that the Bank of Japan (BoJ) will finally abandon its negative interest rate policy, and this is expected to happen sooner than anticipated. Rumours suggest that regional banks in the country are pressuring the regulator, advocating for a departure from the yield curve control policy.
As if to confirm these rumours, the BoJ conducted a special survey of market participants to discuss the consequences of abandoning the ultra-loose monetary policy and the side effects of such a move. Additionally, the visit of the BoJ Governor, Kadsuo Ueda, to the office of Prime Minister Fumio Kishida, added fuel to the fire.
The yen is also benefiting from market confidence that the key interest rates of the Federal Reserve (FRS) and the European Central Bank (ECB) have reached a plateau, and further reductions are the only expectation. As a result of such a divergence, an accelerated narrowing of yield spreads between Japanese government bonds on one side and similar securities from the US and Eurozone on the other can be predicted. This is expected to redirect capital flows into the yen.
Furthermore, the Japanese currency might have been supported by the slowdown in the growth of stock markets over the past three weeks. The yen is often used as a funding currency for purchasing risky assets. Therefore, profit-taking on stock indices such as S&P500, Dow Jones, Nasdaq, and others has additionally pushed USD/JPY lower.
Graphical analysis indicates that in October 2022 and November 2023, the pair formed a double top, reaching a peak at 151.9. Therefore, from this perspective, its retracement downward is quite logical. However, some experts believe that a definitive reversal on the daily timeframe (D1) can only be discussed after it breaks through support in the 142.50 zone. However, at the time of writing this review, on the evening of Friday, December 8th, thanks to strong US labor market data, USD/JPY rebounded from a local low, moved upward, and concluded at 144.93.
In the immediate future, 45% of experts anticipate further strengthening of the yen, 30% side with the dollar, and 25% remain neutral. As for indicators on D1, the advantage is overwhelmingly in favour of the red colour. 85% of trend indicators are coloured red, 75% of oscillators are in the red, and only 25% are in the green.
The nearest support level is located in the 143.75-144.05 zone, followed by 141.60-142.20, 140.60, 138.75-139.05, 137.25-137.50, 135.90, 134.35, and 131.25. Resistances are positioned at the following levels and zones: 145.30, 146.55-146.90, 147.65-147.85, 148.40, 149.20, 149.80-150.00, 150.80, 151.60, and 151.90-152.15.
Except for the release of the Tankan Large Manufacturers' Index on December 13 for Q4, there is no anticipation of other significant macroeconomic statistics regarding the state of the Japanese economy.
CRYPTOCURRENCIES: Rational Growth or Speculative Frenzy?
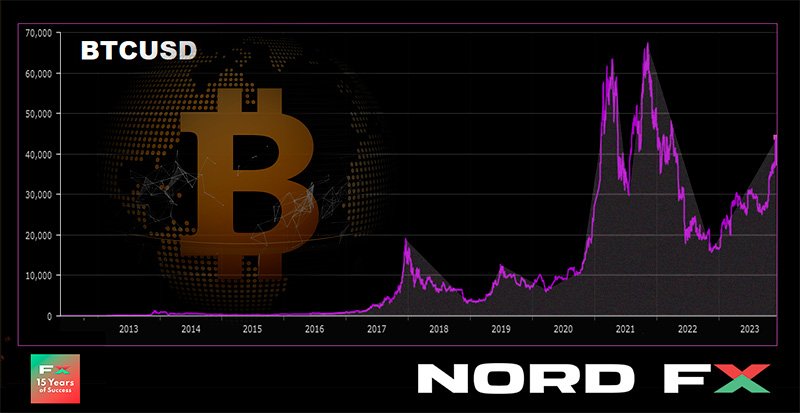
Late in the evening on December 8, the flagship cryptocurrency reached a peak of $44,694. The last time BTC traded above $40,000 was in April 2022, before the Terra ecosystem crash triggered a massive crypto market collapse. Among the reasons for the sharp rise in BTC, growing network hash rate, investor optimism about the U.S. economic recovery, and expectations of a Federal Reserve policy easing are mentioned. However, the main reason for the current bull rally is undoubtedly the potential approval of spot Bitcoin ETFs in the U.S.
Twelve companies have submitted applications to the Securities and Exchange Commission (SEC) to create ETFs, collectively managing over $20 trillion in assets. For comparison, the entire market capitalization of bitcoin is $0.85 trillion. These companies will not only offer existing clients the opportunity to diversify their assets through cryptocurrency investments but also attract new investors, significantly boosting BTC capitalization. Franklin Templeton CEO Jenny Johnson, overseeing $1.4 trillion in assets, recently explained the increased institutional interest, stating, "The demand for bitcoin is evident, and a spot ETF is the best way to access it." Bloomberg analyst James Seyffart believes that the approval of these fund launches is 90% likely to occur from January 5 to 10.
According to Bitfinex experts, the current active supply of bitcoin has dropped to a five-year low: only 30% of the coins have moved in the past year. Consequently, approximately 70% of bitcoins, or "unprecedented" 16.3 million BTC, remained dormant over the year. At the same time, 60% of the coins have been in cold wallets for two years. Simultaneously, as noted by Glassnode, the average deposit amount on cryptocurrency exchanges has approached absolute highs, reaching $29,000. Considering that the number of transactions is continuously decreasing, this indicates the dominance of large investors.
Alongside the bitcoin rally, stock prices of related companies have also surged. In particular, shares of Coinbase, MicroStrategy, miners Riot Platforms, Marathon Digital, and others have seen an increase.
Senior Macro Strategist at Bloomberg Intelligence, Mike McGlone, believes that bitcoin is currently demonstrating much greater strength than gold. He noted that on December 4, the price of gold reached a record high, after which it decreased by 5.1%, while bitcoin continued to rise, surpassing $44,000. However, the analyst warned that bitcoin's volatility could hinder it from being traded as reliably as physical gold during "risk-off" periods. According to McGlone, for bitcoin to compete with precious metals as an alternative asset, it must establish key reliability indicators. This includes a negative correlation of BTC with the stock market and achieving a high deficit during periods of monetary expansion.
McGlone's warning pales in comparison to the forecast of Peter Schiff, President of the brokerage firm Euro Pacific Capital. This well-known crypto sceptic and advocate for physical gold is confident that the speculative frenzy around BTC-ETF will soon come to an end. "This could be the swan song... The collapse of Bitcoin will be more impressive than its rally," he warns investors.
Former SEC official John Reed Stark echoes his sentiments. "Cryptocurrency prices are rising for two reasons," he explains. "First, due to regulatory gaps and possible market manipulation; second, due to the possibility of selling inflated, overvalued cryptocurrency to an even bigger fool [...] This also applies to speculation about a 90% probability of approving spot ETFs."
In the interest of fairness, it should be noted that the current surge is not solely the fault of spot BTC-ETFs. The excitement around them gradually started building up since late June when the first applications were submitted to the SEC. Bitcoin, on the other hand, began its upward movement from early January, growing more than 2.6 times during this period.
Several experts point out that the current situation remarkably mirrors previous BTC/USD cycles. Currently, the drawdown from the all-time high (ATH) is 37%, in the previous cycle for the same elapsed time, it was 39%, and in the 2013-17 cycle, it was 42%. If we measure from local bottoms instead of peaks, a similar pattern emerges. (The first rallies are an exception, as young Bitcoin grew significantly faster in the nascent market.)
According to Blockstream CEO Adam Back, the price of bitcoin will surpass the $100,000 level even before the upcoming halving in April 2024. The industry veteran noted that his forecast doesn't take into account a potential bullish impulse in the event of SEC approval of spot bitcoin ETFs. Regarding the long-term movement of digital gold quotes, the entrepreneur agreed with the opinion of BitMEX co-founder Arthur Hayes, forecasting a range of $750,000 to $1 million by 2026.
For reference: Adam Back is a British businessman, a cryptography expert, and a cypherpunk. It is known that Back corresponded with Satoshi Nakamoto, and a reference to his publication is included in the description of the bitcoin system. Previously, Adam Back did not make public price forecasts for BTC, so many members of the crypto community paid close attention to his words.
The CEO of Ledger, Pascal Gauthier, the head of Lightspark, David Marcus, and the top manager of the CoinDCX exchange, Vijay Ayyar, also anticipate the bitcoin exchange rate to reach $100,000 in 2024. They shared this information in an interview with CNBC. "It seems that 2023 was a year of preparation for the upcoming growth. Sentiments regarding 2024 and 2025 are very encouraging," said Pascal Gauthier. "Some market participants expect a bullish trend sometime after the halving, but considering the news about ETFs, we could very well start the rise before that," believes Vijay Ayyar. However, unlike Adam Back, in his opinion, "a complete rejection of ETFs could disrupt this process."
Renowned bitcoin maximalist, television host, and former trader Max Keiser shared unconfirmed rumors that the sovereign wealth fund of Qatar is preparing to enter the crypto market with massive investments and plans to allocate up to $500 billion in the leading cryptocurrency. "This will be a seismic shift in the cryptocurrency landscape, allowing bitcoin to potentially surpass the $150,000 mark in the near future and go even further," stated Keiser.
Unlike the television host, we will share not rumors but absolutely accurate facts. The first fact is that as of the review writing on the evening of December 8, BTC/USD is trading around $44,545. The second fact is that the total market capitalization of the crypto market is $1.64 trillion ($1.45 trillion a week ago). And finally, the third fact: the Crypto Fear and Greed Index has risen from 71 to 72 points and continues to be in the Greed zone.
A Week of Market Shifts, Yen Skyrockets on BoJ Speculations
The global financial markets last week were primarily influenced by three pivotal themes: Yen's dramatic rise, Dollar's strength following robust US employment data, and repercussions of Moody's downgrading China's rating outlook.
The most striking was the Yen's significant surge, driven by intensified speculation about an impending exit from negative interest rates by BoJ. The anticipation of this policy change propelled Yen as the strongest currency, simultaneously impacting Japan's bond yields and stock market, with Nikkei facing a significant downturn.
Dollar secured its position as the second strongest currency, buoyed by robust employment and upbeat consumer sentiment data. The solid labor market report led traders to reconsider their expectations for an early rate cut by Fed.
Contrasting with strengths of Yen and Dollar, both Australian and New Zealand Dollars emerged as the weakest performers. Their downturn was primarily driven by deteriorating risk sentiment in Asia, especially following Moody's decision to downgrade China's rating outlook. Meanwhile, RBA's decision to hold rates steady failed to provide any significant impetus to Aussie.
Elsewhere in the currency markets, Canadian Dollar ended as the third strongest, benefiting from Dollar's rally and also influenced by BoC's decision to keep interest rates unchanged without adopting a dovish tone. European majors displayed mixed performance. Sterling was on the weaker side, while Euro showed relative strength compared to its European counterpart.
Fed rate cut expectation shifts; Capping stock rallies, lifting Dollar
In a week marked by significant economic data that reflected a sense of resilience in the slowly cooling US economy, major US stock indexes marked their sixth consecutive week of gains. This continued upward trend comes amidst steadfast expectations that Fed will hold interest rates unchanged in its upcoming December meeting, with the current tightening cycle completed already. However, stocks' rallies are being tempered as markets reassess their expectations for rate cuts in the next year, a factor also contributing to strengthening of Dollar and recovery in 10-year yield.
Non-farm payroll report released on Friday provided a glimpse into the robustness of the US job market. The report exceeded expectations with a headline job growth of 199k, while unemployment rate fell unexpectedly to 3.7%. Furthermore, wages continued to grow at a strong pace of 0.4% mom. These figures suggest that the US job market remains tight, with ongoing robust wage growth indicating that inflationary pressures might persist longer than some market analysts had anticipated.
Subsequent to the payroll data, University of Michigan survey revealed a significant downward adjustment in inflation expectations. One-year inflation rate outlook dropped to 3.1%, a substantial decrease from 4.5% in November, marking the lowest level since March 2021. This decline in short-term inflation expectations was mirrored in the longer-term outlook, which also fell from 3.2% to 2.8%. In parallel, consumer sentiment index experienced a marked improvement, climbing more than 8 points to 69.4, tying for the best level since July.
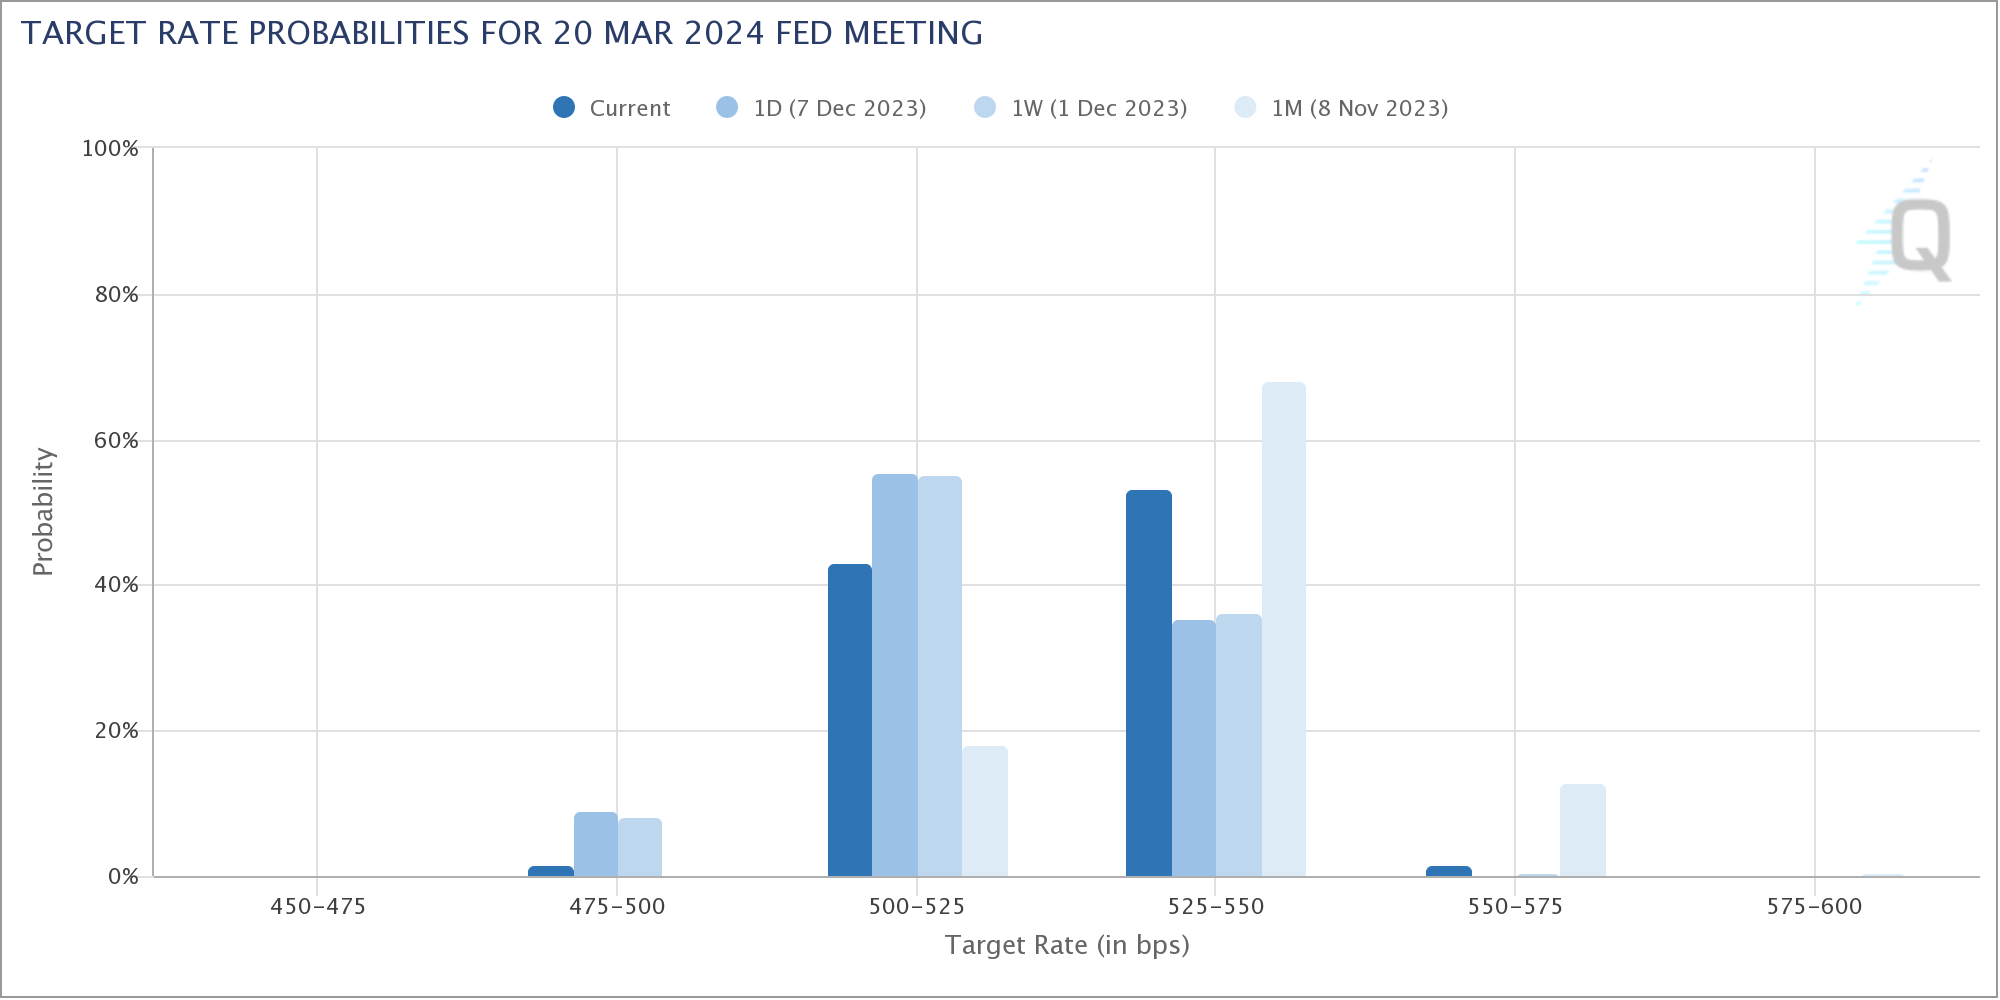
Despite these positive indicators, the market still heavily anticipates Fed to maintain steady interest rates, with a 97.1% chance at its final policy meeting of the year. However, the likelihood of a rate cut in March has reduced, with expectations falling to 44% from 55% just last week. This shift in expectations is also evident in the swaps market, where traders have scaled back their bets on the extent of Fed rate cuts next year, pricing in about 110 basis points of easing, a reduction from previous forecasts of over 120 basis points.
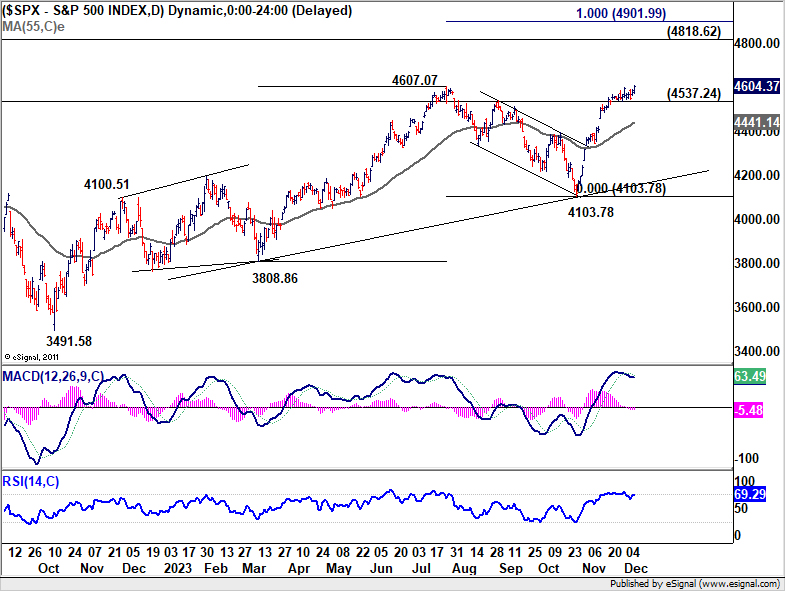
In stock market performance, DOW registered a slight increase of 0.01%, while S&P 500 and NASDAQ Composite recorded gains of 0.2% and 0.7%, respectively.
Near term outlook in S&P 500 stays bullish as long as 4537.24 support holds. However, loss of upside momentum is clear in D MACD. Whether there is enough momentum to challenge 4818.62 high is in question. The future course of the index will largely depend on how economic and market conditions evolve in early 2024.
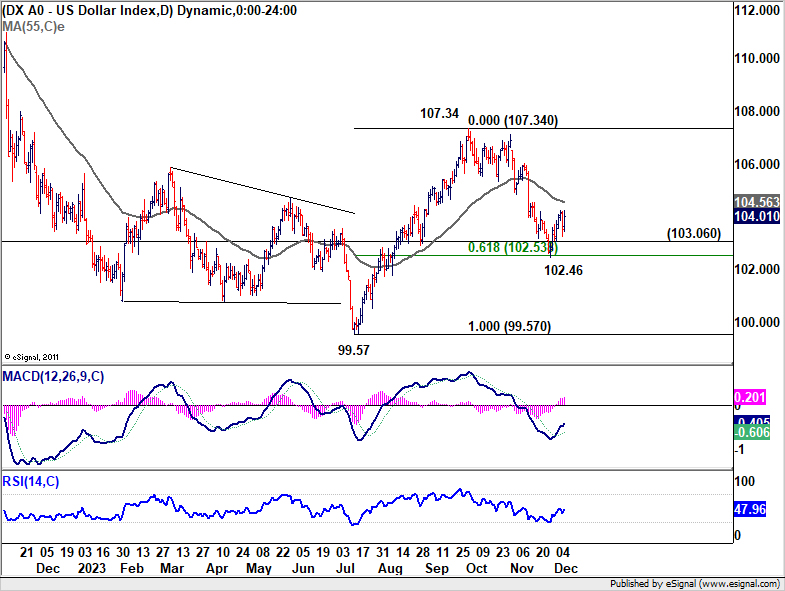
Dollar Index saw notable volatility last week, primarily influenced by the steep selloff in USD/JPY and a counteracting pullback in EUR/USD. For now, further rally is expected as long as 103.06 minor support holds, to 55 D EMA (now at 104.56). But DXY could start to struggle above there due to conflicting dynamics exerted by Yen and Euro.
Also, if price actions from 102.46 represent the second leg of the corrective pattern from 107.34, then the road is expected to be extra bumpy, as a corrective move inside a corrective pattern.
BoJ speculation stirs markets: Yen up, Nikkei down
BoJ's potentially looming shift away from its long-standing negative interest rate policy was one of the dominant themes in the global financial markets last week, causing significant ripples. This speculation, intensified after statements from BoJ officials, led to substantial strengthening of Yen and an upswing in 10-year JGB yield. Conversely, these developments triggered a notable decline in Japan's benchmark stock index, Nikkei.
BoJ Governor Kazuo Ueda's comments to the parliament about the increasing complexity in policy management in the coming months added fuel to the market speculation. He also brought attention to various potential targets for interest rates once the BoJ decides to move away from negative short-term borrowing costs.
Preceding Ueda's comments, Deputy Governor Ryozo Himino's remarks were perceived by the market as a precursor to policy normalization. Himino suggested that the potential first rate hike since 2007 may not be as damaging to the economy as some market analysts had feared.
A Bloomberg poll of economists underscored the shift sentiment, with a two-third majority anticipating BoJ to discard its negative rate policy by April 2024. About half of these economists expect this change in April, while a smaller group of 15% foresees it occurring as early as January.
Given the planned release of new economic forecasts by BoJ in both January and April, March meeting is viewed as an unlikely timing for such a crucial policy adjustment. Meanwhile, BoJ is expected to wait for the outcome of Spring wage negotiations, further solidifying April as the more probable time for the policy shift.
The looming question for BoJ observers is whether the December 18-19 meeting will be used by Ueda and his board to signal imminent policy normalization or if such indications will be postponed until January.
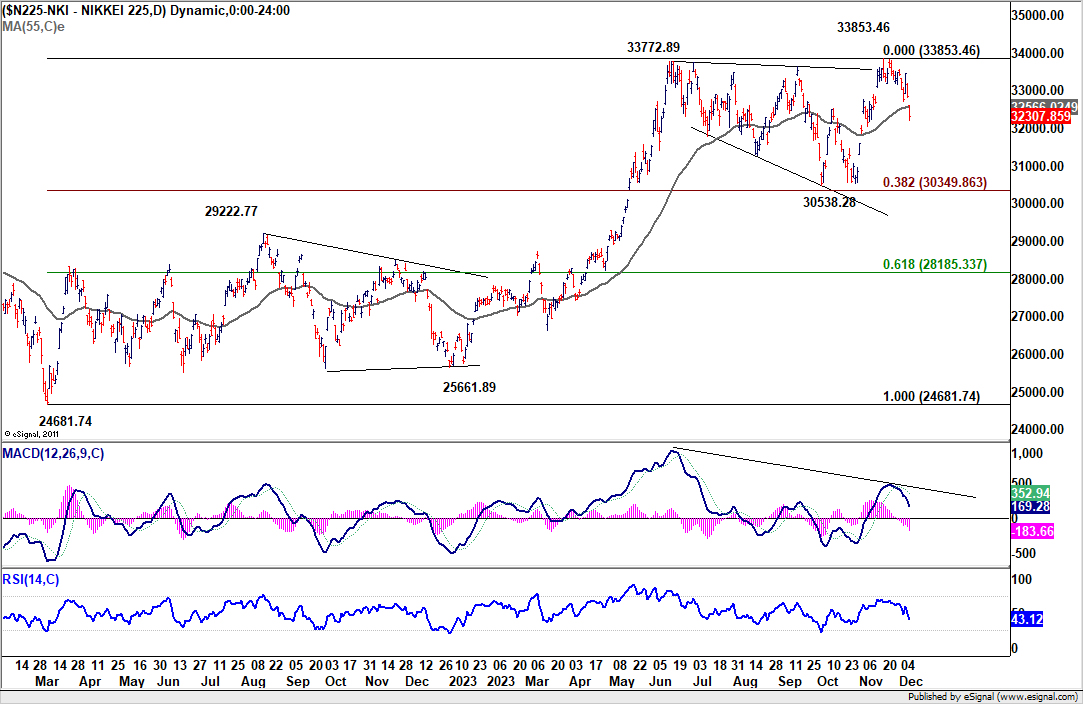
The steep decline in Nikkei last week, followed by strong break of 55 D EMA (now at 32566.02), suggests that rise from 30538.28 has completed at 33853.46 already. A more important question is whether the whole up trend 24681.74 has completed its five-wave run too, after breaching 33772.89.
In either case, risk will now stay on the downside if Nikkei cannot regain 55 D EMA firmly within a short period of time. Deeper fall could then be seen to 30538.28 support, which is close to 38.2% retracement of 24681.74 to 33853.46 at 30349.86.
Moody's downgrade of China's outlook triggers turbulence in HK stocks
Another significant development in the Asian financial markets occurred when Moody's downgraded China's A1 debt rating outlook from "stable" to "negative." This downgrade reflects concerns about the financial burden of bailing out local governments and state firms, as well as managing the ongoing property crisis.
Following this, Moody's took further action by adjusting outlook for eight Chinese banks, including the nation's four largest lenders – Industrial and Commercial Bank of China, Agricultural Bank of China, Bank of China, and China Construction Bank Corporation – from "stable" to "negative." Additionally, Moody's lowered Hong Kong's outlook from stable to negative, acknowledging the close political, institutional, economic, and financial ties between Hong Kong and mainland China.
In the wake of these developments, Hong Kong's HSI extended its downtrend from 22700.85, reaching a new low for the year. Near term outlook will stay bearish as long as 17068.26 resistance holds. Next target is 100% projection of 22700.85 to 18044.85 from 20361.02 at 15705.02.
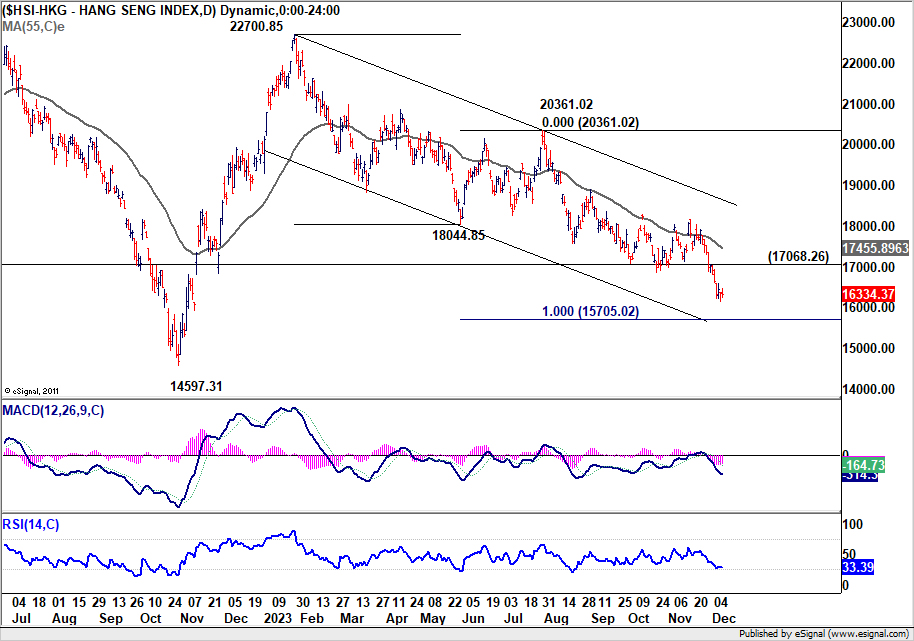
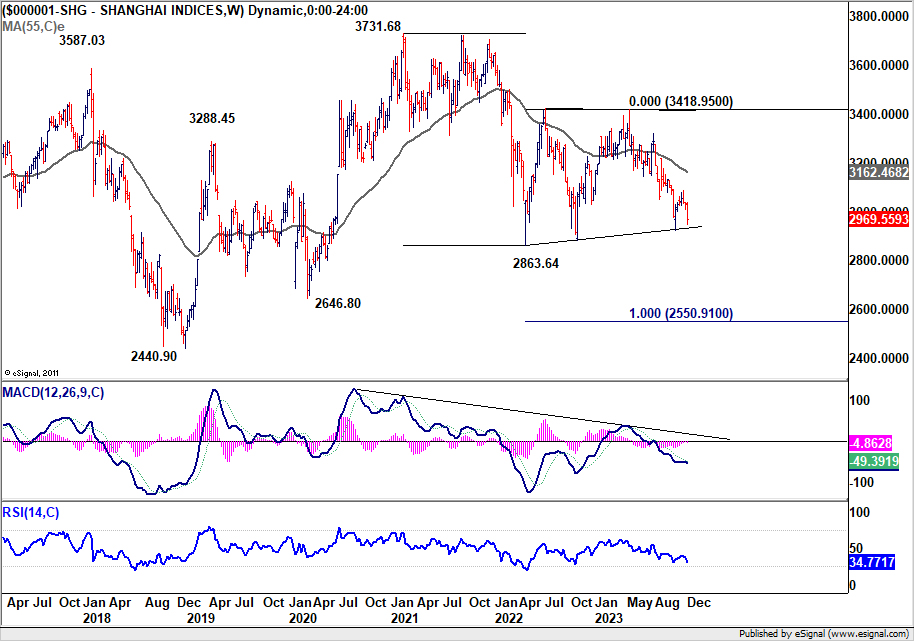
Medium-term fate of HSI is closely linked to whether Shanghai SSE can defend its key long-term support at 2863.64 amid the current decline. It is still premature to make a definitive assessment, but decisive break of 2863.64 would resume SSE's down trend from 3731.68 to 100% projection of 3731.68 to 2863.64 from 3418.95 at 2550.91.
AUD/JPY and NZD/JPY as biggest losers of the week
AUD/JPY and NZD/JPY were the biggest movers last week, loosing -2.8% and -2.7% respectively. That's a combined results of Yen's surge on BoJ speculations, pressures on Aussie and Kiwi due to China's problems.
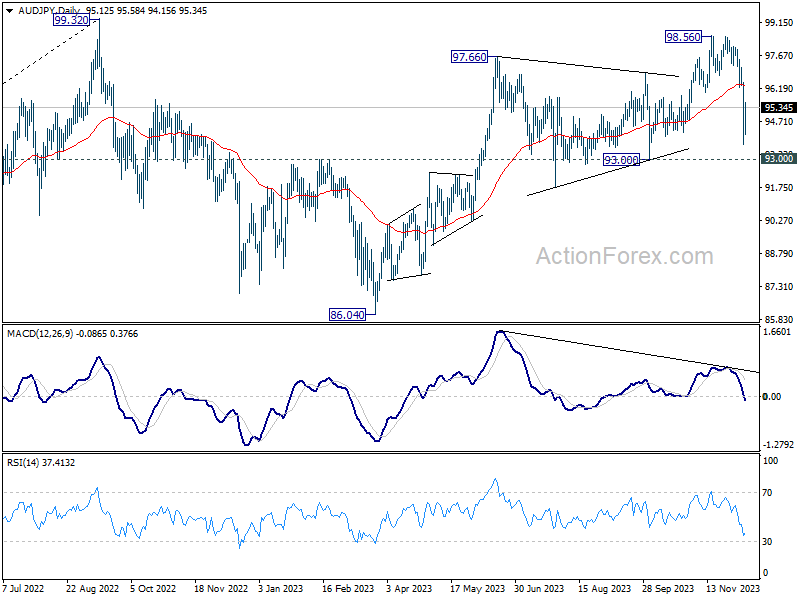
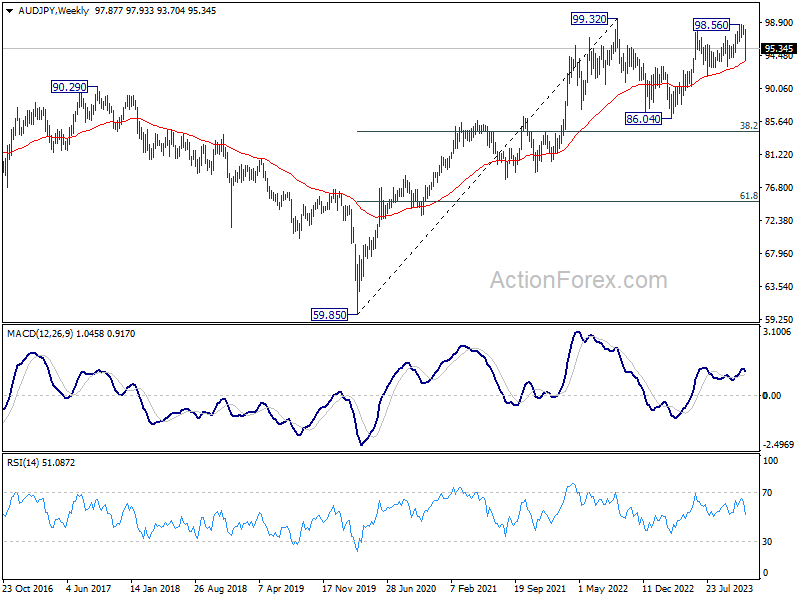
AUD/JPY's steep decline last week suggests that whole rise from 86.04 has completed at 98.56 already. Deeper fall is in favor as long as 55 D EMA (now at 96.29) holds. Break of 93.00 support will confirm this bearish case and target 86.04 support again.
Also, the fall from 98.56 is tentatively seen as the third leg of the consolidation pattern from 99.32 (2022 high). If this is correction, fall from 98.56 has the potential to extend through 86.04 to 38.2% retracement of 59.85 (2020 low) to 99.32 at 84.24 before completion.
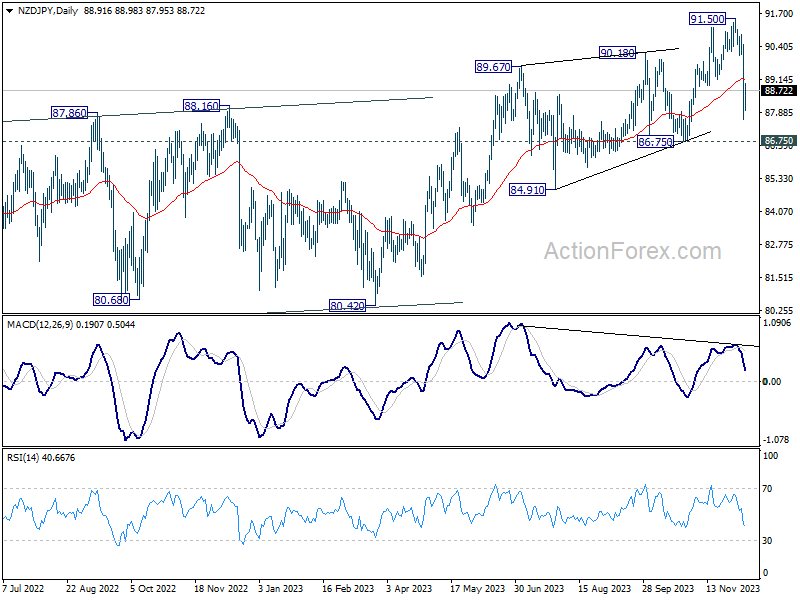
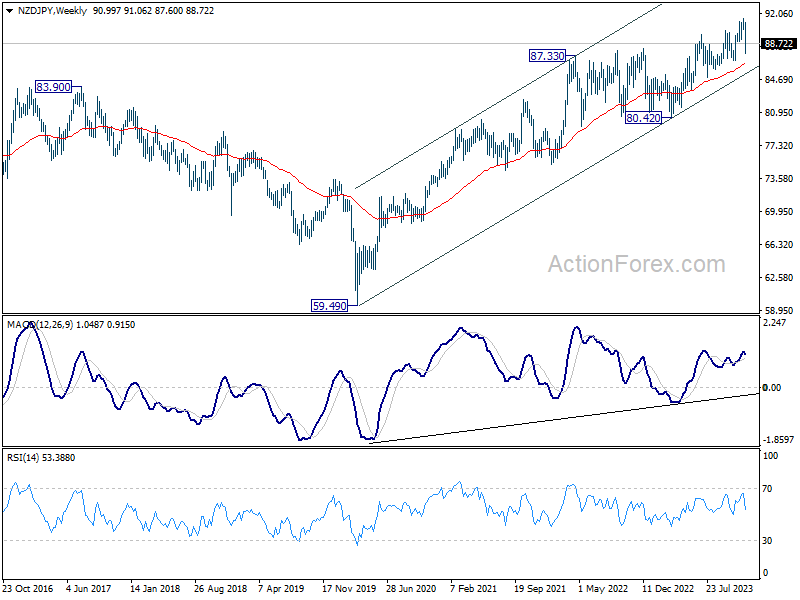
NZD/JPY's outlook is clearly more bullish than AUD/JPY. Yet the sharp fall form 91.50 and bearish divergence condition in D MACD raising the chance that a medium term top was already formed. Short term focus is now on 86.75 support. Strong bounce from there will keep the medium term up trend intact, and bring another rise through 91.50 at a later stage.
However, decisive break of 86.75 will argue that it's already correcting whole up trend from 59.49 (2020 low), and bring deeper decline to 80.42 support.
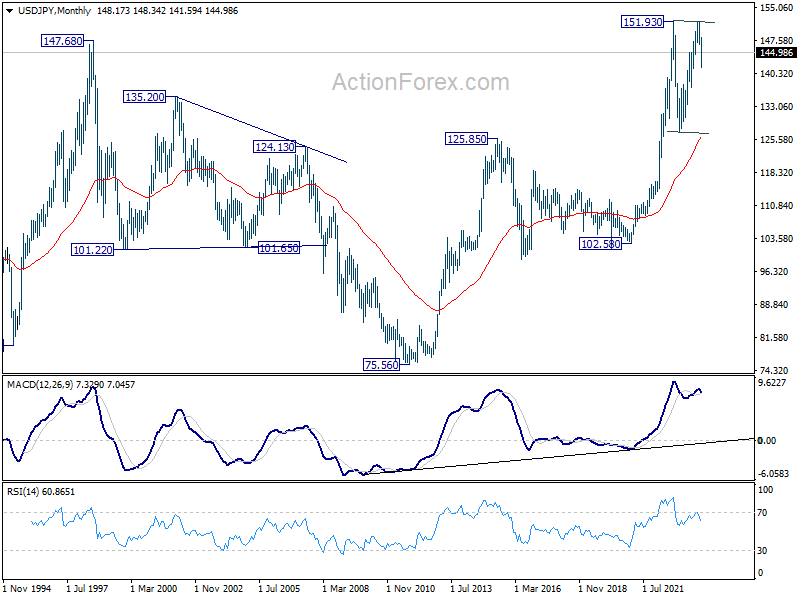
USD/JPY Weekly Outlook
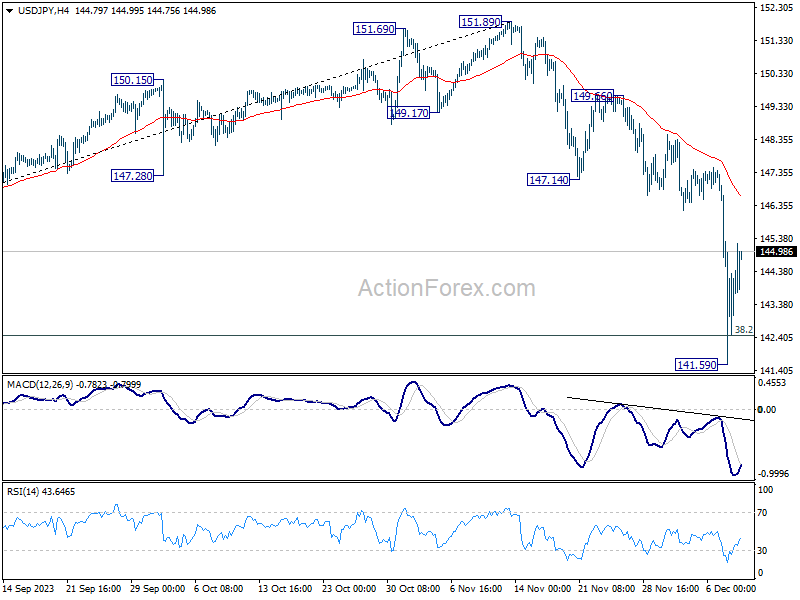
USD/JPY's fall from 151.89 accelerated to as low as 141.59 last week, but recovered after drawing support from 142.45 fibonacci level. Initial bias remains neutral this week for consolidations first. But recovery should be limited below 147.14 support turned resistance to bring another fall. On the downside, break of 141.59 and sustained trading below 142.45 fibonacci level will pave the way to next fibonacci level at 136.63.
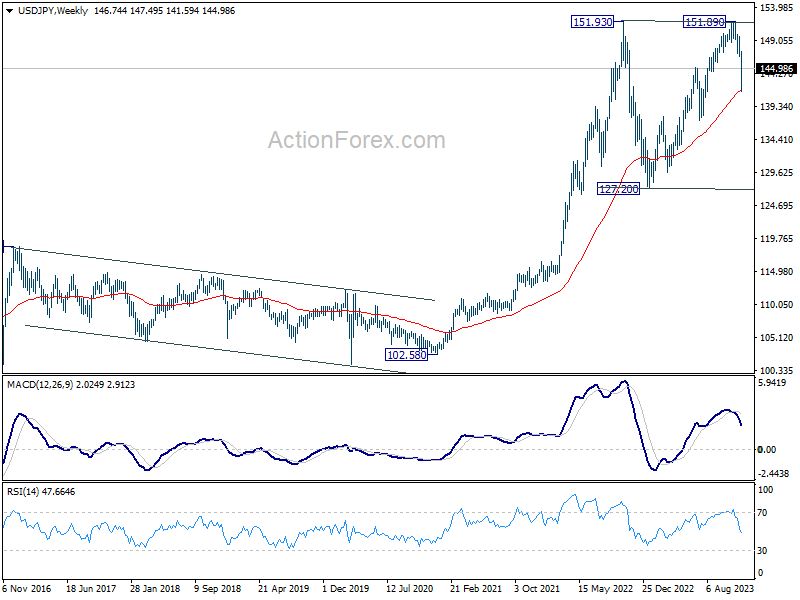
In the bigger picture, current fall from 151.89 is seen as the third leg of the corrective pattern from 151.93 (2022 high). Deeper decline would be seen through 38.2% retracement of 127.20 to 151.89 at 142.45 to 61.8% retracement at 136.63. This will now remain the favored as long as 147.14 support turned resistance holds.
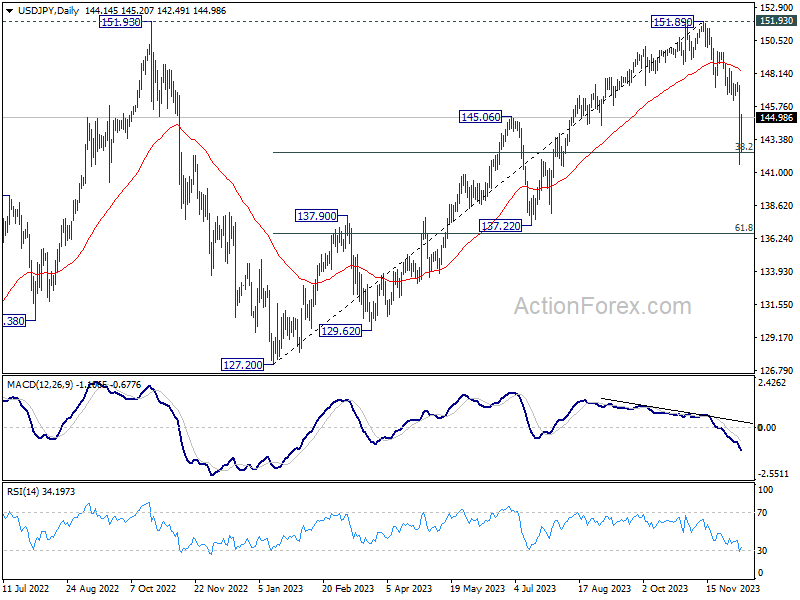
In the long term picture, as long as 125.85 resistance turned support holds (2015 high), up trend from 75.56 (2011 low) is still in favor to continue through 151.93 (2022 high) at a later stage.
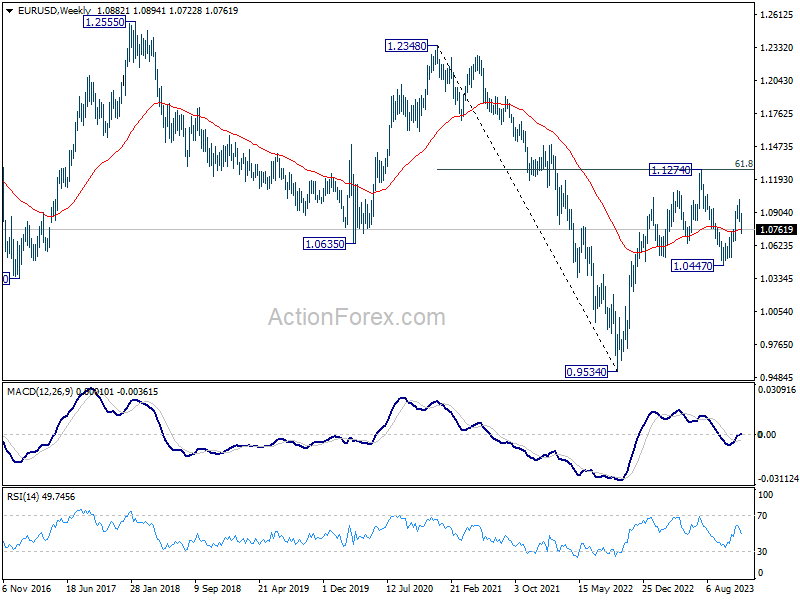
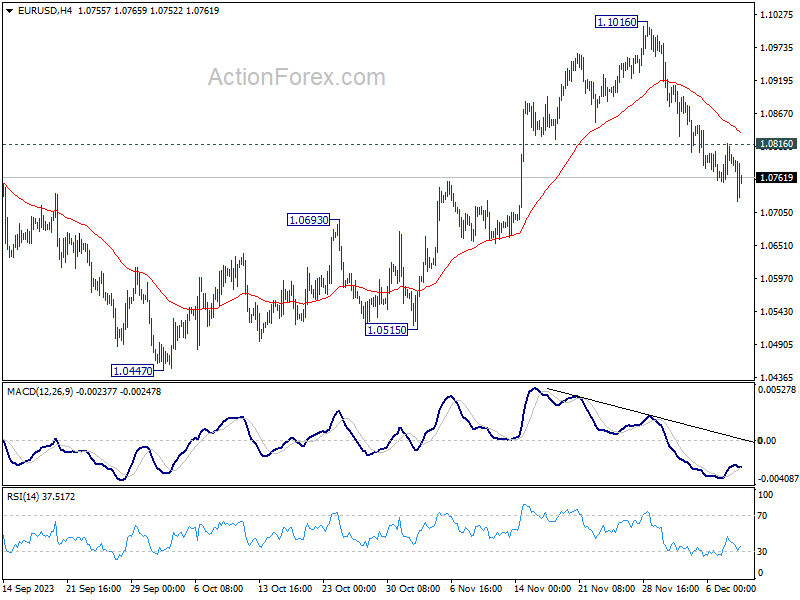
EUR/USD Weekly Outlook
EUR/USD's fall from 1.1016 extended to as low as 1.0722 last week. Initial bias stays on the downside this week first. Sustained trading below 55 D EMA (now at 1.0770) will pave the way to retest 1.0447 support. On the upside, above 1.0816 minor resistance will turn intraday bias neutral first.
In the bigger picture, price actions from 1.1274 are viewed as a corrective pattern to rise from 0.9534 (2022 low). Rise from 1.0447 is seen as the second leg. While further rally could cannot be ruled out, upside should be limited by 1.1274 to bring the third leg of the pattern. Meanwhile, sustained break of 55 D EMA will argue that the third leg has already started for 1.0447 and below.
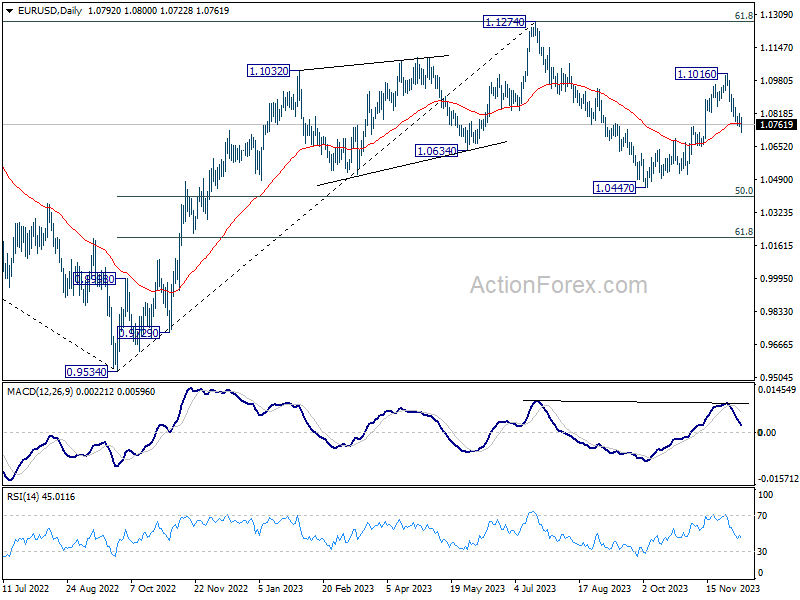
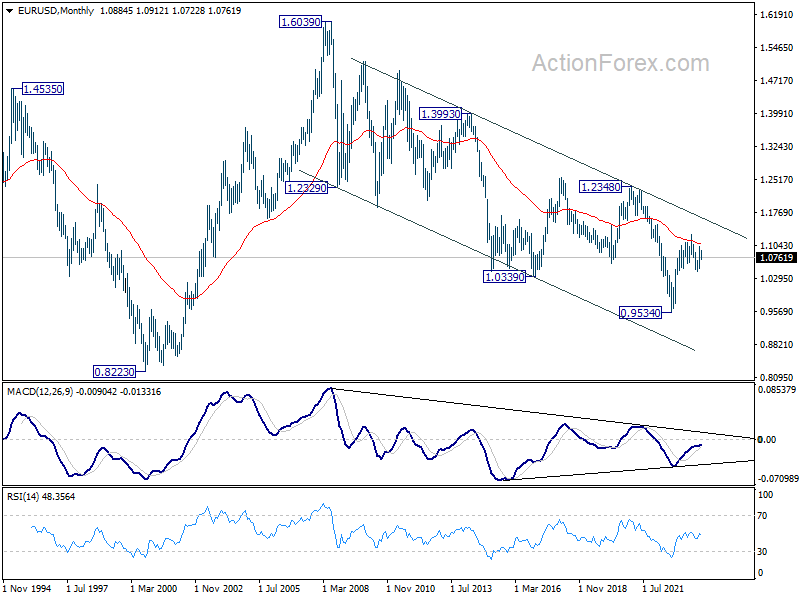
In the long term picture, a long term bottom is in place at 0.9534 on bullish convergence condition in M MACD. It's still early to call for bullish trend reversal with the pair staying inside falling channel. Nevertheless, sustained trading above 55 M EMA (now at 1.1081) and break of 1.1274 resistance will raise the chance of reversal and target 1.2348 resistance for confirmation.