Sample Category Title
GBP/USD – Pound Edges Higher ahead of UK Job Data
- UK to release employment report on Tuesday
- US nonfarm employment payrolls beats forecast and rise to 199,000
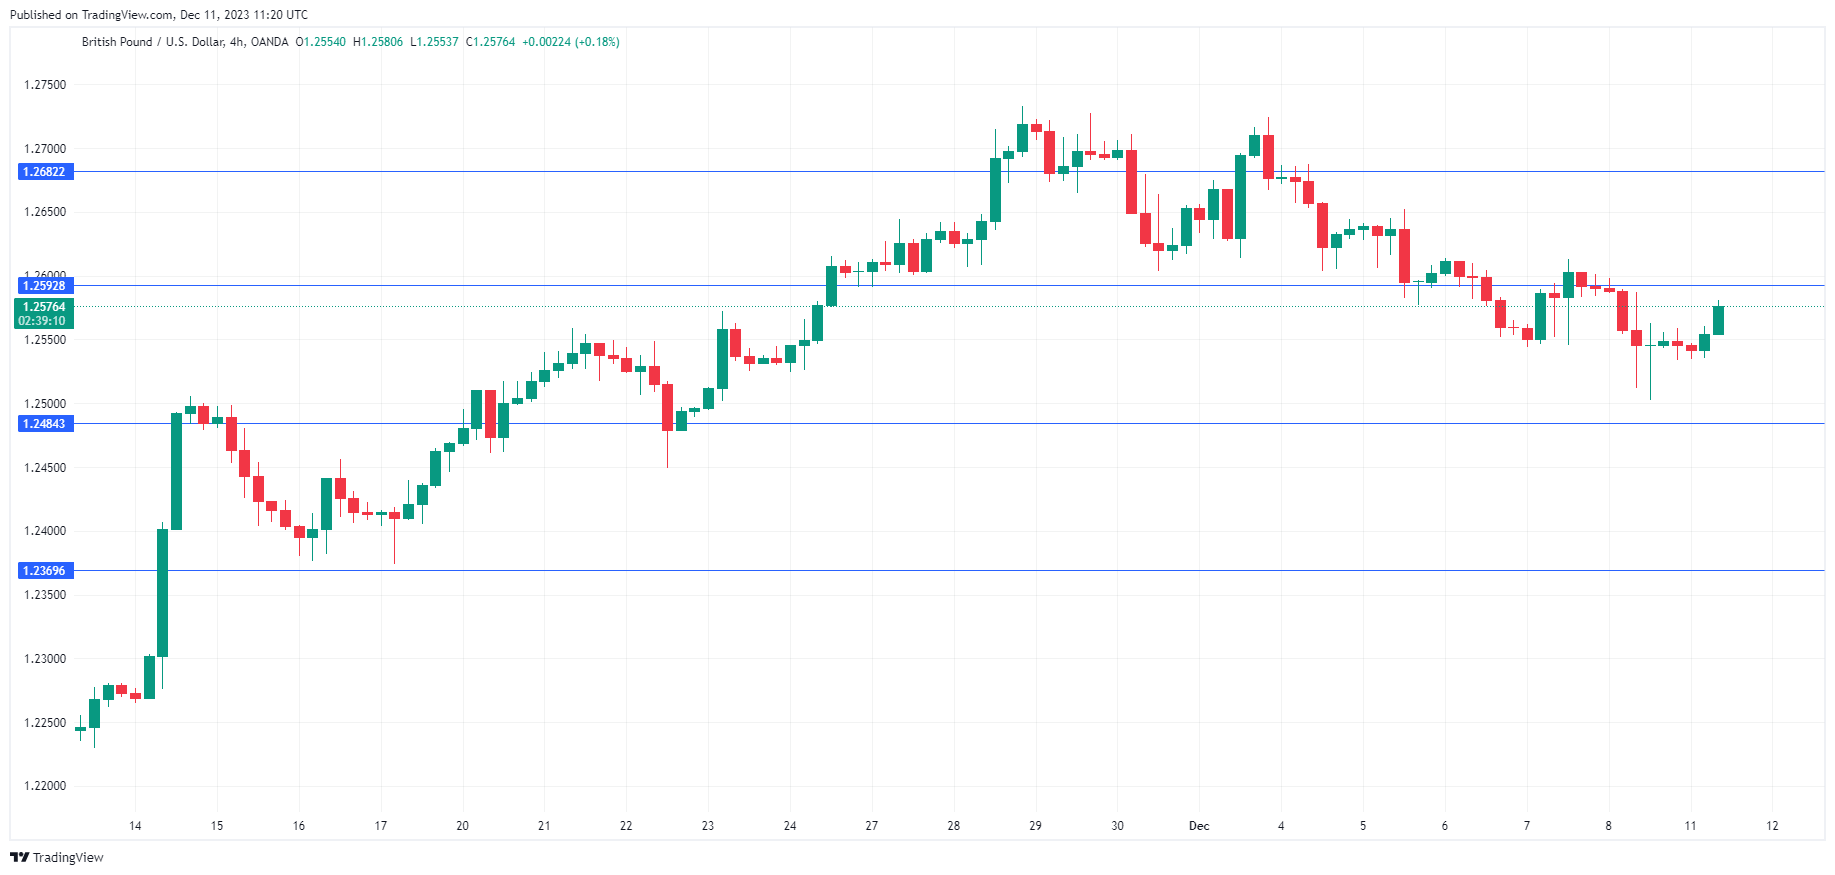
The British pound is showing little movement at the start of the week. In Monday’s European session, GBP/USD is trading at 1.2576, up 0.22%.
It’s a busy week for UK releases which could translate into volatility from the British pound. The UK releases employment data on Tuesday, GDP on Wednesday, followed by the Bank of England rate decision on Thursday.
BoE eyes employment report
The UK employment report will be closely watched by the BoE, which is expected to hold the cash rate at 5.25% for a third straight time. The UK labour market has remained strong despite the BoE’s aggressive tightening and high wage growth continues to drive inflation. The unemployment rate is expected to tick higher from 4.2% to 4.3% while wages including bonuses are expected to ease to 7.7%, down from 7.9%.
BoE Governor Bailey had a hawkish message for the markets last week, saying that interest rates could remain at current levels for “an extended period” in order to bring inflation back down to the 2% target. Inflation has been falling sharply, but the current clip of 4.9% remains much higher than the target and the BoE doesn’t want to encourage talk of a rate hike, which could ease financial conditions and push inflation higher. The markets, however, have priced in rate cuts in mid-2024.
US nonfarm payrolls dampens rate-cut expectations
Friday’s US nonfarm payrolls came in at 199 thousand in November, above the market consensus of 180,000 and higher than the October gain of 150,000. Unemployment dropped from 3.9% to 3.7% and average hourly earnings rose to 0.4% m/m, up from 0.2% in October and above the market consensus of 0.3%. The strong data points to a resilient labour market despite signs that the economy is cooling down, and has reduced fears of recession.
The markets are still expecting four or five rate cuts in 2024, pointing to a deep disconnect with the Fed, which is insisting that hikes remain on the table. The strong nonfarm payroll report is a reminder to the markets that the US labour market remains strong, even if there are clear signs that the economy is cooling down. Tuesday’s inflation report will be closely watched, as a stronger-than-expected reading would likely force the markets to temper expectations about rate hikes in 2024.
GBP/USD Technical
- GBP/USD is putting pressure on resistance at 1.2592, followed by 1.2682
- 1.2484 and 1.2369 are the next support levels
XAU/USD: Gold Stands at the Back Foot Ahead of Key Events
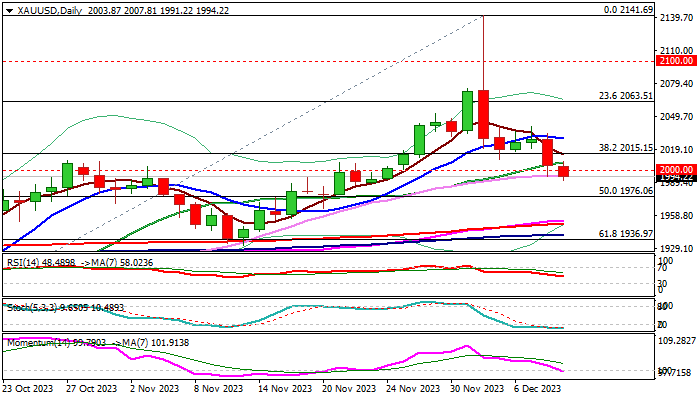
Gold remains in red for the second consecutive day and fell below $2000 early Monday, pressured by firmer dollar on solid US labor data.
Friday’s 1.2% drop generated fresh bearish signal on close below $2015 pivot (Fibo 38.2% of $1810/$2141), with extension lower adding to the strength of bearish continuation signal.
Near-term technical picture is weakening, as 14-d momentum is breaking into negative territory and 10/20 DMA’s turned to bearish configuration, although oversold conditions may produce headwinds and possibly slow bears.
Pullback from new all-time high ($2141, Dec 4 spike) could be seen for now as a healthy correction ahead of fresh push higher, as the correction is still within the limits, but could also signal reversal, after bears broke pivots at $2015/$2000 and look for confirmation on loss of $1976 (50% retracement of $1810/$2141).
Traders eye US inflation report and Fed policy decision, which could provide stronger direction signal.
The yellow metal may accelerate high if US inflation comes below expectations in November, with additional positive signal to be generated from Fed, as the central bank is widely expected to keep interest rates unchanged and stronger signals about rate cuts would deflate dollar.
Res: 2000; 2015; 2041; 2063.
Sup: 1990; 1976; 1955; 1951.
Q3 Next Year Marked for SNB’s First Rate Cut, Economists Predict
SNB is widely anticipated to maintain its key policy rate at 1.75%. However, the focus of market analysts and economists has shifted to speculating the timing of potential policy loosening. Recent polls conducted by Reuters and Bloomberg revealed a consensus among economists that SNB would only start cutting interest rates in Q3 next year.
The Reuters poll, conducted between December 5-11, gathered responses from 31 economists, all of whom unanimously agreed that SNB would hold the rate at 1.75% in the upcoming meeting. A substantial majority, approximately 70% (or 21 out of 31), predicted that SNB would maintain this rate until at least the third quarter of next year. Furthermore, a notable minority of 45% (or 13 out of 29) economists foresee the first rate cut by being pushed back to December 2024 or even later.
In comparison, a separate Reuters poll last week focusing on ECB revealed that around 57% of economists expect the ECB to implement at least one rate cut by the end of June. This comparison highlights expectations that SNB could starting cutting rates after ECB.
Additionally, a Bloomberg poll conducted from December 1-7 forecasts SNB initiate an interest rate cut in September next year. This would be followed by two more reductions of 25 bps each, anticipated in December 2024 and March 2025.
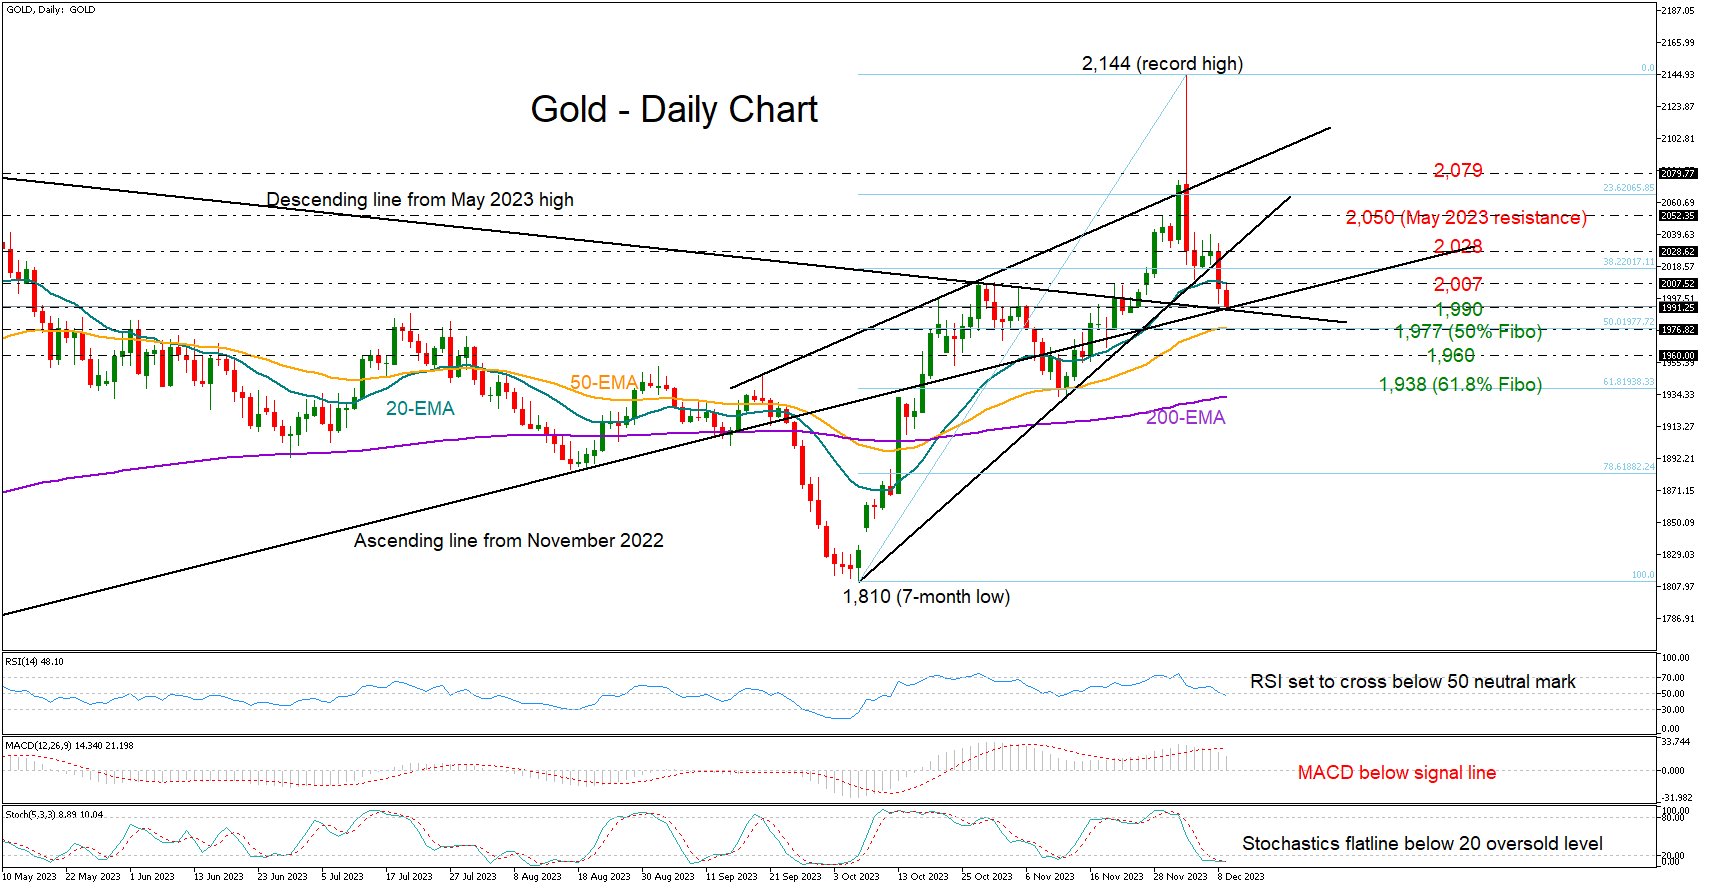
Gold Feels the Blues After Record Rally
- Gold starts a new bearish wave after record high
- A consolidation phase is likely; support at 1,970-1,990
Despite its rocket rally to a new record high of 2,144 last Monday, gold could not successfully remain above the pandemic-era 2,070 bar, which caused a negative trend reversal in 2022 and 2023.
The precious metal has been trending southwards since then, feeding concerns that a new bearish trend could be underway as the price has slipped below a short-term support trendline and marginally beneath its 20-day exponential moving average (EMA) and the 2,000 number.
The technical signals are not very encouraging either as the RSI is looking to cross below its 50 neutral mark and the MACD keeps decelerating below its red signal line. Yet, the stochastic oscillator is already in the oversold area, while the ascending line from the November 2022 low seems to have resumed its protective role around 1,990. This is also where the 200-period EMA on the four-hour chart is blocking the way down, justifying some optimism for the coming sessions, too.
If the 1,990 floor cracks, the 50-day EMA, which overlaps with the 50% Fibonacci retracement of the latest upleg at 1,977, could be the next pivot point. Slightly lower, the 1,960 region has been a tough obstacle to upside movements during the past couple of years and will be closely watched before the 61.8% Fibonacci mark of 1,938 and the 200-day EMA attract attention.
In the opposite case, where the price jumps back above its 20-day EMA at 2,007, the rise could last till the 2,028 resistance region. A break higher could strengthen the bullish momentum towards the important barrier of 2,050. If that proves easy to overcome too, the spotlight will again turn to the critical 2023 top of 2,079.
Summing up, the yellow metal has a bearish tendency in the very short-term picture, but sellers may not act forcefully until a drop below 1,977-1,990 occurs.
Sharp Change in BTC/USD Price: Causes and Consequences
On Monday morning, the price of bitcoin fell sharply. As the chart shows, the BTC/USD rate fell below 42,000 on Monday during the Asian session. According to Coinglass, the decline resulted in about $400 million worth of positions being liquidated by about 100,000 traders on cryptocurrency exchanges. So far, the price has found support around the 41,200 level, where the lower border of the ascending channel lies (shown in blue).
What are the reasons for such a sharp decline? From a fundamental point of view, there are no triggers with the media associated with, for example, statements by officials. What then?
First of all, the idea comes with low liquidity in the financial markets at the beginning of Monday in the Asian session. A recent example is the gold market, when the price of the metal jumped at the opening of trading to $2,130, but then quickly fell to $2,060. By the way, we wrote on Tuesday that the bears may try to push the price of gold below the psychological level of $2,000. The scenario is still coming true.
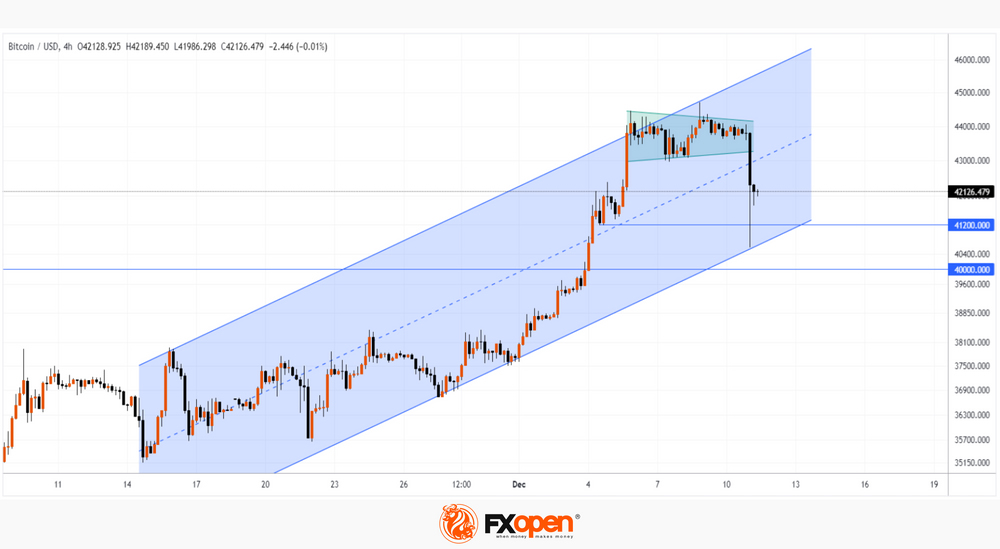
What will happen to bitcoin? The graph shows that:
→ the price was within consolidation for some time (shown in green);
→ On December 8, the year’s maximum was updated, which in fact turned out to be a trap, a false bullish breakout of the consolidation zone (a bearish sign);
→ this morning, there was a bearish breakdown of the consolidation zone.
After 8 weeks of gains, we can assume that the market is overbought and today's decline is an overdue correction after a rally of more than 70% from the September lows.
But corrections, as a rule, are characterized by smoother declines with decreasing volumes. And if we analyze the nature of the decline on Monday morning, it looks more like an impulse.
Of course, given the high leverage that is applied in the poorly regulated crypto market, it is reasonable to assume that the correction took this form due to the cascading triggering of buyers’ stop losses. On the other hand, what if insiders are actively selling bitcoin, knowing that the coming week will bring a dose of negativity on the fundamental background?
One way or another, if the price of bitcoin reaches a psychological level, then analyzing the patterns on the chart will provide important information. It is possible that the price will break below the $40k level, and it will provoke an upward rebound — the nature of which will provide valuable material for reasoning about whether the current decline is an overdue correction or a bearish reversal.
This article represents the opinion of the Companies operating under the FXOpen brand only. It is not to be construed as an offer, solicitation, or recommendation with respect to products and services provided by the Companies operating under the FXOpen brand, nor is it to be considered financial advice.
Dollar Index: Dollar Keeps Firm Tone and Attempts Again Through Pivotal Barriers at 104.10 Zone
The dollar index remains constructive at the start of the week, following Friday’s jump on robust US November labor data.
The greenback benefited from higher than expected US NFP and unemployment below consensus in November, which signaled that labor market remains resilient and softening narrative about rate cuts.
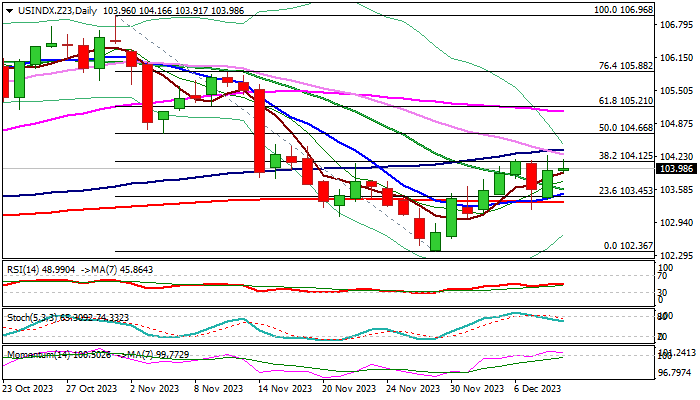
However, recovery faces headwinds from pivotal barrier at 104.10 zone (Fibo 38.2% of 106.96/102.36 / falling daily Kijun-sen / top of recent range) with firm break here needed to signal bullish continuation and expose targets at 104.66/94 (50% retracement / daily cloud base).
Bullishly aligned daily studies support this scenario, however repeated failure to register a clear break higher to signal prolonged consolidation, but with bullish bias above 103.50/57 (converging 10/20 DMA’s and on track to form bull-cross).
Caution on loss of 200DMA (103.33) which would weaken near-term structure and signal an end of near-term recovery phase.
Markets look for fresh signals from US inflation report (due on Tuesday) with inflation expected to ease further in November and Fed rate decision on Wednesday (the central bank is widely expected to keep rates unchanged in its December’s meeting).
Res: 104.12; 104.36; 104.66; 104.94.
Sup: 103.90; 103.50; 103.33; 103.19.
Japanese Yen Correction Continues
- Japanese yen’s slide continues
- Markets walk back expectations of a change at BoJ December meeting
- US nonfarm payrolls rise to 199,000, better than expected
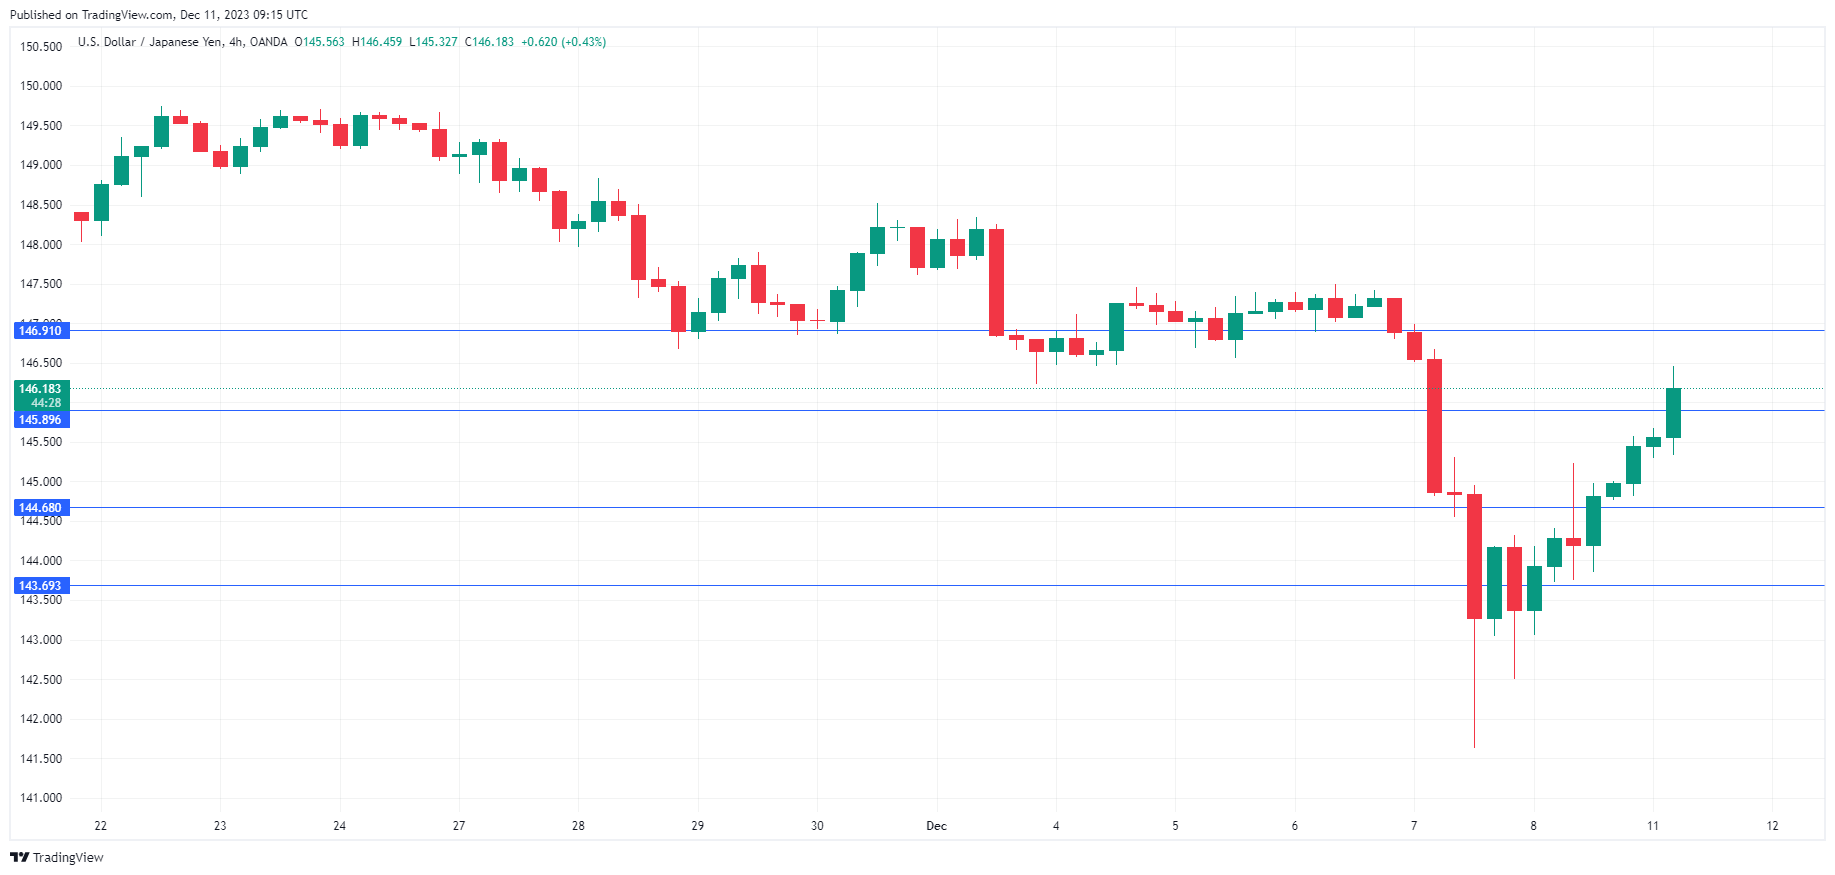
The Japanese yen has started the week where it left off on Friday, posting sharp losses. In the European session, USD/JPY is trading at 146.16, up 0.83%.
BoJ December mania wanes
The yen soared over 2% on Thursday, after comments by senior BoJ officials triggered speculation that Bank of Japan might exit negative interest rates at the December 18-19 meeting. BoJ officials are usually tight-lipped about any plans to change policy and last week’s signals were quickly picked up by investors and sent the yen flying. The BoJ has expressed concern over the depreciating yen and last week’s comments from Governor Governor Kazuo Ueda and BoJ Deputy Governor Ryozo Himino may have been a coordinated move to boost the Japanese currency.
The yen’s jump did not last long, as the US dollar has bounced back and recovered more than half of Thursday’s losses. The rally suffered a reversal on Friday after an anonymous source said that Ueda’s comments that the BoJ was facing “an even more challenging situation” in December and next year were taken out of context and were not meant as a signal of a policy shift.
What is noteworthy is that the strong swings we are seeing from the yen are completely based on speculation – last week’s BoJ comments raised expectations of a move at the December meeting and sent the yen higher. This was followed on Friday by an anonymous source that poured cold water on an imminent policy shift and sent the yen lower.
The weak Japanese economy is providing support for the view that the BoJ will not make any moves at the December meeting. Last week’s soft Q3 GDP reading, in which GDP contracted by 2.9% y/y is further reason for the central bank not to tighten until the economy shows signs of improvement.
Nonfarm payrolls beat expectations
Friday’s US nonfarm payrolls came in at 199 thousand in November, above the market consensus of 180,000 and higher than the October gain of 150,000. Unemployment dropped from 3.9% to 3.7% and average hourly earnings rose to 0.4% m/m, up from 0.2% in October and above the market consensus of 0.3%. The strong data points to a resilient labour market despite signs that the economy is cooling down, and has reduced fears of recession.
USD/JPY Technical
- USD/JPY is testing resistance at 145.89. This is followed by resistance at 146.91
- There is support at 144.68 and 143.69
Fed Decision and US Inflation Data Coming Up
- Fed set to hold interest rates steady on Wednesday
- USD reaction will depend on rate projections for next year
- Latest US inflation report to be released on Tuesday ahead of Fed
How many rate cuts will the Fed signal?
It’s been a great year for the American economy. Real growth is on track to hit 3% with some help from resilient consumer spending and an enormous government deficit. Meanwhile, inflation has been falling steadily, fueling speculation that the economy can achieve the elusive ‘soft landing’ that the Fed has been hoping for.
Against this backdrop, the Federal Reserve will announce its latest decision at 19:00 GMT on Wednesday. Markets are pricing in almost zero chances of a rate increase, so the focus will fall mostly on the updated interest rate projections and Chairman Powell’s commentary in his press conference.
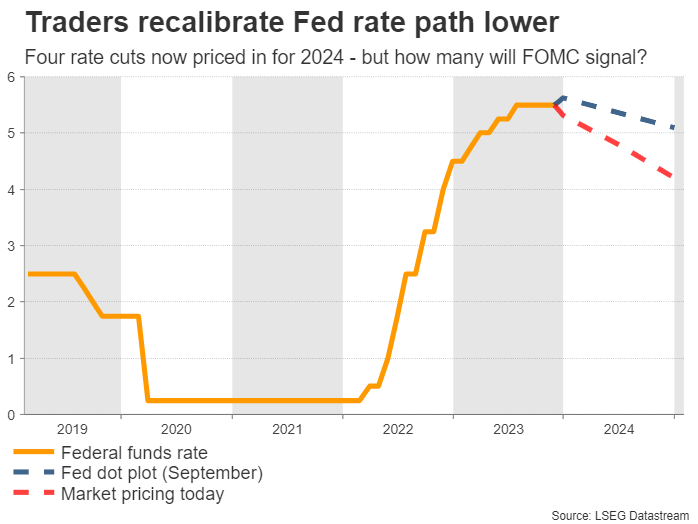
Specifically, the action will depend on whether Fed officials validate market pricing for aggressive rate cuts next year. Market pricing currently points to four rate cuts for the entirety of 2024, which would bring the Federal funds rate down to 4.2% next year.
In contrast, the latest Fed projections back in September showed interest rates closing next year at 5.1%. That’s a huge gap between FOMC forecasts and market pricing, which will probably narrow this time with the Fed coming closer to market expectations.
The question is, exactly how much will the Fed lower its rate projections? Judging by recent comments from various FOMC officials, many of whom have advocated for keeping rates steady for some time, it seems unlikely they will signal anything close to 4.2%. A more reasonable estimate might be around 4.6% instead.
Such a number might be perceived as ‘hawkish’ by investors, as the Fed would be implicitly pushing back against market pricing for such heavy rate cuts. In turn, that could be beneficial for the dollar.
Inflation and retail sales also in focus
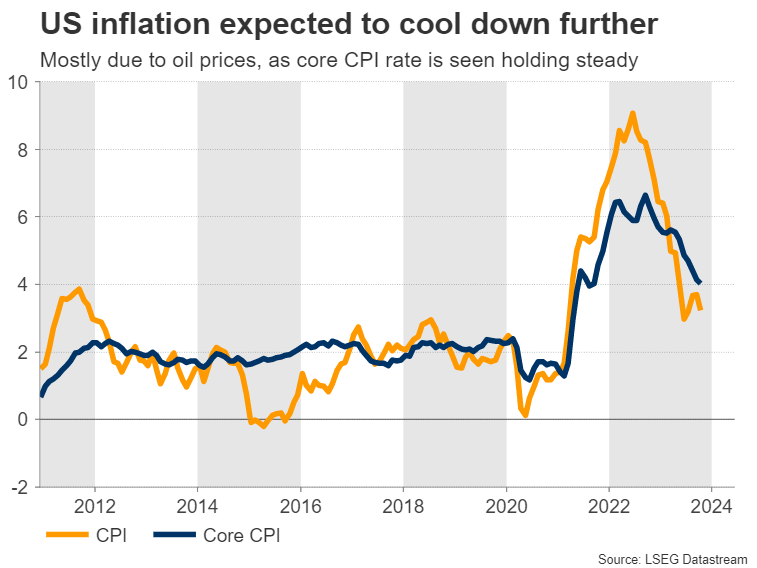
Ahead of the Fed decision, the latest US CPI inflation data will be published at 13:30 GMT on Tuesday. The headline CPI rate is forecast to have declined one tick to 3.1% in yearly terms from 3.2% earlier, mostly because of the recent decline in energy prices, as the core rate that excludes those effects is anticipated to have held steady at 4.0%.
As for any potential surprises, the risks seem tilted towards a hotter-than-expected inflation report, considering the signals from business surveys. Specifically, the S&P Global services PMI showed service providers raising their selling prices at the fastest pace since July, with the increase in prices paid of the ISM manufacturing PMI reflecting something similar.
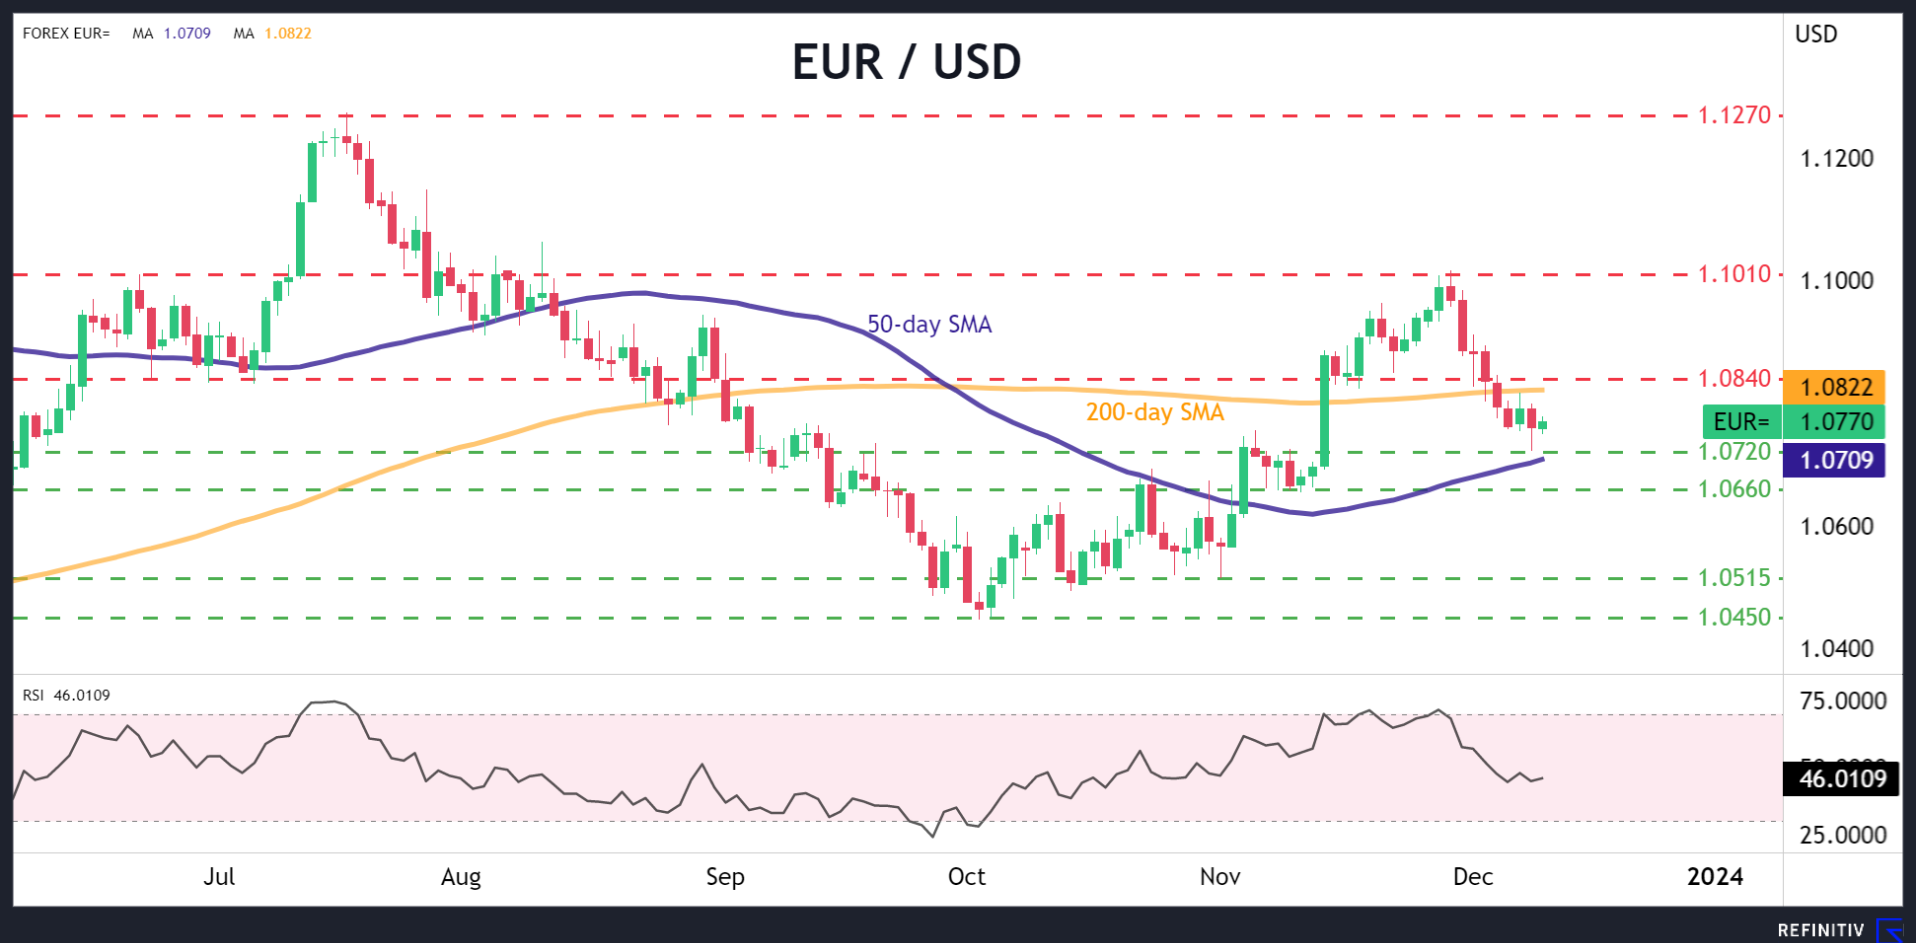
An upside surprise in inflation could dampen speculation for Fed rate cuts next year, and by extension allow the dollar to gain some ground ahead of the Fed decision. Looking at the euro/dollar chart, a potential drop below 1.0720 could open the door for downside extensions towards the 1.0660 zone.
Beyond that, the other key event will be the release of retail sales on Thursday, in the aftermath of the Fed. Forecasts point to a slight drop in monthly terms, although nothing too serious.
In conclusion, there is some scope for these events to boost the dollar, in case the inflation report exceeds estimates and the Fed signals fewer rate cuts than markets have baked into the cake for next year.
Will ECB Set the Stage for an Early 2024 Rate Cut?
- The final ECB rate-setting meeting for 2023 could hold surprises
- Market looks for rate-cut hints; extra focus on projections and overall rhetoric
- Decision will be announced on Thursday 12.15 GMT, press conference at 12:45 GMT
Is President Lagarde ready for a dovish tilt?
This week is shaping up to be a cracking one as the final ECB meeting for 2023 will be held on Thursday, a day after the respective Fed gathering. Armed with the latest projections and, following two days of intense discussions at the Frankfurt tower, the ECB is expected to keep its interest rates unchanged, but it could give strong hints about its 2024 strategy.
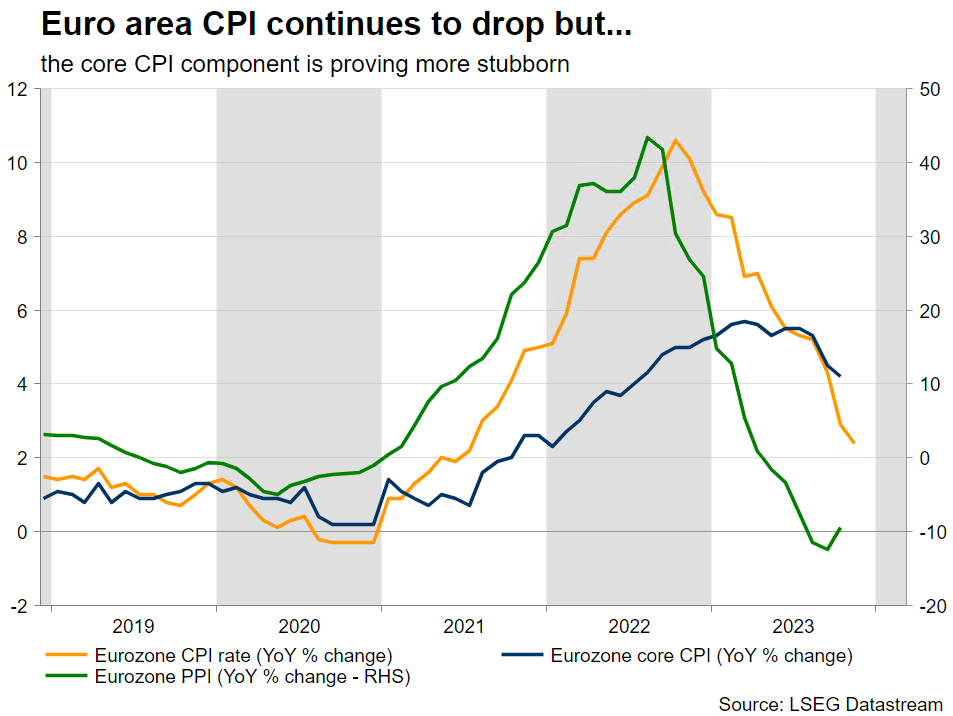
Going into the meeting, inflation continues to decelerate significantly. The preliminary report for the month of November for the euro area surprised on the downside with both the headline and core components dropping to 2.4% and 3.6% year-on-year respectively. While the former has been expected to ease considerably due to the weaker oil prices, the latter’s move caught some ECB officials by surprise.
Similar to other central banks, core inflation has been creating headaches during the second half of 2023. President Lagarde has not been extremely vocal about core inflation, understandably as the ECB’s remit refers to the headline figure. However, the recent weaker core inflation prints have forced a turn from the ECB hawks and, in a sense, have put the final nail in the coffin of rate hikes.
Projections are a very important piece of the puzzle
Having said that, is the ECB ready to signal that rate cuts are around the corner? The scheduled ECB staff projections, which will be released after the meeting, will probably play a key role. At the September edition, the inflation projection for 2025 was 2.1%. A downgrade of this figure, just below the 2% “threshold”, and an equally low CPI projection for 2026 would cement the ECB’s current stance, meaning that it is currently in a comfortable position to meet its 2% inflation target by 2025.
However, a 2025 projection dangerously close to 1.5% would not go down lightly. The market is expected to pick upon this figure in order to justify its aggressive easing expectations as the first 25bps rate cut is now priced in for the April meeting with an extra 110bps expected during 2024. As a comparison, the Fed is expected to ease monetary policy by only 110bps in 2024.
Some positive signs in the growth outlook
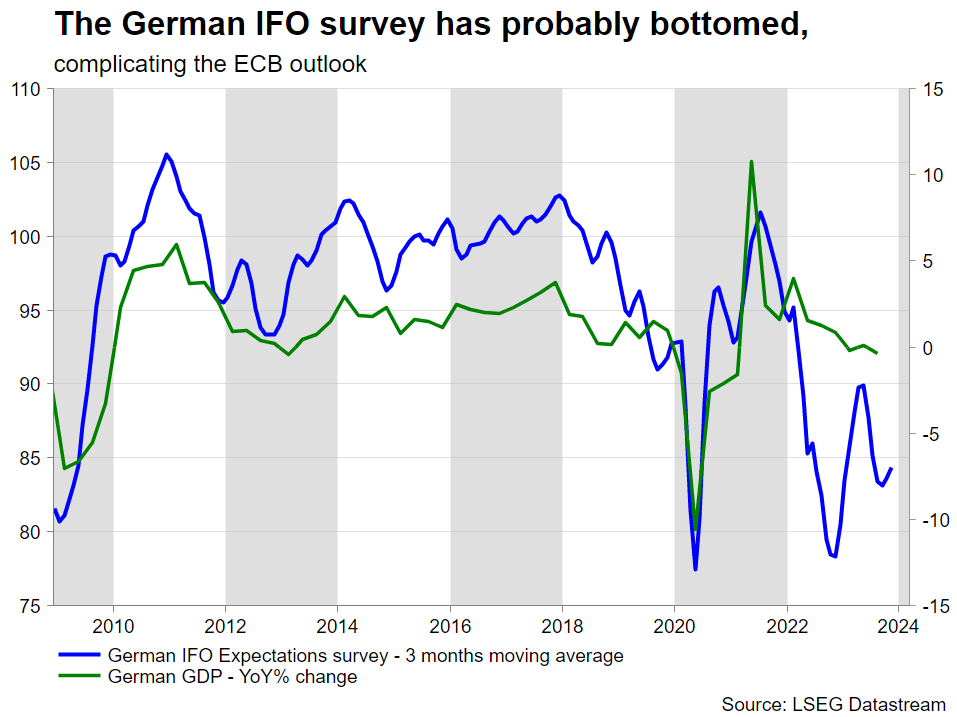
The market appears to be ignoring some bright spots in the forward-looking growth indicators. The latest PMIs and IFO surveys appear to have bottomed out. With Germany most likely contracting in 2023, the hawks could pin their hopes for a better start to 2024, especially following the latest positive news from China.
However, the latest figures show a negative annual growth rate for loans to non-financial corporations, with the full brunt of the 10 consecutive rate moves not yet fully felt by the system.
Putting everything together, the ECB is expected to remain balanced with a high risk of appearing a touch more dovish. An improbable announcement about an earlier stop in the reinvestment of PEPP principal payments could confuse the market but it might be largely ignored.
President Lagarde will be able to see the market reaction after the statement is released, potentially allowing her to rein in the market's expectations during the press conference and Q&A session.
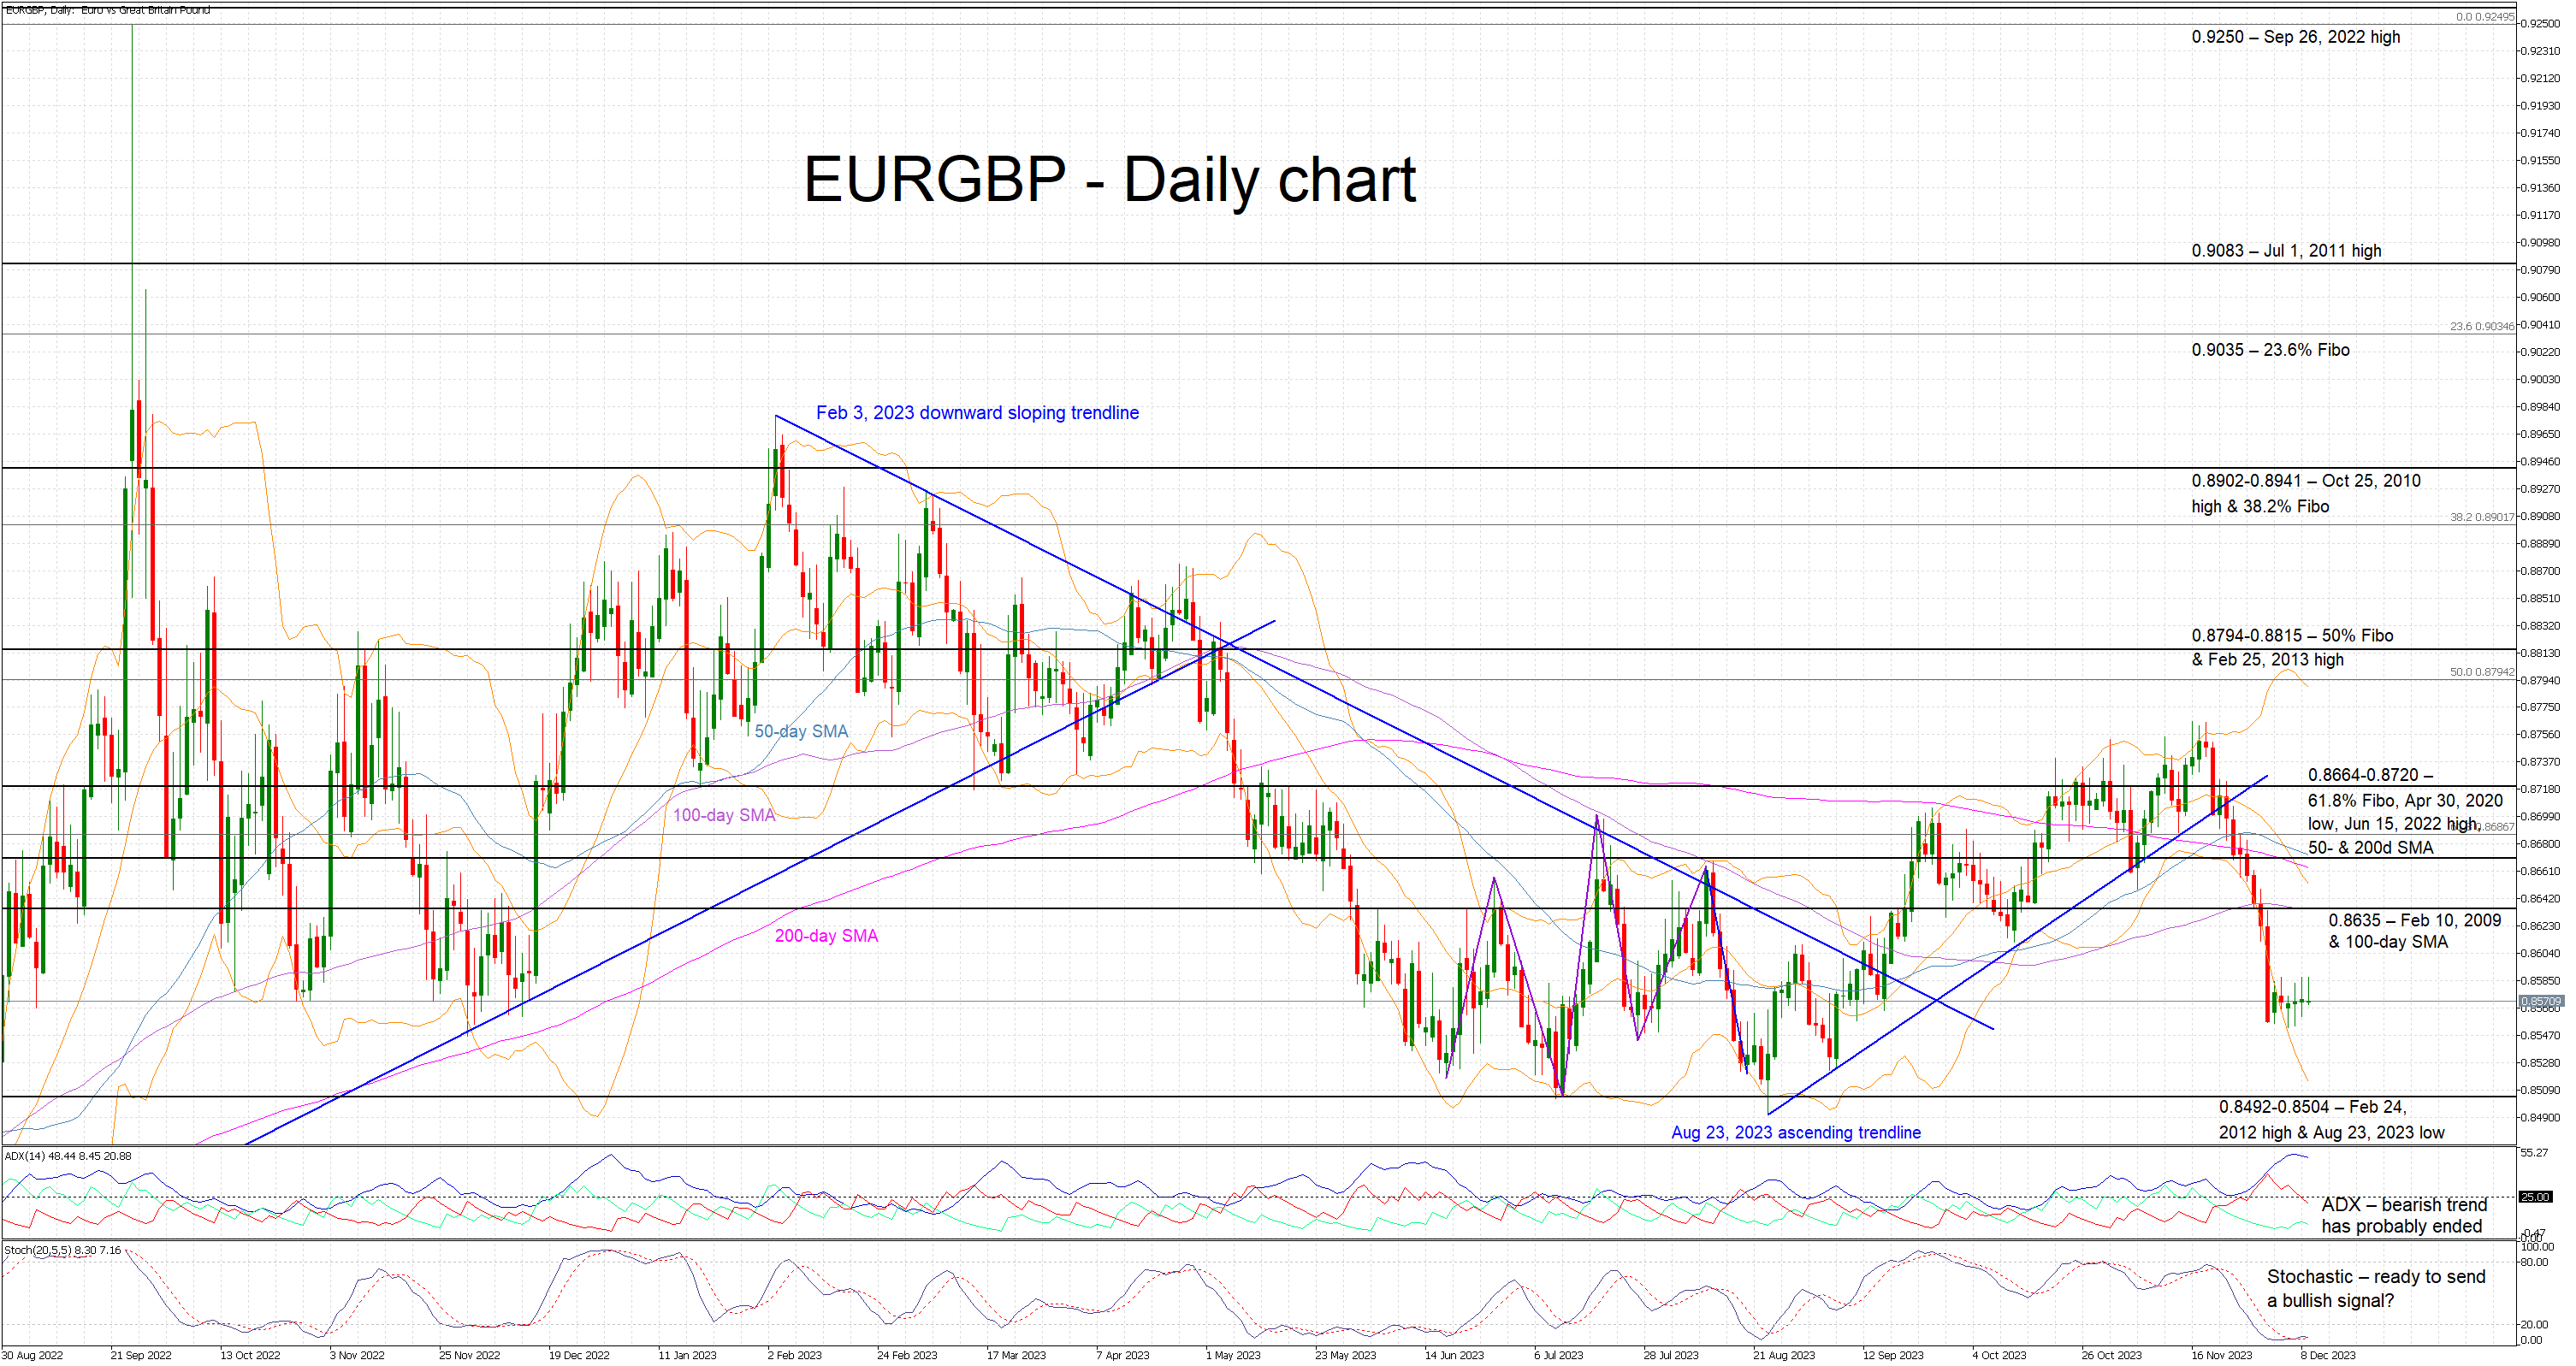
Euro is trying to find its footing against the pound
Euro’s hard-earned gains against the pound since late August have mostly evaporated. Seven straight red candles have pushed the euro-pound pair to new 3-month low, with the main reason most likely being the aggressive easing expectations built up for the ECB.
Focusing on this week, the performance of the euro-pound pair depends on the dovishness expressed at the ECB gathering. Should the ECB defy the dovish expectations, we could see a move towards the 0.8635 area. On the flip side, a truly dovish show on Thursday could open the door for a retest of the 2023 low at 0.8492.
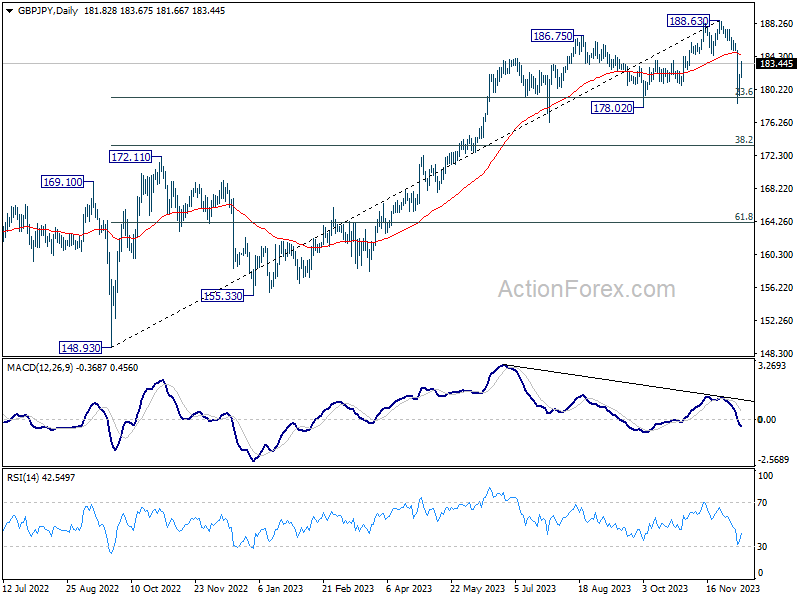
GBP/JPY Daily Outlook
Daily Pivots: (S1) 180.22; (P) 181.14; (R1) 182.71; More...
GBP/JPY's recovery from 178.78 extends higher today but outlook is unchanged. Upside of recovery should be limited below 184.44 support turned resistance to bring another decline. On the downside, below 181.66 minor support will bring retest of 178.68 support first. Firm break of will resume the fall from 188.63 and target 38.2% retracement of 148.93 to 188.63 at 173.46 next.
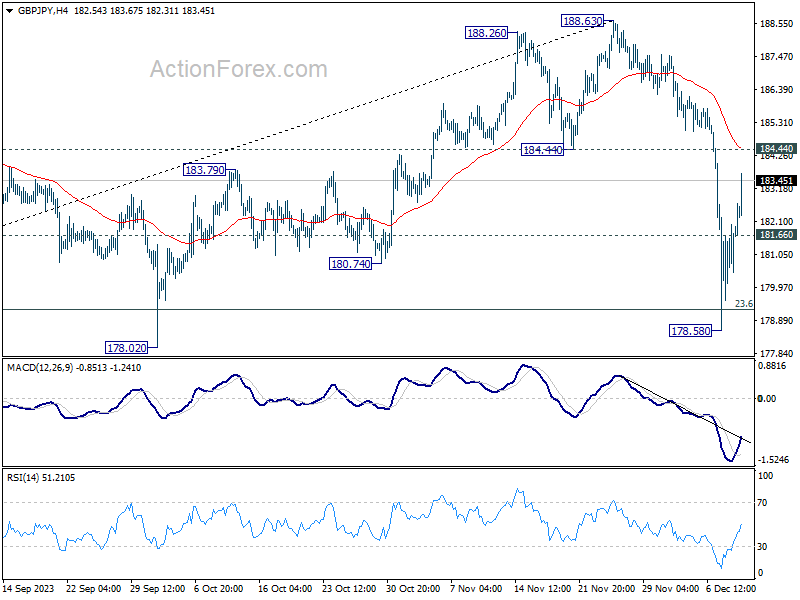
In the bigger picture, while a medium term top is in place at 188.63, there is no clear sign of long term bearish trend reversal yet. As long as 55 W EMA (now at 175.67) holds, price actions from 188.63 are seen as a corrective move only. Larger up trend from 123.94 (2022 low) could resume at a later stage.