Sample Category Title
GBP/USD Consolidates, US CPI and UK Employment Reports Next
Key Highlights
- GBP/USD started a downside correction from the 1.2732 zone.
- It traded below a key bullish trend line with support at 1.2640 on the 4-hour chart.
- The UK Claimant count could change by 20.3K in Nov 2023, up from 17.8K.
- The US CPI could decline further to 3.1% in Nov 2023 (YoY) from 3.2%.
GBP/USD Technical Analysis
The British Pound faced sellers near the 1.2735 zone against the US Dollar. GBP/USD started a downside correction and traded below the 1.2650 support.
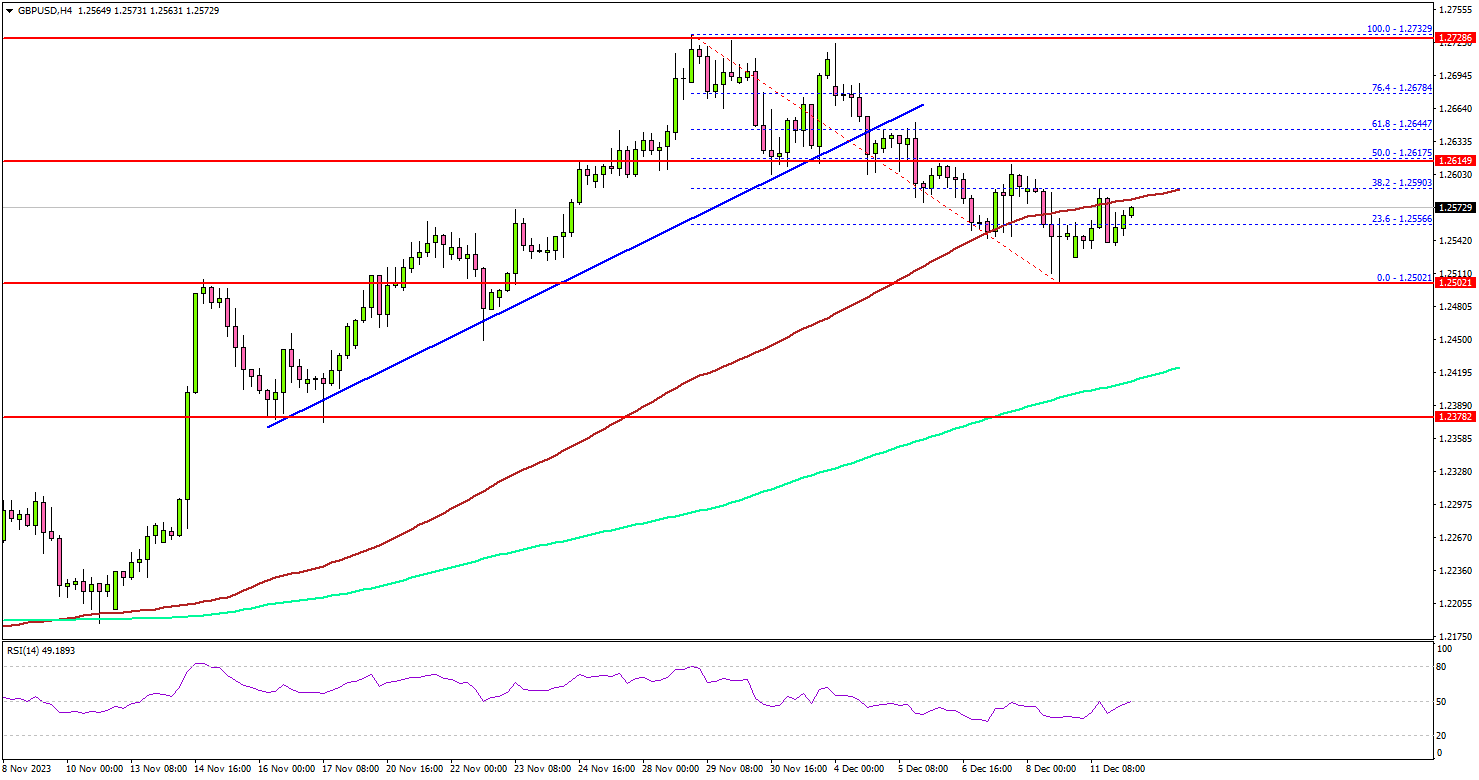
Looking at the 4-hour chart, the pair traded below a key bullish trend line with support at 1.2640. There was a spike below the 100 simple moving average (red, 4 hours) and 1.2550.
However, the bulls were active above the 1.2500 level. A low was formed near 1.2502 and the pair is now consolidating losses and trading well above the 200 simple moving average (green, 4 hours). On the upside, immediate resistance is near the 1.2620 level.
The 50% Fib retracement level of the recent decline from the 1.2732 swing high to the 1.2502 low is also near 1.2620. The next key resistance is near the 1.2640 level.
The main resistance is near 1.2670. A close above the 1.2670 zone could open the doors for more upsides. The next stop for the bulls might be 1.2740.
If there is another decline, the pair might find support near the 1.2500 level. If there is a downside break below the 1.2500 support, the pair could drop toward the 1.2450 level. The next major support is 1.2420, below which the bears might aim for 1.2300.
Looking at EUR/USD, the pair declined heavily toward 1.0740 and there is a risk of more downsides in the near term.
Economic Releases
- UK Claimant Count Change for Nov 2023 – Forecast 20.3K, versus 17.8K previous.
- UK ILO Unemployment Rate for Oct 2023 (3M) – Forecast 4.2%, versus 4.7% previous.
- US Consumer Price Index for Nov 2023 (MoM) – Forecast +0.1%, versus 0% previous.
- US Consumer Price Index for Nov 2023 (YoY) – Forecast +3.1%, versus +3.2% previous.
- US Consumer Price Index Ex Food & Energy for Nov 2023 (YoY) – Forecast +4%, versus +4% previous.
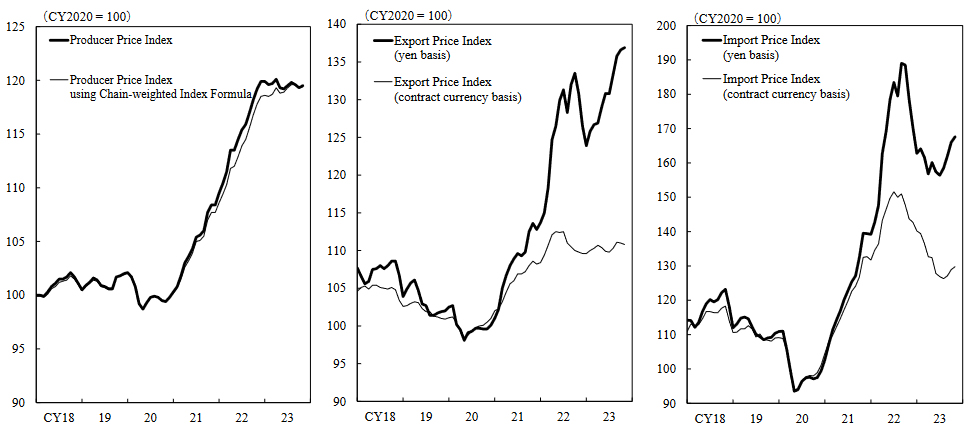
Japan’s PPI slows to weakest pace since February 2021
Japan's PPI slowed notably from 0.9% yoy to 0.3% yoy in November, but beat expectation of 0.1% yoy. That's nonetheless still the weakest pace since February 2021. November marked the 11th straight month in which the pace slowed.
Export prices was unchanged at 0.9% yoy. Import price decline slowed from -12.7% yoy to -9.7% yoy, staying negative for the eighth month.
During the month, PPI rose 0.2% mom. Import prices rose 0.7% mom. Export prices fell -0.2 %Mom.
Producer price growth stayed below the most recent consumer inflation reading for a third month. Growth in consumer prices excluding fresh food inched up to 2.9% in October.
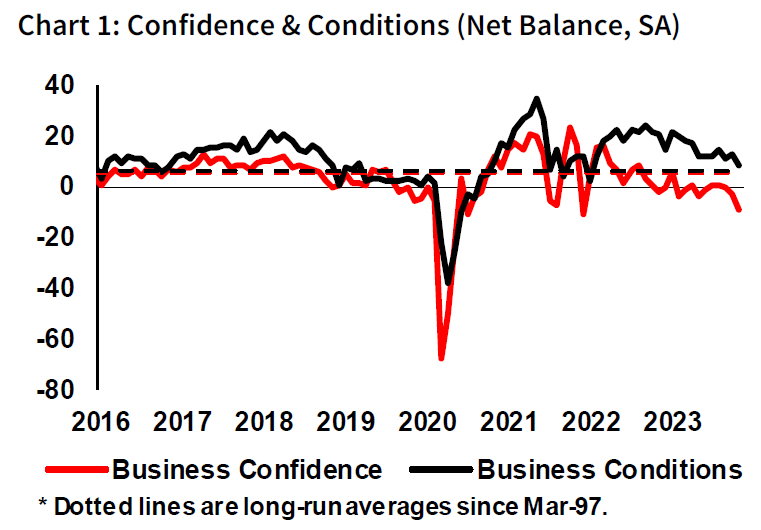
Australia’s NAB business confidence and conditions decline, signaling continued soft growth
Australia NAB Business Confidence fell from -3 to -9 in November. Business Conditions fell from 13 to 9. Trading conditions fell from 19 to 13. Profitability conditions fell from 11 to 6. Employment conditions were unchanged at 8.
NAB Chief Economist Alan Oster remarked, "Both confidence and conditions declined in the month and after a period of relative stability through mid-2023 appear to be softening further." He pointed out that, excluding the pandemic period, business confidence is at its weakest since around 2012. This was a time characterized by significantly weaker conditions and slowing growth in advanced economies.
Despite these declines, Oster noted that business conditions remain above average, reflecting their strong starting point. He emphasized the importance of monitoring whether this drop in confidence continues and if a trend develops in business conditions. For the moment, these indicators suggest "ongoing soft growth in Q4".
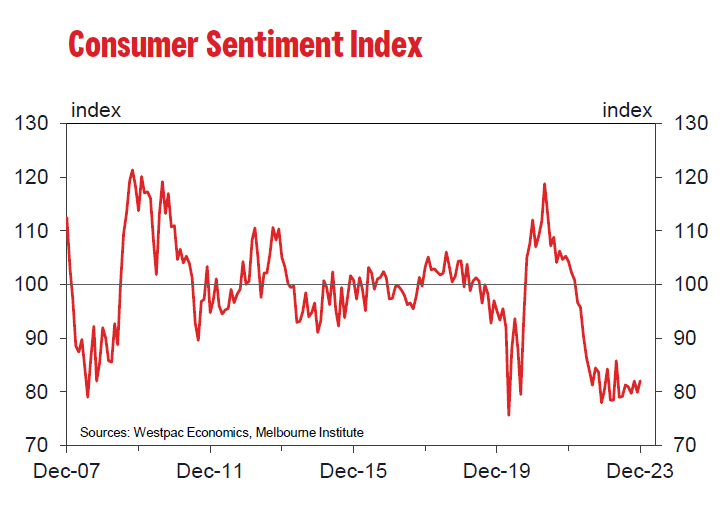
Australia’s Westpac consumer sentiment rose to 82.1, still far from upbeat
The latest release from Australia reveals a modest uptick in Westpac Consumer Sentiment Index, which rose by 2.7% mom to 82.1 in December. Despite this increase, Westpac's analysis describes the sentiment as "still very weak," emphasizing that "consumers remain far from upbeat."
Regarding RBA's next meeting on February 5-6, Westpac said, the "there is now a higher bar" to further tightening. It highlights the "subdued growth profile" and a "particularly weak household sector" underscored by the recent consumer sentiment results, suggesting that these factors might raise the threshold for another rate hike.
However, it's important to note the central bank's stance towards inflation. RBA has expressed a "very low tolerance for any upside surprises" in inflation rates, making the upcoming inflation data and the detailed quarterly release, due in late January, pivotal for February policy decision.
Swiss Franc Shines, Turns to SNB Decision for Fuel
- SNB announces its decision at 08:30 GMT Thursday
- Markets pricing in 25% probability for a rate cut
- However, that's unlikely to happen so soon
- Overall, outlook for Swiss franc remains positive
Swiss economy slows
The Swiss economy hit a road bump lately. Economic growth almost came to a standstill in the third quarter, printing just 0.3% from a year earlier as the manufacturing sector continued to struggle.
Similarly, inflation slowed sharply in November. The annual inflation rate fell to just 1.4%, some distance below the Swiss National Bank's target of "less than 2%". Hence, one could argue the SNB is the first major central to have won the war against inflation.
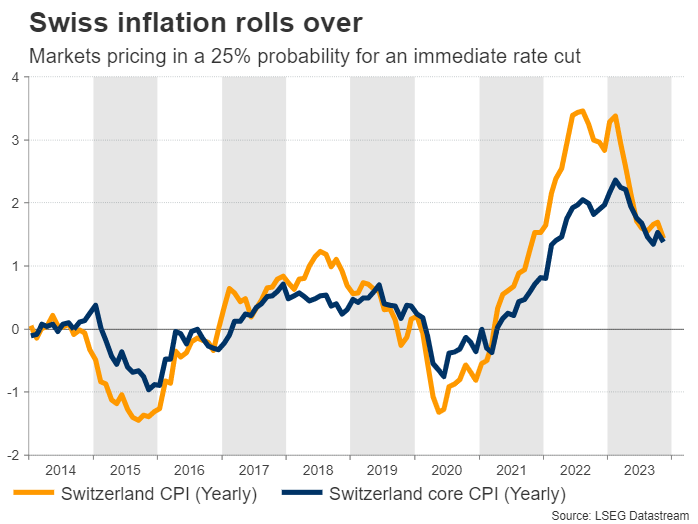
Against this backdrop, markets are pricing in a 25% probability of an immediate rate cut when the SNB meets on Thursday. For next year, traders anticipate almost three rate cuts in total, which is much less than what the Fed and the European Central Bank are expected to deliver.
Is a rate cut realistic?
Admittedly, it seems highly unlikely that the SNB will cut rates so soon. The latest commentary from SNB Chairman Jordan in mid-November included a warning that rates can still be raised further, so it would be a dramatic reversal to abandon that stance and cut rates immediately.
It would make more sense for the SNB to keep rates steady, but drop its tightening bias and shift to a neutral stance instead, putting the emphasis on incoming data to guide its future decisions. That was also the playbook adopted by the European Central Bank, which is usually the SNB's role model in terms of strategy.
The question is, would such a shift be enough to hurt the Swiss franc? Markets are already pricing in rate cuts in 2024, so a neutral shift at this stage would not be much of a surprise for traders.
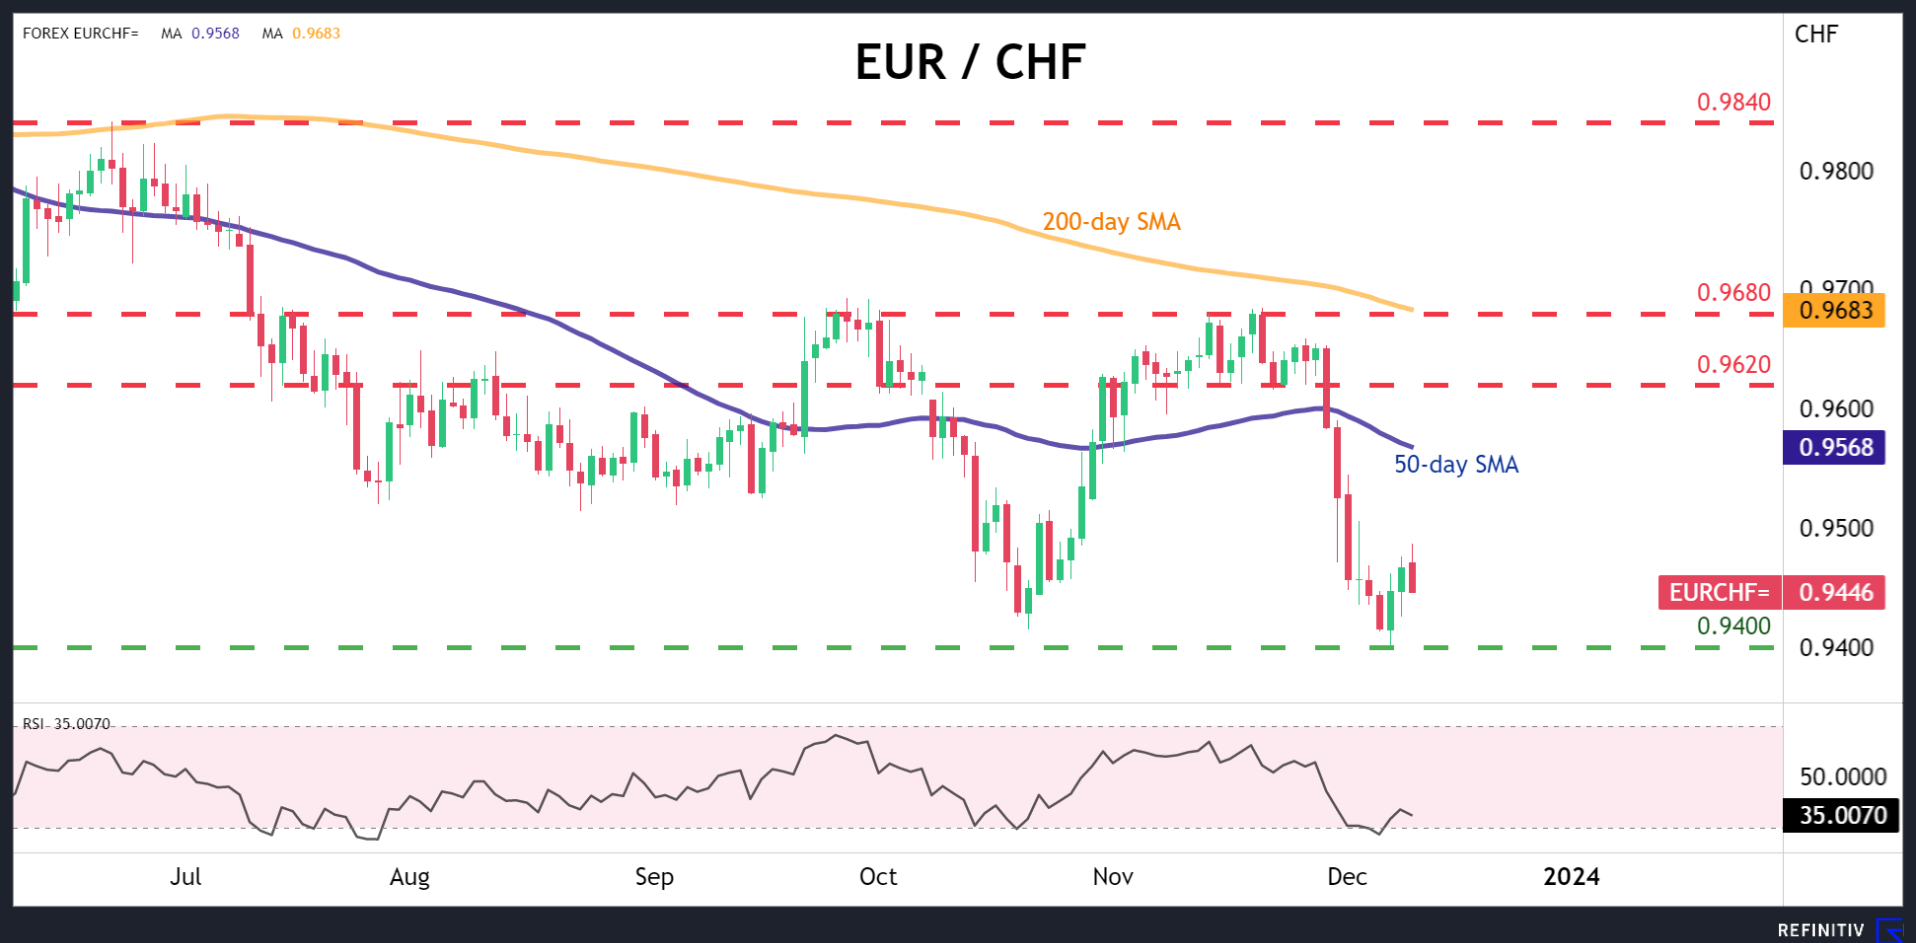
In fact, with the market pricing in a 25% probability for an immediate rate cut, the initial reaction in the Swiss franc will likely be positive if the SNB ultimately keeps rates unchanged. Looking at the euro/franc chart, the 0.9400 region could provide support to any declines, while on the upside, the first major resistance barrier might be around 0.9620.
What does 2024 hold for the franc?
In the big picture, the Swiss franc is the best performing major currency of this year, hitting an eight-year high against the euro and a record high against the Japanese yen lately. The SNB's long-awaited exit from negative interest rates and its FX interventions to prop up the franc this year in order to fight inflation were major factors, alongside the nation's classic current account surplus.
Looking into next year, this stellar performance could continue. Even though the SNB probably won't be so active in the FX market now that inflation has cooled, there might be other positive developments for the franc. For instance, foreign central banks like the Fed and ECB will likely cut rates faster and deeper than the SNB will.
Finally, the franc could also benefit from a slowing global economy, thanks to its safe-haven status. The unfolding economic weakness in Europe and China coupled with the uncertainty surrounding the US presidential election could be a combination that keeps the franc supported, as nervous investors search for shelter.
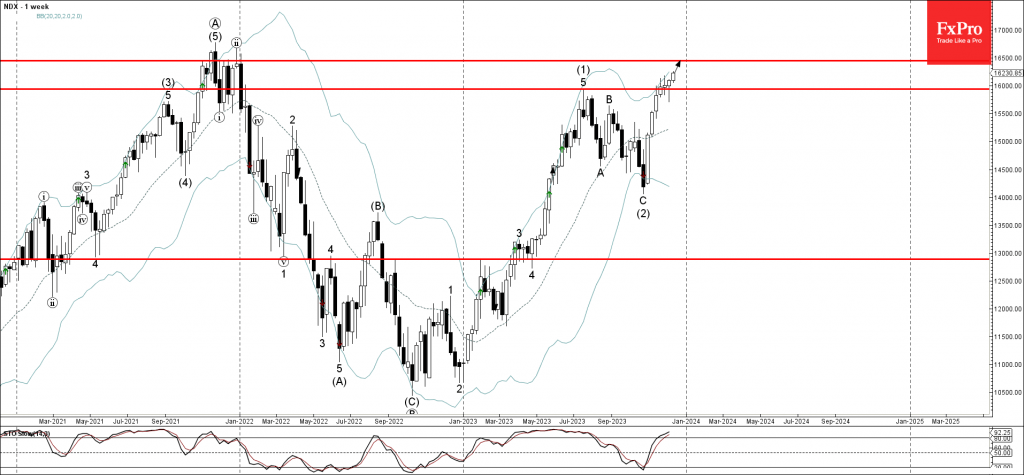
Nasdaq-100 Wave Analysis
- Nasdaq-100 broke resistance level 16000.00
- Likely to rise to resistance level 16500.00
Nasdaq-100 index recently under the bullish pressure after the price broke above the round resistance level 16000.00, which stopped the weekly uptrend earlier this year, as can be seen below.
The breakout of the resistance level 16000.00 accelerated the active intermediate impulse wave (3) .
Given the strong uptrend from the start of this year, Nasdaq-100 index can be expected to rise further to the next resistance level 16500.00 (which started the weekly downtrend at the end of 2021).
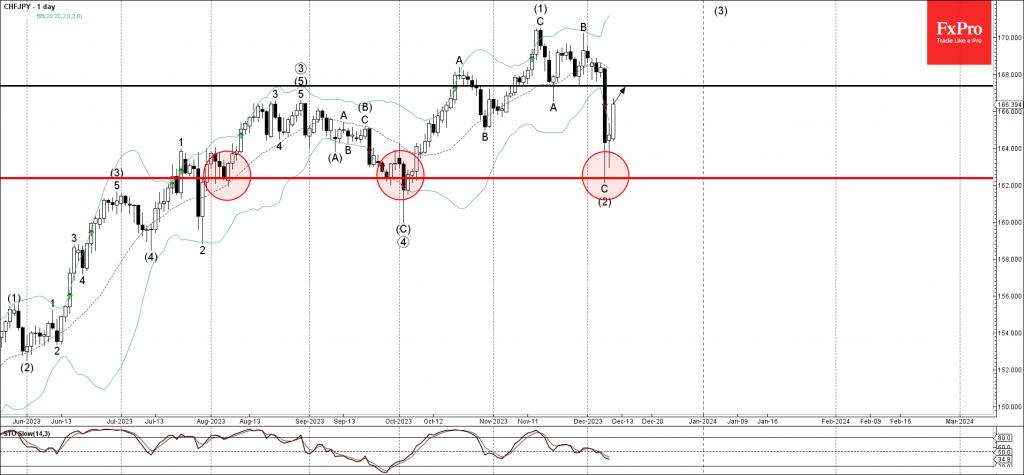
CHFJPY Wave Analysis
- CHFJPY reversed from support level 162.40
- Likely to rise to resistance level 167.35
CHFJPY recently reversed up sharply from the key support level 162.40, which has been reversing the pair from the start of August.
The upward reversal from the support level 162.40 created the daily Japanese candlesticks reversal pattern Long legged Doji.
Given the strong daily uptrend, CHFJPY currency pair can be expected to rise further to the next resistance level 167.35 (former support from the end of November).
Euro Shows Temporary Stability
The Euro's recent stabilization against the US dollar, now hovering around 1.0766, may be short-lived. Market eyes are turning towards the upcoming two-day meeting of the US Federal Reserve, starting Tuesday and concluding late Wednesday. Key attention will be on the interest rate decision, widely anticipated to hold steady at 5.50% annually.
Investor focus is keenly set on the Fed's potential moves for February and March, with speculation rife about a possible rate reduction by the end of Q1. Any hints or signals in this regard will be crucial for market dynamics.
Monday's calendar is light, with no major statistics due from either the Eurozone or the US. The real action is expected to start Tuesday.
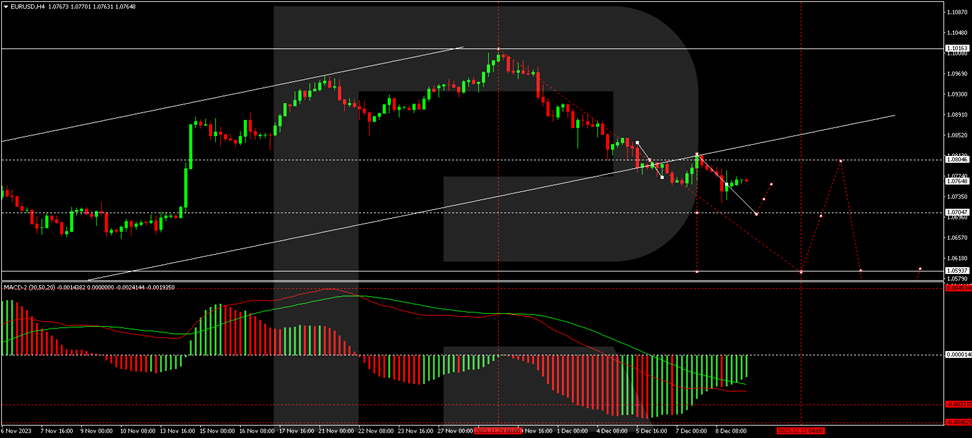
EUR/USD technical analysis
On the EUR/USD H4 chart, a decline impulse to 1.0804 has been observed. Currently, the market has formed a consolidation range around it. A downward wave to 1.0704 could develop today. This practically implies a breakout from the range downwards, opening the potential for further trend development towards 1.0594. This is the first target. Once the quotes reach it, a correction to 1.0800 might start, followed by a decline to 1.0400. This is a local target. Technically, this scenario is confirmed by the MACD, where its signal line is below zero, pointing strictly downwards.
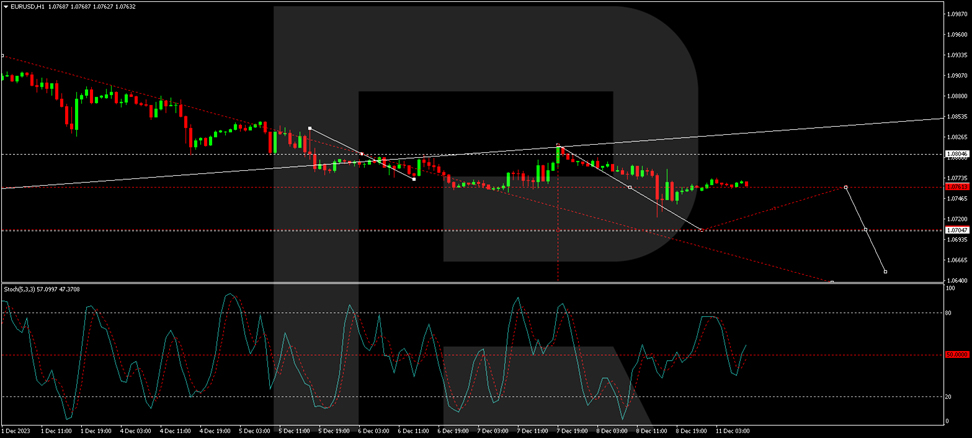
On the EUR/USD H1 chart, the quotes have rebounded from 1.0805. A structure of a declining wave to 1.0705 is forming. After reaching this level, a correction link to 1.0760 cannot be ruled out (a test from below). Next, a decline to 1.0655 could follow. This is a local target. Technically, this scenario is confirmed by the Stochastic oscillator, with its signal line below 50 and a potential drop to 20.
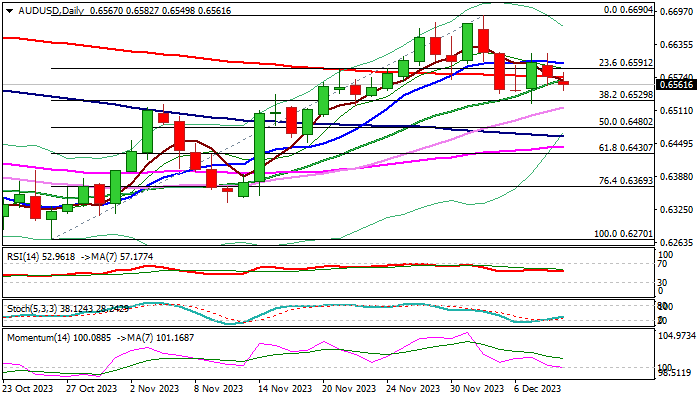
AUD/USD: Holds in Extended Sideways Mode, Awaiting Key Economic Releases for Direction Signals
AUDUSD eases further on Monday and breaks below 200DMA which marks approximately the mid-point of 0.6525/0.6620 congestion, in which the pair is holding for the fifth straight day.
Near-term action lacks clear direction signal while holding within the range, as daily MA’s are in mixed setup and momentum indicator is moving along with the centreline, although, the larger picture is still bullishly aligned.
Range floor also marks significant Fibo support (38.2% retracement of 0.6270/0.6690) and near-term bullish bias is expected to remain in play while the price action stays above this level, however lift and close above range top is required to verify bullish signal and shift focus higher.
Conversely, firm break of 0.6525 pivot would risk deeper pullback.
Investors await release of Australia’s business confidence and US inflation report on Tuesday, as well as Fed’s rate decision on Wednesday.
Res: 0.6574; 0.6601; 0.6619; 0.6656.
Sup: 0.6550; 0.6525; 0.6480; 0.6430.