
Sample Category Title
Strong US Jobless Report Sparks Optimism, But Challenges Loom Ahead
Friday’s jobless report from the US was strong. It could’ve gone both ways, but it went well. The US economy added nearly 200’000 new nonfarm jobs in November, average earnings were higher than expected on a monthly basis, but stable around the 4% level on a yearly basis. That’s twice the Federal Reserve’s (Fed) inflation target and sticky, but it didn’t bother much, and the jobless rate fell from 3.9% to 3.7%, as the participation rate slightly improved.
The stronger-than-expected jobs data sent the US 2-year yield to near 4.75%, and the 10-year yield recovered to 4.28%, but the stock traders gave a cheerful reaction to the news that the US jobs market is softening, not collapsing. The latest data suggests that the Fed is one step closer to realizing its Goldilocks scenario: it could win the inflation battle without pushing the economy into recession. Is it too good to be true? This week’s inflation update and the Fed decision will tell.
The S&P500 traded at a ytd high on Friday, and Nasdaq closed a touch below its ytd high. The US dollar index recovered from the selloff of the day before which was mostly driven by a notable jump in the yen following the Bank of Japan (BoJ) Governor Ueda’s confession last week that the BoJ’s negative rates would get tougher to maintain from the end of the year. The USDJPY – which fell from above 147 to 142 in a single move – is now consolidating gains around 145 level as traders are out guessing whether the BoJ will exit the negative rates before the year ends. Elsewhere, gold slipped below $2000 per ounce, the EURUSD consolidates near its 100-DMA, near the 1.0760 mark, Cable is losing field on the back of a broad-based USD rebound and tests the 1.25 to the downside, while the AUDUSD hovers around its 200-DMA. The pair is still in the positive trend according to the Fibonacci retracement on the latest rebound, but on the verge of sinking into the bearish consolidation zone, as is the case for the other major peers.
Keeping up with the central banks
The economic calendar for the week is heavy. The US will announce its latest CPI update on Tuesday and the Fed will announce its latest policy verdict on Wednesday, then the Swiss National Bank (SNB), the European Central Bank (ECB) and the Bank of England (BoE) will give their last verdict for this year on Thursday. All four major central banks are expected to keep their interest rates steady at the current levels, but we will closely scrutinize how they address the rate cut expectations that have been ahead of their skis since the end of October. Chances are that the accompanying statements will attempt to cool down the doves.
Activity on Fed funds futures asses nearly 75% chance for May rate cut, and around 42% chance for a March cut. The game will be played on this field. Either a sufficiently dovish Fed will boost earlier rate cut expectations, or – more reasonably – Powell will reiterate that the battle against inflation is on the right track, but the rates will remain high for a prolonged period until the Fed is convinced that the inflation battle is won. If that’s the case, we could see the US dollar extend recovery against major peers and the major pairs slip into bearish consolidation zone before the holiday season.
USD/JPY Daily Outlook
Daily Pivots: (S1) 143.18; (P) 144.20; (R1) 145.89; More...
USD/JPY's recovery from 141.59 continues today, and further rally could be seen. But upside should be limited below 147.14 support turned resistance. On the downside, below 143.75 minor support will turn bias to the downside for retesting 141.59. Break of 141.59 and sustained trading below 142.45 fibonacci level will pave the way to next fibonacci level at 136.63.
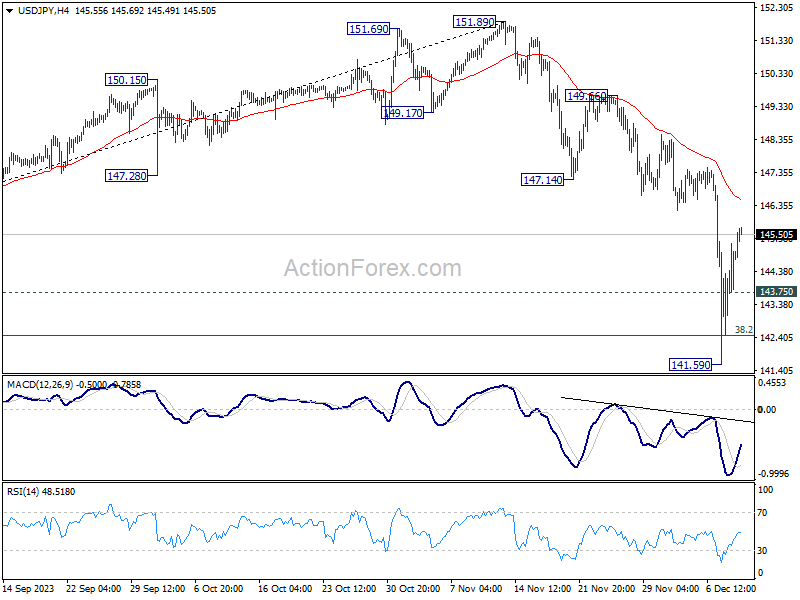
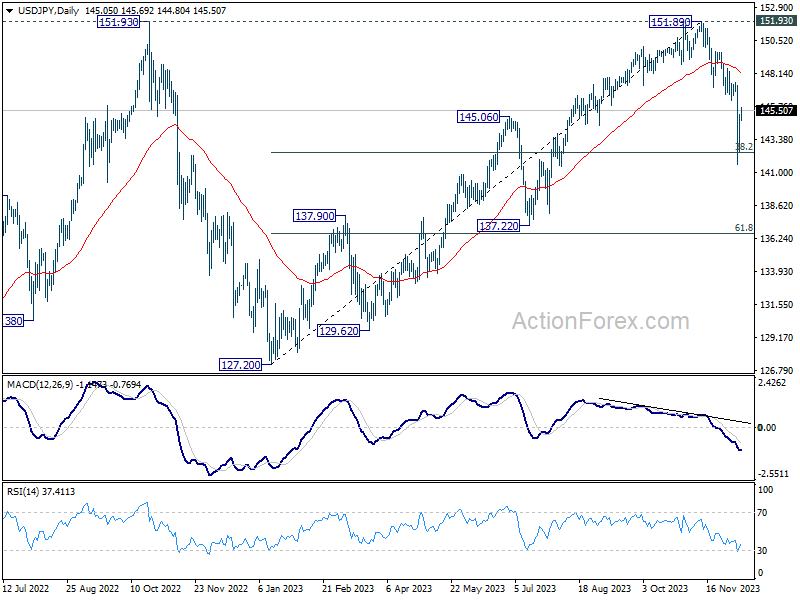
In the bigger picture, current fall from 151.89 is seen as the third leg of the corrective pattern from 151.93 (2022 high). Deeper decline would be seen through 38.2% retracement of 127.20 to 151.89 at 142.45 to 61.8% retracement at 136.63. This will now remain the favored as long as 147.14 support turned resistance holds.
Yen and Aussie Soften in the Wake of Yuan’s Decline
Chinese Yuan's significant selloff in Asian session today had a ripple effect across several major currencies, dragging down Japanese Yen, Australian Dollar, and New Zealand Dollar. This movement was largely spurred by concerning data from China indicating deepening deflation, which also negatively impacted Hong Kong's stock market. Yuan's future trajectory now hinges critically on a series of Chinese economic data scheduled for release later this week, making it a focal point for market analysts and investors in the region.
Meanwhile, Euro, Dollar, and Swiss Franc emerged as the stronger currencies in the current environment, whereas British Sterling and Canadian Dollar exhibited mixed performance. Today's trading might see subdued activity due to the empty economic calendar in both Europe and North America. However, this lull is expected to be temporary, as the week is set to gain momentum in volatility with four major central bank meetings on the horizon, accompanied by a substantial influx of economic data from various regions.
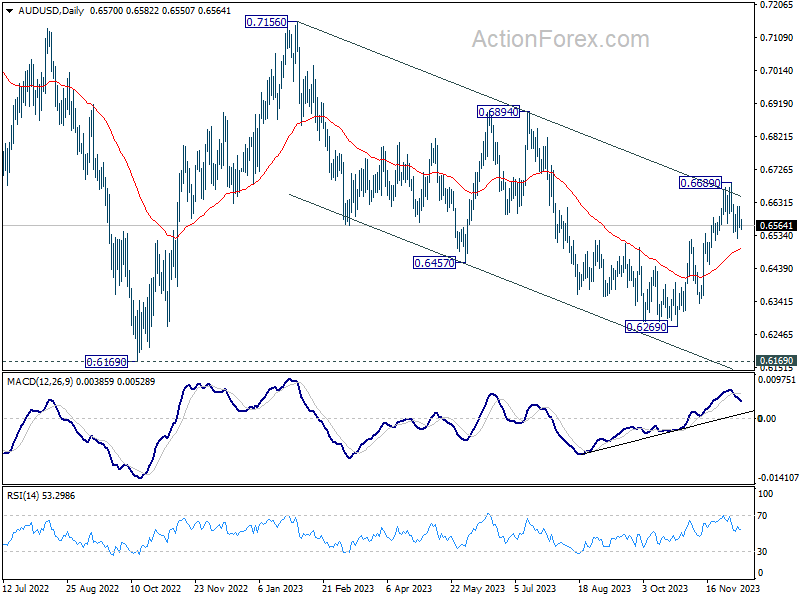
From a technical analysis perspective, AUD/USD is a currency pair that warrants close attention this week. Initial resistance was seen when the pair hit medium term falling channel from 0.7156. Yet, the subsequent pull back is relatively shallow, thus still keeping the rally from 0.6269 alive. However, sustained break of 55 D EMA (now at 0.6494) will argue that the rebound has completed, and down trend from 0.7156 is ready to resume.
In Asia, Nikkei rose 1.50%. Hong Kong HSI is down -1.18%. China Shanghai SSE is up 0.29%. Singapore Strait Times is down -0.65%. Japan 10-year JGB yield rose 0.0063 to 0.780.
China's CPI fell to -0.5% yoy in Nov, deepening deflation
Released over the weekend, China's economic data revealed a concerning trend as CPI plunged further into negative territory in November, marking the country's deepest deflationary period in three years. CPI fell to -0.5% yoy, a notable decline from -0.2% yoy in the previous month and falling short of the expected -0.2% yoy. This deflationary reading is the most significant since November 2020, indicating mounting economic pressures. Core CPI, which excludes volatile items such as food and fuel, remained stable at 0.6% yoy, mirroring October's figures.
National Bureau of Statistics chief statistician, Dong Lijuan, highlighted that the overall decline was driven primarily by decrease in energy and food prices. In particular, food prices dropped by -4.2% yoy, significantly impacted by a sharp -31.8% yoy decrease in pork prices. Meanwhile, non-food prices saw a modest increase of 0.4% yoy, with services prices climbing by 1.0% yoy.
On a month-on-month basis, CPI also experienced a downturn, falling by -0.5% mom in November from the previous month. This decline was characterized by a -0.9% drop in food prices and a -0.4% decrease in non-food prices.
From January to November, the average CPI increase was a mere 0.3% yoy, starkly undershooting China's set annual inflation target of around 3%.
Furthermore, PPI also recorded a downturn, declining by -3.0% yoy, which is worse than the prior month's -2.6% yoy and below the anticipated -2.8% yoy. This marks the 14th consecutive month of negative PPI readings, the worst since August.
USD/CHN sets sight on 7.2 as rebound from fibonacci support extends
Chinese Yuan weakens notably in Asian session today, setting its sights on crossing the 7.2 mark against Dollar. This movement is largely attributed to deepening deflation in consumer and factory prices in China, exerting downward pressure on the Yuan. Concurrently, Dollar is still riding the tailwind generated by last week's robust job data.
A key question for Yuan is whether its extended decline, which began in January this year, concluded in September. And, if Yuan is now in a medium-term up trend that's set to extend through 2024.
Some economists remain cautious about the currency's prospects, pointing to the prolonged downturn in China's housing market and consumer spending as significant drags on its value. Further impacting Yuan is the ongoing "de-risking" efforts by multinational corporations. These firms are increasingly adopting a "China+" strategy, diversifying their operations by adding plants and facilities in other countries, thereby diverting investments away from China. Moreover, these companies are likely to continue repatriating earnings, driven by China's relatively low interest rates, which could further depress Yuan.
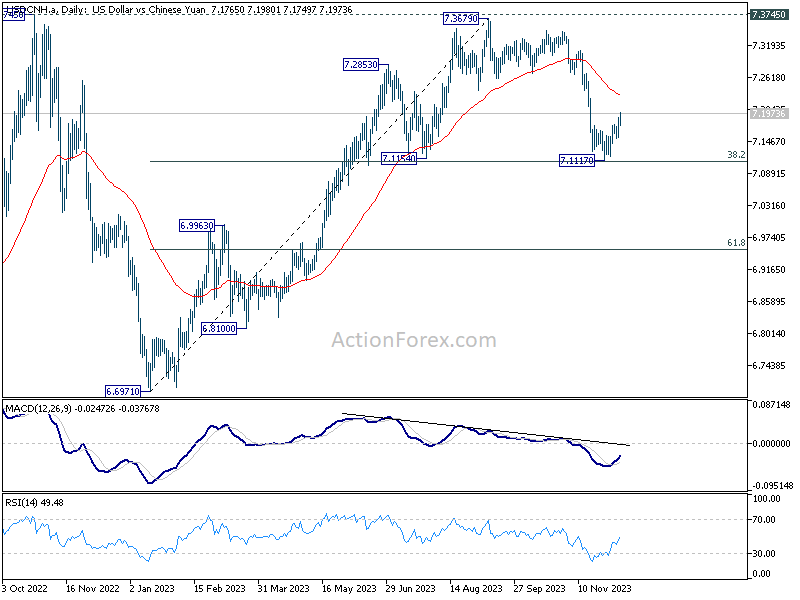
From a technical perspective, it remains to be confirm is USD/CNH's fall from 7.3679 is a correction to the up trend from 6.6971, or reversing it.
The notable rebound from 7.1154 cluster support (38.2% retracement of 6.6971 to 7.3679 at 7.1117) is favoring the former case. Even so, sustained break of 55 D EMA (now at 7.2311) is needed to confirm completion of the pull back, and bring retest of 7.3679/3745 resistance zone.
On the other hand, sustained break of 7.1117/54 will favor the latter case of bearish trend reversal, and target 61.8% retracement at 6.9533 and below.
USD/CNH's trajectory is not only crucial in understanding the Yuan's movements but also serves as a valuable guide for USD/JPY. Additionally, it acts as a secondary indicator for the strength or weakness of AUD/USD.
Bitcoin and Ether undergo sudden pullback as consolidation phase commences:
The cryptocurrency markets saw a sharp downturn in today's Asian session. The decline doesn't seem to be triggered by any specific event and might be amplified by the typically low liquidity on Mondays in the Asian markets. Another contributing factor could be profit-taking by traders following a recent strong bull run, especially with the impending FOMC rate decision looming on Wednesday.
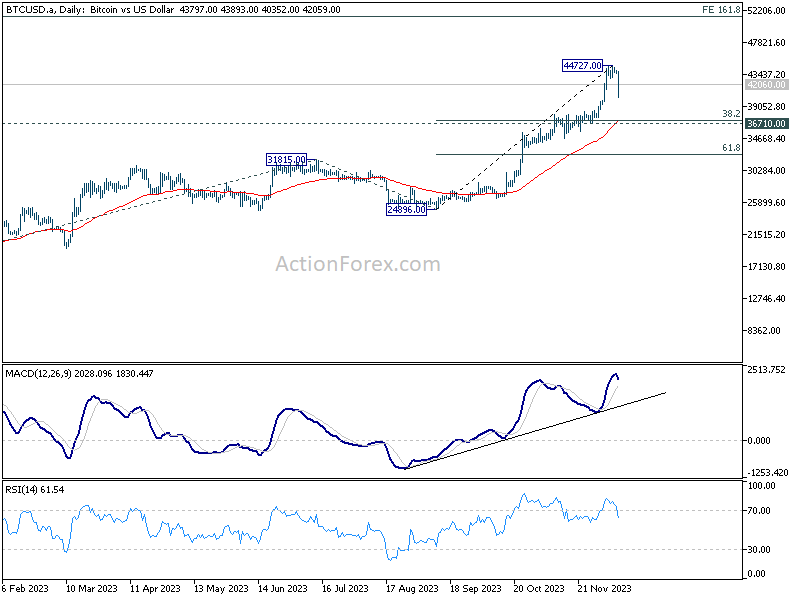
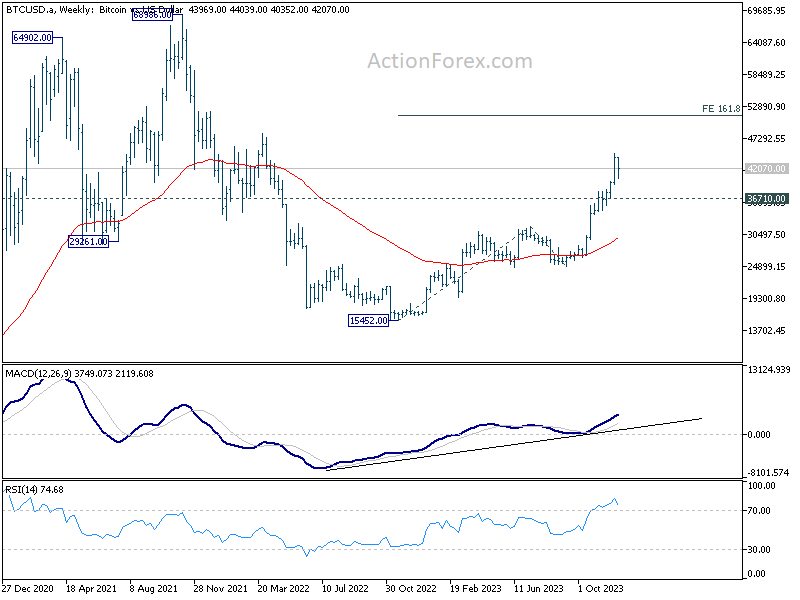
Technically speaking a short term top should be in place at 44727 in Bitcoin. Consolidations should follow in the near term, and deeper pull back cannot be ruled out. But downside should be contained by 36710 cluster support (38.2% retracement of 24896 to 44727 at 37151) to bring rebound. Larger uptrend from 15452 is expected to resume at a later stage.
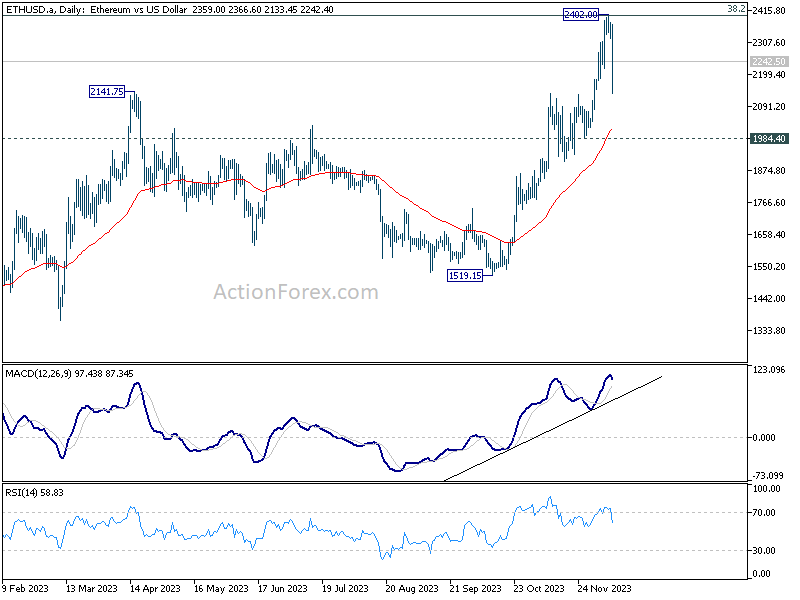
As for Ethereum, a short term top is in place at 2402, and more consolidative trading would be seen in the near term. There is risk of deeper pull back from outlook will stay cautiously bullish as long as 1984.4 support holds, which is close to 55 D EMA (now at 2017).
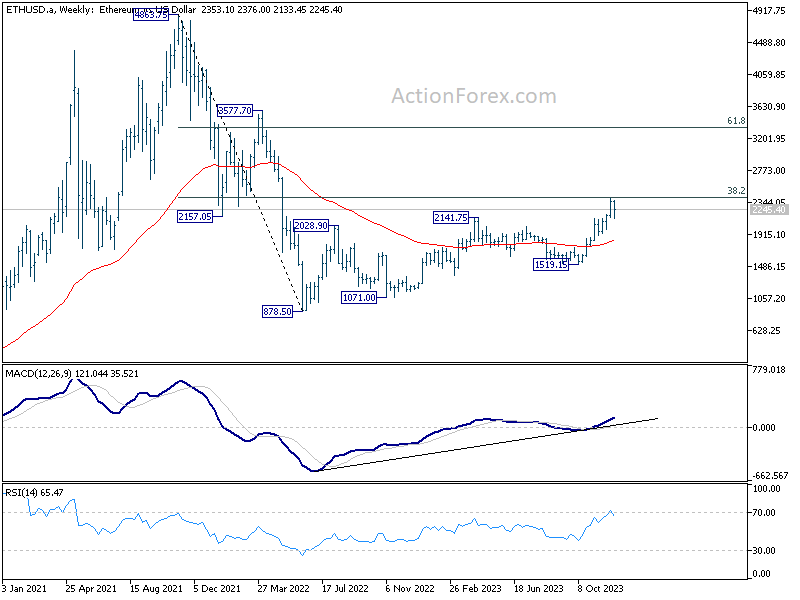
However, the larger outlook of Ethereum is less bullish, as it's just capped by 38.2% retracement of 4863.7 to 878.5 at 2400. Break of above mentioned 1984.4 support will indicate rejection by 2400 fibonacci level, and keeps medium term outlook neutral at best.
A week of high stakes: Central bank frenzy and a wave of economic data on the horizon
The global financial markets brace for a series of policy decisions from the world's leading central banks and a deluge of key economic data releases. Central to this week's economic narrative is FOMC meeting, coupled with policy announcements expected from SNB, BoE, and ECB.
The consensus anticipates Fed will maintain interest rates unchanged at 5.25-5.50%. The center of attention, however, is directed towards the updated "dot plot," a graphical representation of the individual FOMC members' interest rate projections.
The previous median projection in September pointed towards an increase in the federal funds rate to 5.625% by the close of this year, with a majority of 12 out of 19 FOMC members in agreement. Given the improbability of another rate hike in the current meeting, a crucial question looms: Will the forthcoming dot plot eliminate the prospect of additional rate increases, or simply defer them to the next year?
Another critical aspect to watch is the projected pace of monetary policy relaxation in 2024. Earlier projections indicated reduction in federal funds rate to 5.125% by the end of the upcoming year. This projection, however, was marked by a wide array of predictions, with the most hawkish member forecasting a rate of 6.125%, while the most dovish estimates hovered at 4.375%. The revised pace of rate cuts will be instrumental in signaling the timing for the onset of policy easing.
Globally, SNB, BoE, and ECB are also anticipated to maintain their monetary policies unchanged. The overarching message likely to emanate from these institutions is a continued commitment to combating inflation, highlighting that it is too soon to contemplate rate cuts. Meanwhile, SNB's forthcoming conditional inflation forecast, ECB's latest economic projections, and BoE's voting pattern will offer valuable insights, potentially swaying market sentiments.
Moreover, the week is packed with a barrage of important economic data releases across the globe, which are poised to have significant ramifications on the markets. Some important ones include US CPI, German ZEW economic sentiment, UK GDP and employment, Japan Tankan survey, Australia employment, New Zealand GDP, and a batch of data from China including industrial production and retail sales. The release of global flash Purchasing Managers' Index (PMI) data on Friday will further enrich this data trove.
Here are some highlights of the busy week:
- Monday: Japan BSI manufacturing index, machine tool orders.
- Tuesday: Australia Westpac consumer confidence, NAB business confidence; Japan PPI; UK employment; German ZEW economic sentiment; US CPI.
- Wednesday: New Zealand current account; Japan Tankan survey; UK GDP, production, trade balance; Swiss SECO economic forecasts; Eurozone industrial production; US PPI, FOMC rate decision.
- Thursday: New Zealand GDP; Australia employment; Japan machine orders; Swiss PPI, SNB rate decision; BoE rate decision; ECB rate decision; Canada manufacturing sales; US retail sales, jobless claims, business inventories.
- Friday: New Zealand BusinessNZ manufacturing; Australia PMIs; Japan PMI manufacturing, tertiary industry index; China industrial production, retail sales, fixed asset investment; Eurozone PMIs, trade balance; UK PMIs; Canada housing starts, wholesale sales; US Empire state manufacturing, industrial production, PMIs.
USD/JPY Daily Outlook
Daily Pivots: (S1) 143.18; (P) 144.20; (R1) 145.89; More...
USD/JPY's recovery from 141.59 continues today, and further rally could be seen. But upside should be limited below 147.14 support turned resistance. On the downside, below 143.75 minor support will turn bias to the downside for retesting 141.59. Break of 141.59 and sustained trading below 142.45 fibonacci level will pave the way to next fibonacci level at 136.63.
In the bigger picture, current fall from 151.89 is seen as the third leg of the corrective pattern from 151.93 (2022 high). Deeper decline would be seen through 38.2% retracement of 127.20 to 151.89 at 142.45 to 61.8% retracement at 136.63. This will now remain the favored as long as 147.14 support turned resistance holds.
Economic Indicators Update
| GMT | Ccy | Events | Actual | Forecast | Previous | Revised |
|---|---|---|---|---|---|---|
| 23:50 | JPY | BSI Large Manufacturing Index Q4 | 5.7 | 5.6 | 5.4 | |
| 23:50 | JPY | Money Supply M2+CD Y/Y Nov | 2.30% | 2.50% | 2.40% | |
| 06:00 | JPY | Machine Tool Orders Y/Y Nov P | -13.60% | -20.60% |
Gold Technical: Extension of Corrective Decline Ahead of FOMC
- Lofty dovish expectations of 4 Fed funds rate cut in 2024 are at risk of being dialed back.
- Short-term bullish momentum has resurfaced in the US 10-year Treasury real yield.
- Spot Gold (XAU/USD) may continue its short-term corrective decline sequence.
- Watch the key short-term resistance at US$2,040 on Spot Gold (XAU/USD).
Spot Gold (XAU/USD) has shaped the expected pull-back towards the short-term support levels of US$2,032/2,018 and US$2,006 highlighted in our prior analysis from its intraday all-time high of US$2,149 printed last Monday, 4 December.
Also, Spot Gold (XAU/USD) recorded its worst weekly loss of -3.26% since the week of 25 September 2023 on the backdrop of better-than-expected US non-farm payrolls data for November (+199,000 above consensus +180,000, and +150,000 recorded in October).
The monthly growth of the number of jobs added in the US labour market has continued to tread lower for the second consecutive month and below the 12-month average monthly gain of 240,000. But its slowdown is not as severe as expected in November as the unemployment rate also dipped to 3.7% from 3.9% in October.
All in all, the US labour market is still indicating a soft-landing scenario for the US economy which in turn may force market participants to reduce their current lofty dovish expectations on the trajectory of Fed funds rate for 2024 with a total of four cuts at 100 basis points (bps) based on the current Fed funds interest rate futures data as calculated by the CME FedWatch Tool. Also, it is twice the amount of rate cuts projected in 2024 as indicated by the last Fed officials’ dot plot forecasts released in September’s FOMC meeting.
Considering the risk of a downward adjustment in expectations to the current heightened level of optimism on the amount of Fed funds rate cuts for 2024, it may unleash a minor rebound scenario in the US 10-year Treasury real yield that in turn puts further potential downside pressure for Spot Gold in the short-term via the conduit of “higher opportunity costs”.
US 10-year Treasury real yield has almost reached a major support zone
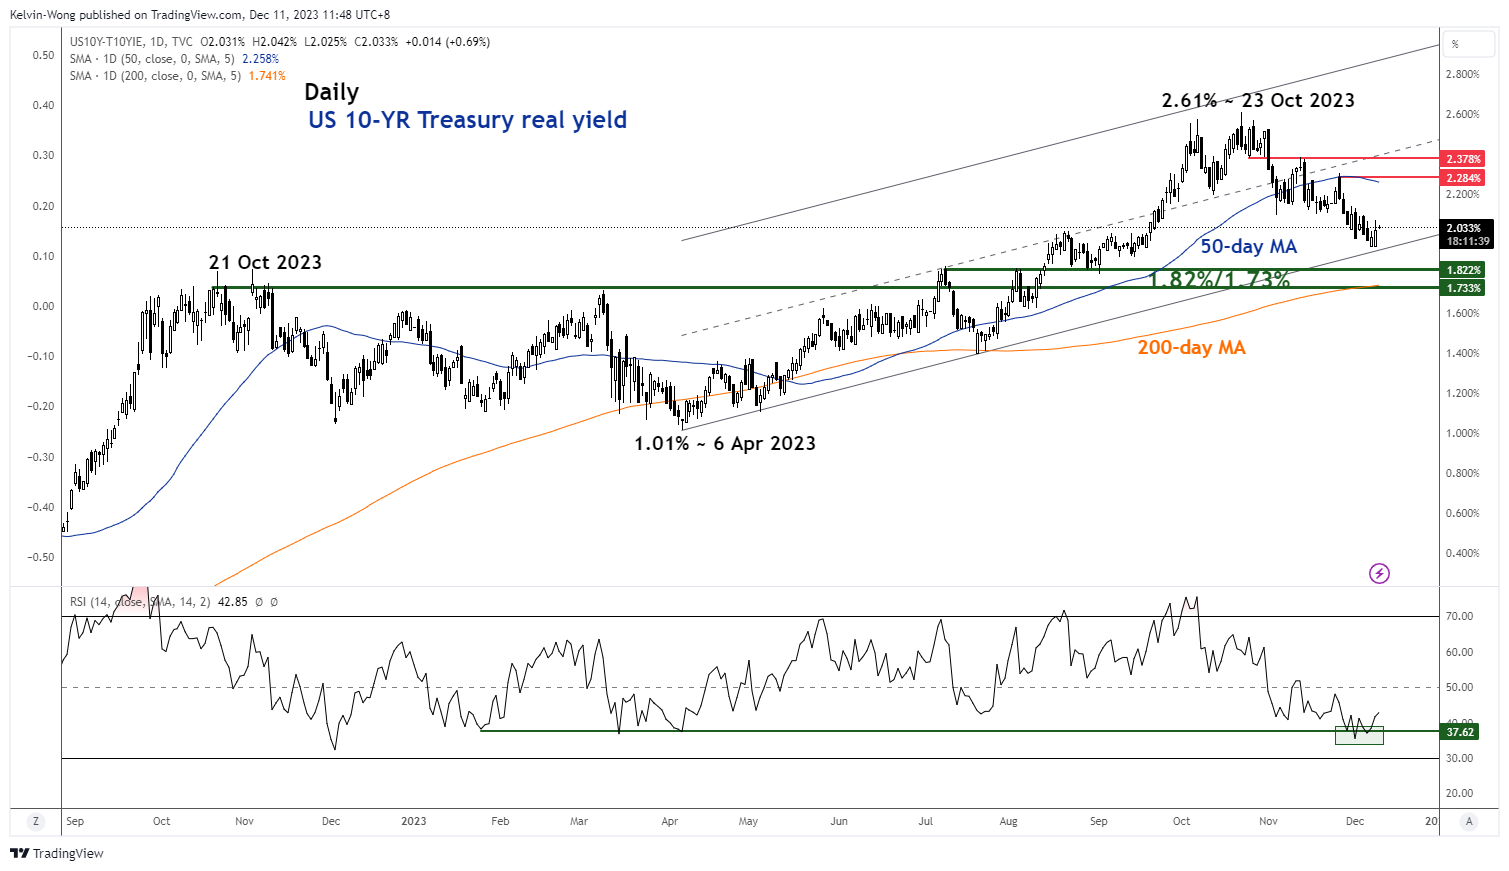
Fig 1: US 10-year Treasury real yield medium-term trend as of 11 Dec 2023 (Source: TradingView, click to enlarge chart)
The recent two-month decline of -68 bps from its 23 October 2023 high of 2.61% to last Thursday, 7 December low of 1.93% has reached the lower boundary of a medium-term ascending channel in place since 6 April 2023 and right above the major support zone of 1.82%/1.73%.
In addition, the daily RSI momentum indicator has tested and rebounded from a parallel support at the 37 level which suggests that the current medium-term downside momentum has abated.
2.28%/2.38% is the intermediate resistance zone (also the 50-day moving average) to watch on the US 10-year Treasury real yield.
Gold is on potential track to retest its 200-day moving average
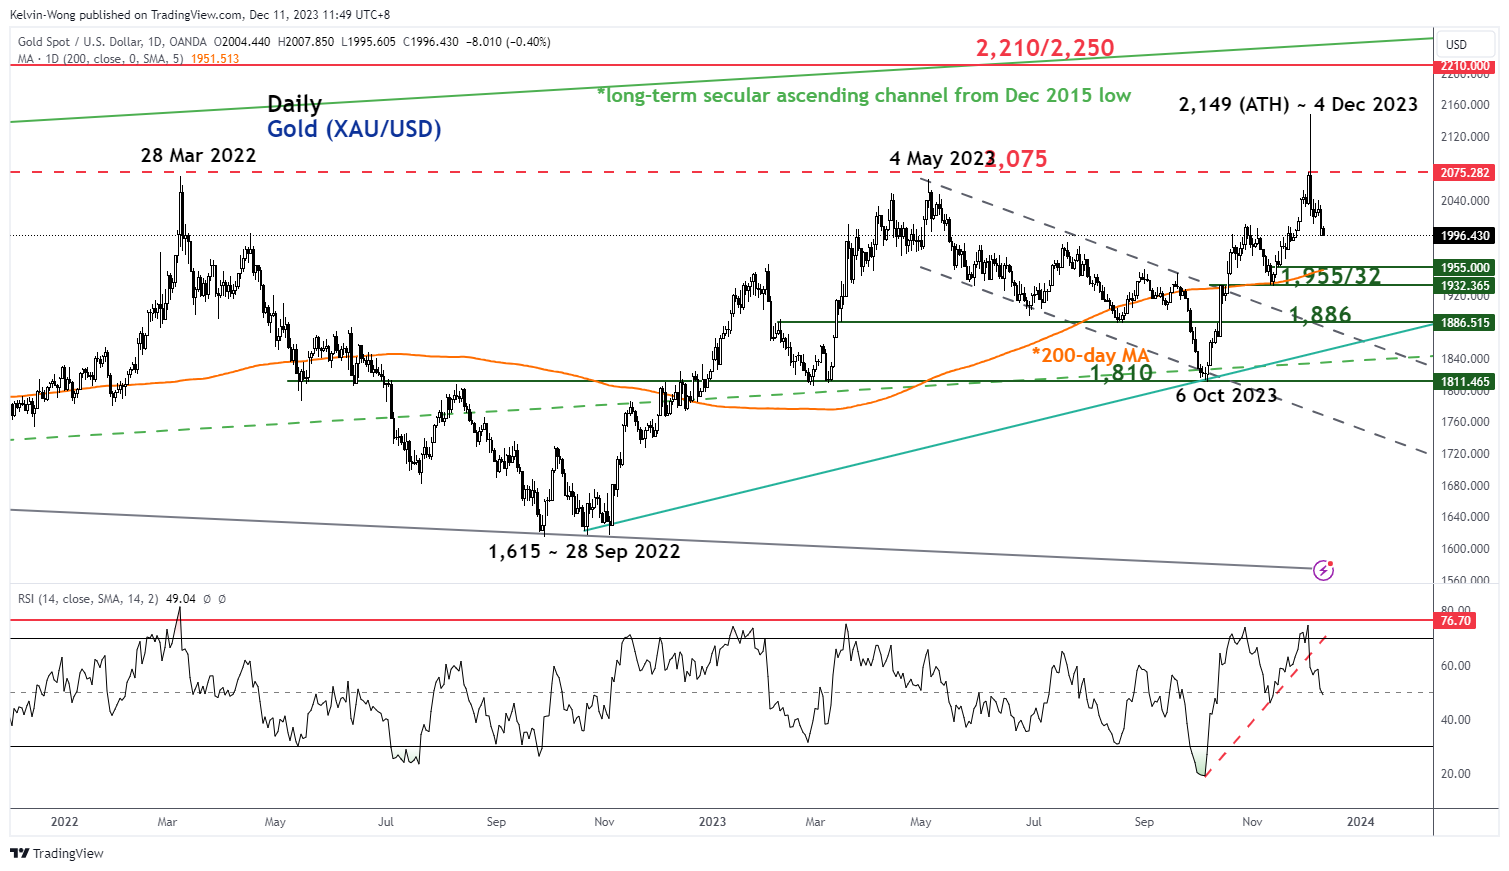
Fig 2: Spot Gold (XAU/USD) medium-term trend as of 11 Dec 2023 (Source: TradingView, click to enlarge chart)
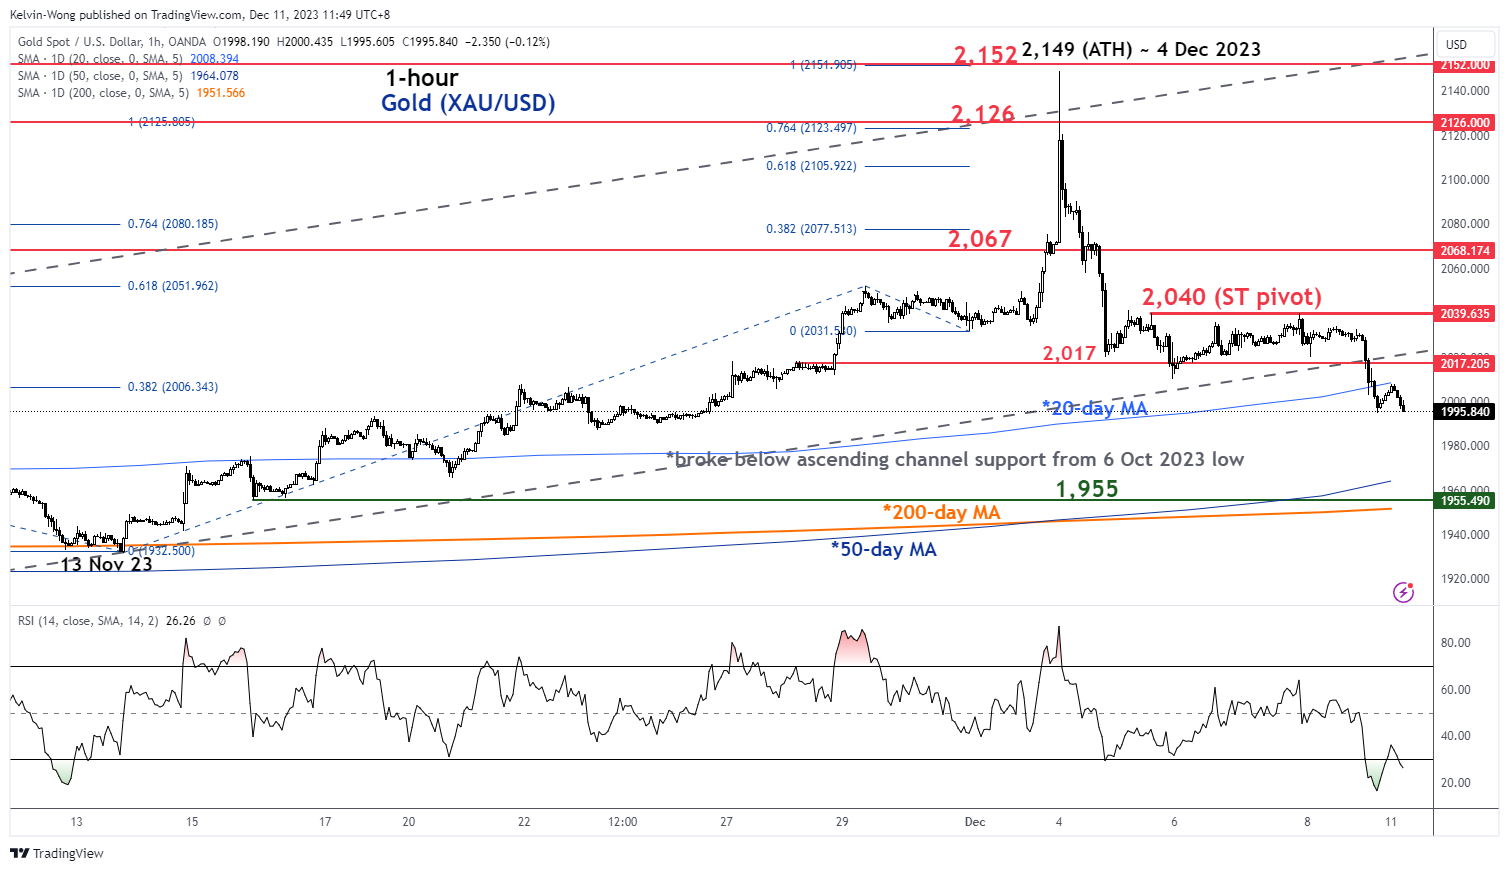
Fig 3: Spot Gold (XAU/USD) minor short-term trend as of 11 Dec 2023 (Source: TradingView, click to enlarge chart)
The price actions of spot Gold (XAU/USD) have broken below its 20-day moving average and the ascending channel support from its 6 October 2023 low of US$1,810 suggests the minor corrective decline from last Monday, 4 December all-time high of US$2,149 is likely to extend within its medium-term uptrend phase.
In addition, the hourly RSI momentum indicator has not flashed any bullish divergence condition at its oversold region after last Friday’s slide in price actions. These observations suggest that short-term bearish momentum is likely to be intact.
If the US$2,040 key short-term pivotal resistance is not surpassed, Spot Gold (XAU/USD) may see its medium-term support coming in at US$1,955 (confluences closely with the 50 and 200-day moving averages).
However, a clearance above US$2,040 may put the bulls back in control with the next intermediate resistance to watch at US2,067 followed by US2,126 next.
Technical Outlook and Review
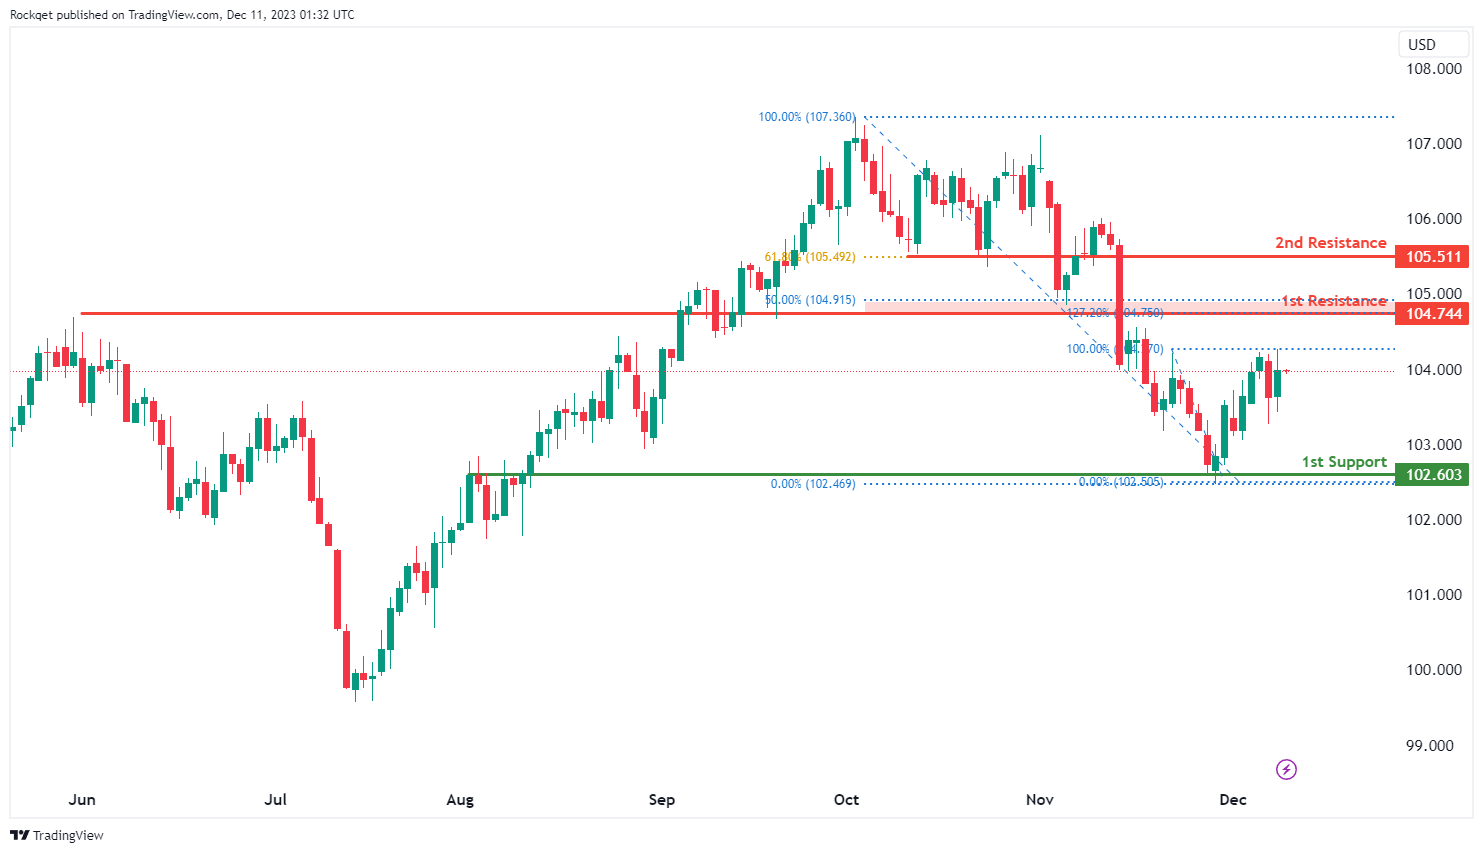
DXY:
The DXY chart currently exhibits a bearish overall momentum, and there’s potential for a bearish reaction off the 1st resistance level, suggesting a possible downward movement towards the 1st support.
The 1st support at 102.60 is categorized as an overlap support, which implies that it could be a significant level where buying interest may emerge, potentially providing some support for the DXY.
On the resistance side, the 1st resistance at 104.74 is noted as a pullback resistance, and it coincides with the 50% Fibonacci Retracement level. This indicates that it’s a substantial barrier where selling interest could intensify, potentially leading to a bearish reaction.
Additionally, the 2nd resistance at 105.51 is categorized as a pullback resistance and coincides with the 61.80% Fibonacci Retracement level, further reinforcing its significance as a level where selling pressure may increase.
EUR/USD:
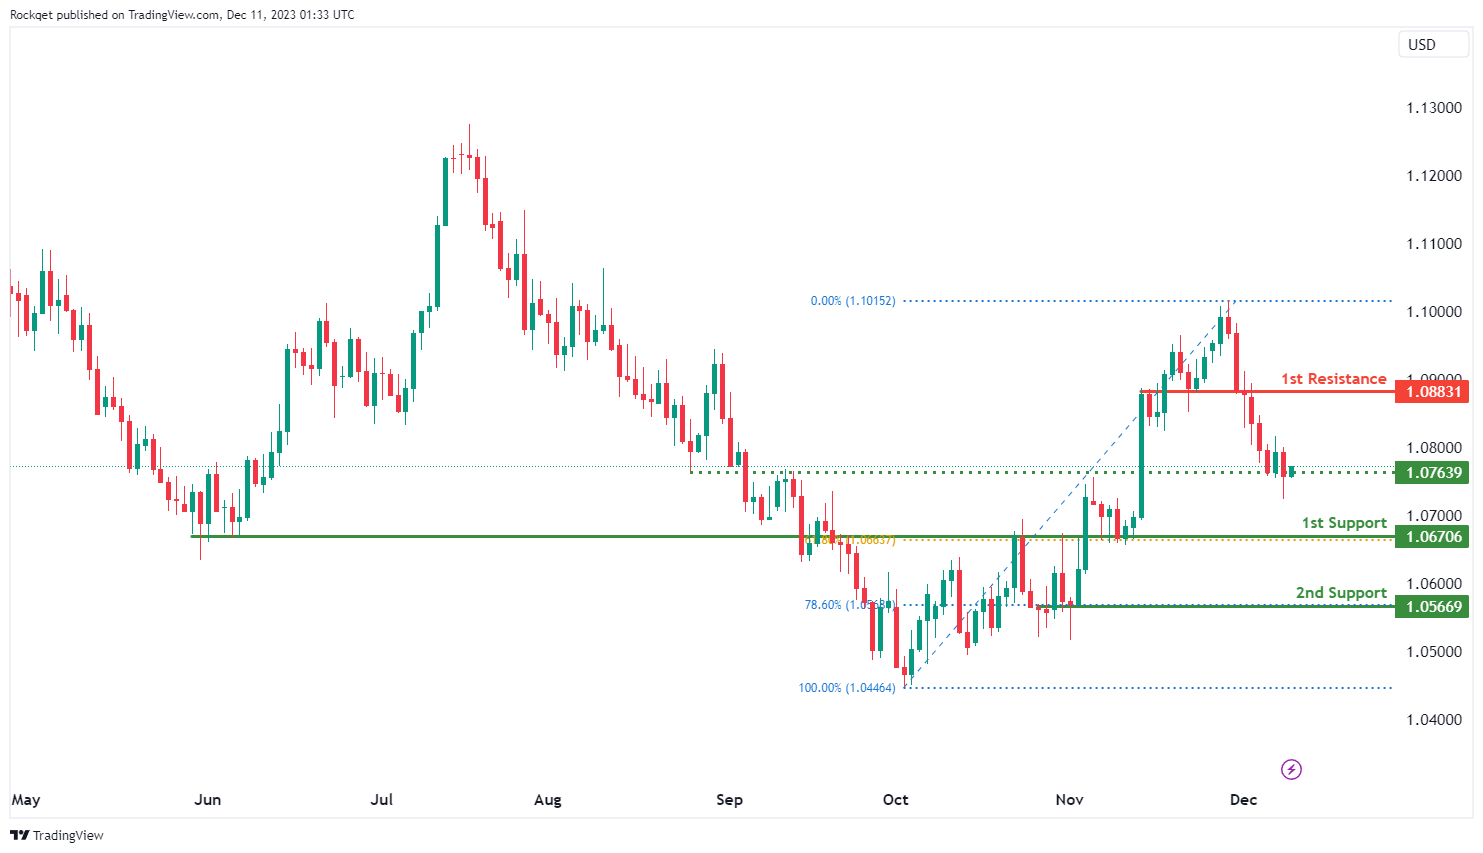
The EUR/USD chart currently exhibits a bullish overall momentum, and there’s potential for a bullish bounce off the 1st support level, indicating a possible upward movement towards the 1st resistance.
The 1st support at 1.0670 is categorized as a pullback support and coincides with the 61.80% Fibonacci Retracement level. This level is significant as it suggests a potential area where buying interest may emerge, providing support for the EUR/USD pair.
Further down, the 2nd support at 1.0566 is identified as a support level and coincides with the 78.60% Fibonacci Retracement level, reinforcing its significance as a potential area where buyers might become active.
On the resistance side, the 1st resistance at 1.0883 is noted as a pullback resistance. This implies that it’s a substantial barrier where selling interest could intensify, potentially limiting the upward movements of EUR/USD.
EUR/JPY:
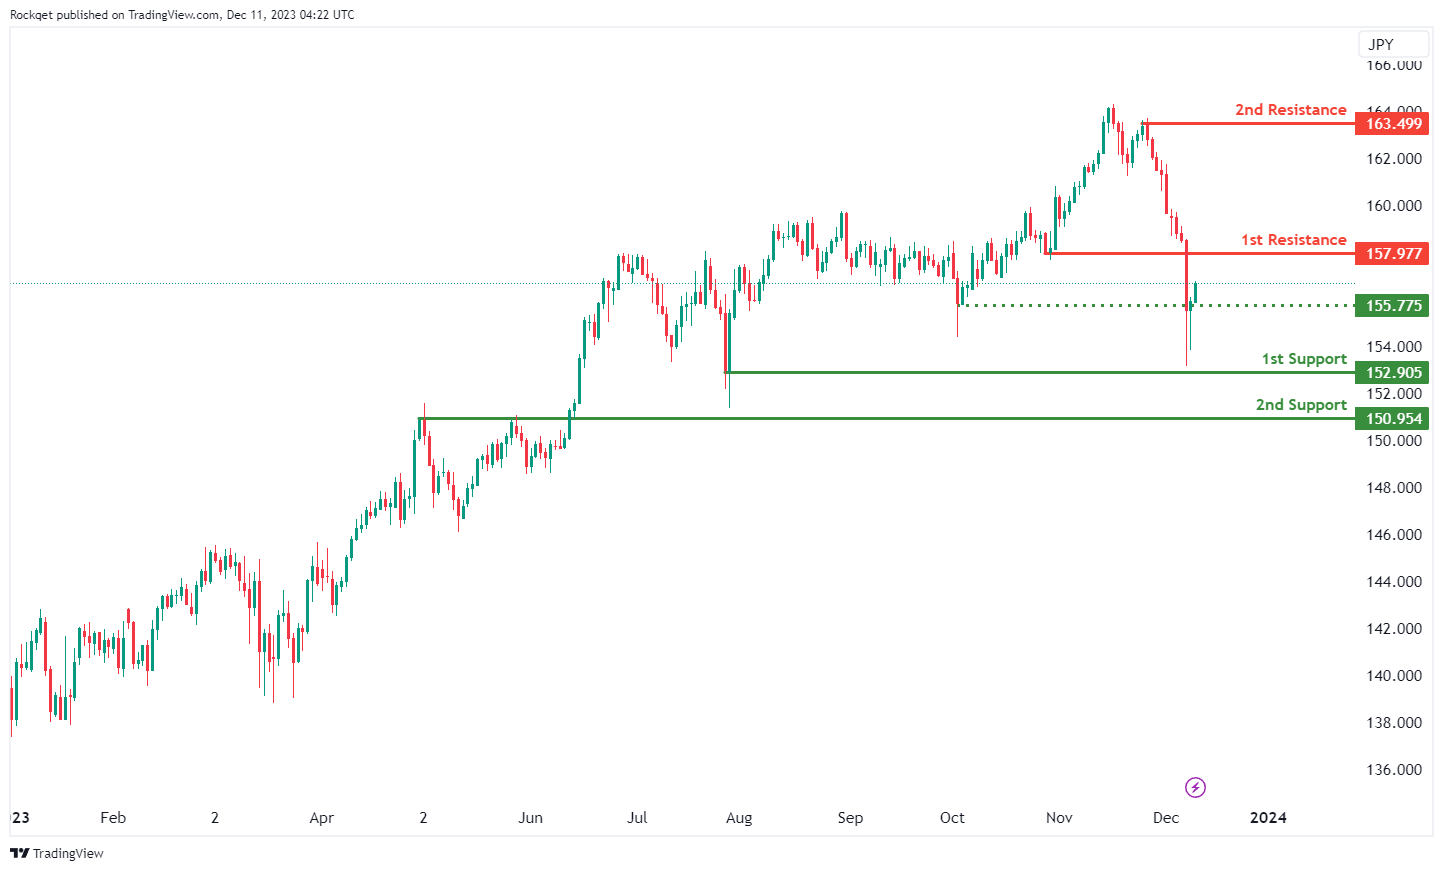
The EUR/JPY chart currently has bullish overall momentum, suggesting a potential bullish continuation towards the first resistance.
1st Support at 152.91: This level is identified as a pullback support, indicating a potential area where buying interest might emerge. It serves as a support zone for potential price stabilization.
2nd Support at 150.95: The second support is described as a multi-swing low support, suggesting historical significance as a level where the price has found support. This support level adds strength to the potential bullish movement.
1st Resistance at 157.98: The first resistance is recognized as a pullback resistance, suggesting a level where selling interest might be observed, acting as a potential hurdle to further upward movement.
2nd Resistance at 163.50: The second resistance is noted as a pullback resistance, indicating a level where selling interest might be encountered, potentially acting as an additional barrier to the bullish trend.
EUR/GBP:
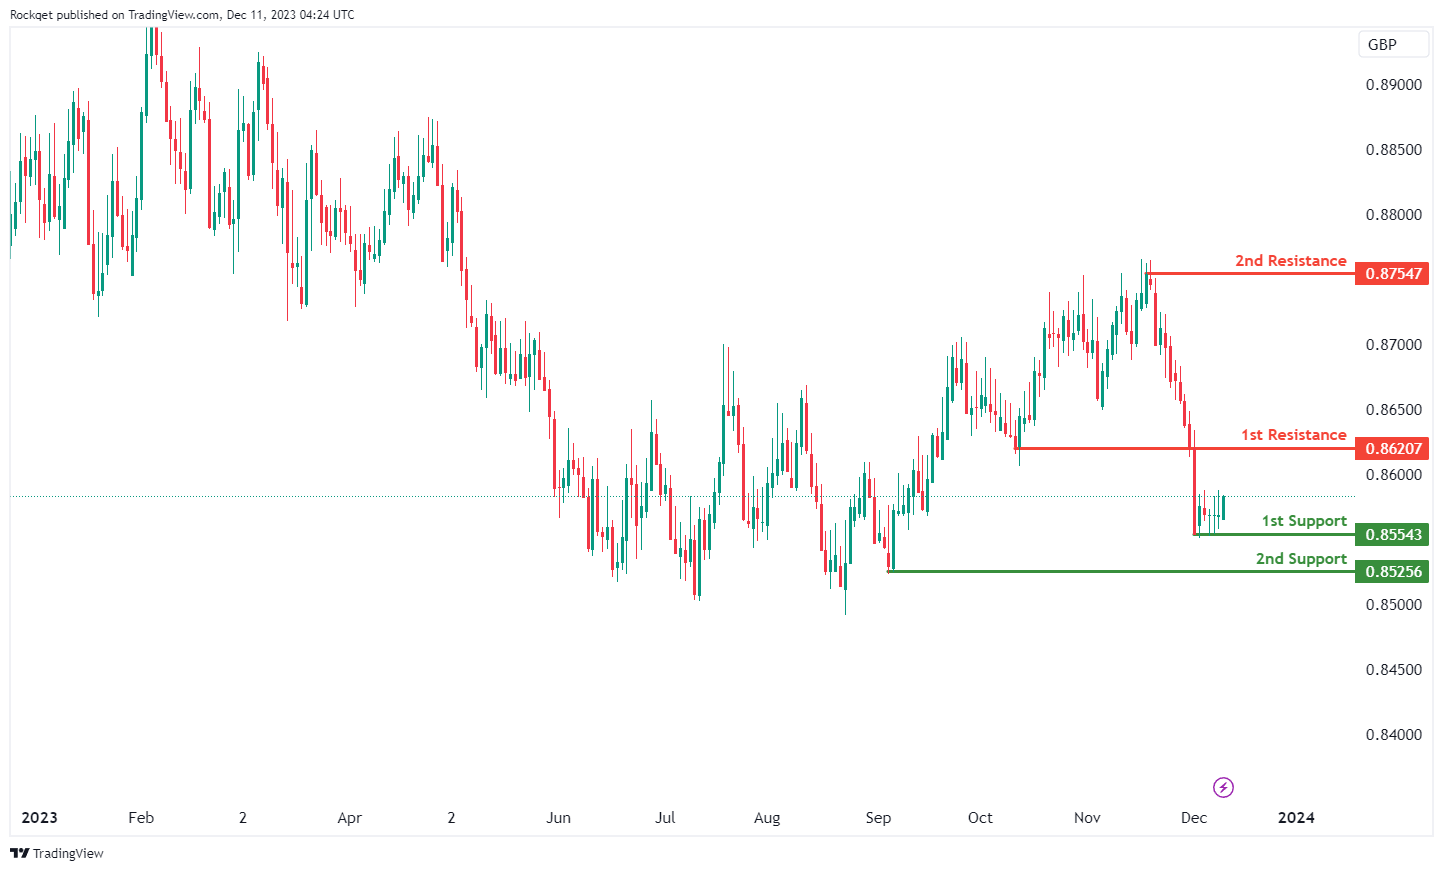
The EUR/GBP currency pair exhibits a bullish overall momentum, suggesting a potential bullish bounce off the first support towards the first resistance.
1st Support at 0.8554: This level is identified as a multi-swing low support, indicating historical significance as a level where the price has found support. It represents a potential area for buying interest.
2nd Support at 0.85226: The second support is described as a pullback support, suggesting a level where buyers might show interest. This support level adds strength to the potential bullish movement.
1st Resistance at 0.8621:The first resistance is recognized as a pullback resistance, suggesting a level where selling interest might be observed, potentially acting as a hurdle to further upward movement.
2nd Resistance at 0.9755: The second resistance is noted as a multi-swing high resistance, indicating historical points where the price faced obstacles and potential reversals. This level may act as a barrier to further bullish movement.
GBP/USD:
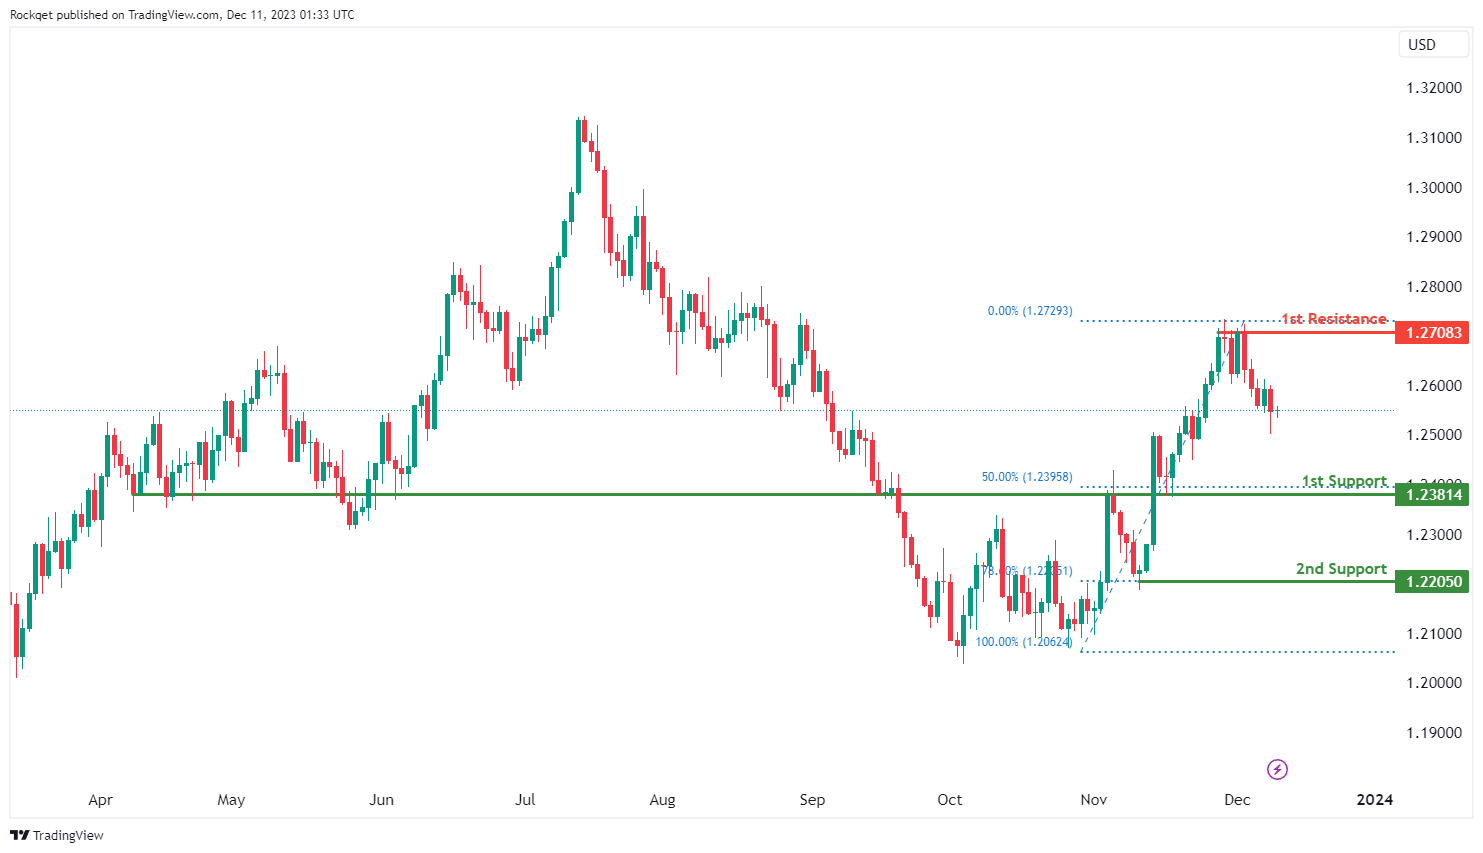
The GBP/USD chart currently exhibits a bullish overall momentum, and there’s potential for a bullish bounce off the 1st support level, indicating a possible upward movement towards the 1st resistance.
The 1st support at 1.2381 is categorized as an overlap support and coincides with the 50% Fibonacci Retracement level. This level is significant as it suggests a potential area where buying interest may emerge, providing support for the GBP/USD pair.
Further down, the 2nd support at 1.2205 is identified as another support level and coincides with the 78.60% Fibonacci Retracement level, reinforcing its significance as a potential area where buyers might become active.
On the resistance side, the 1st resistance at 1.2708 is noted as a multi-swing high resistance. This implies that it’s a substantial barrier where selling interest could intensify, potentially limiting the upward movements of GBP/USD.
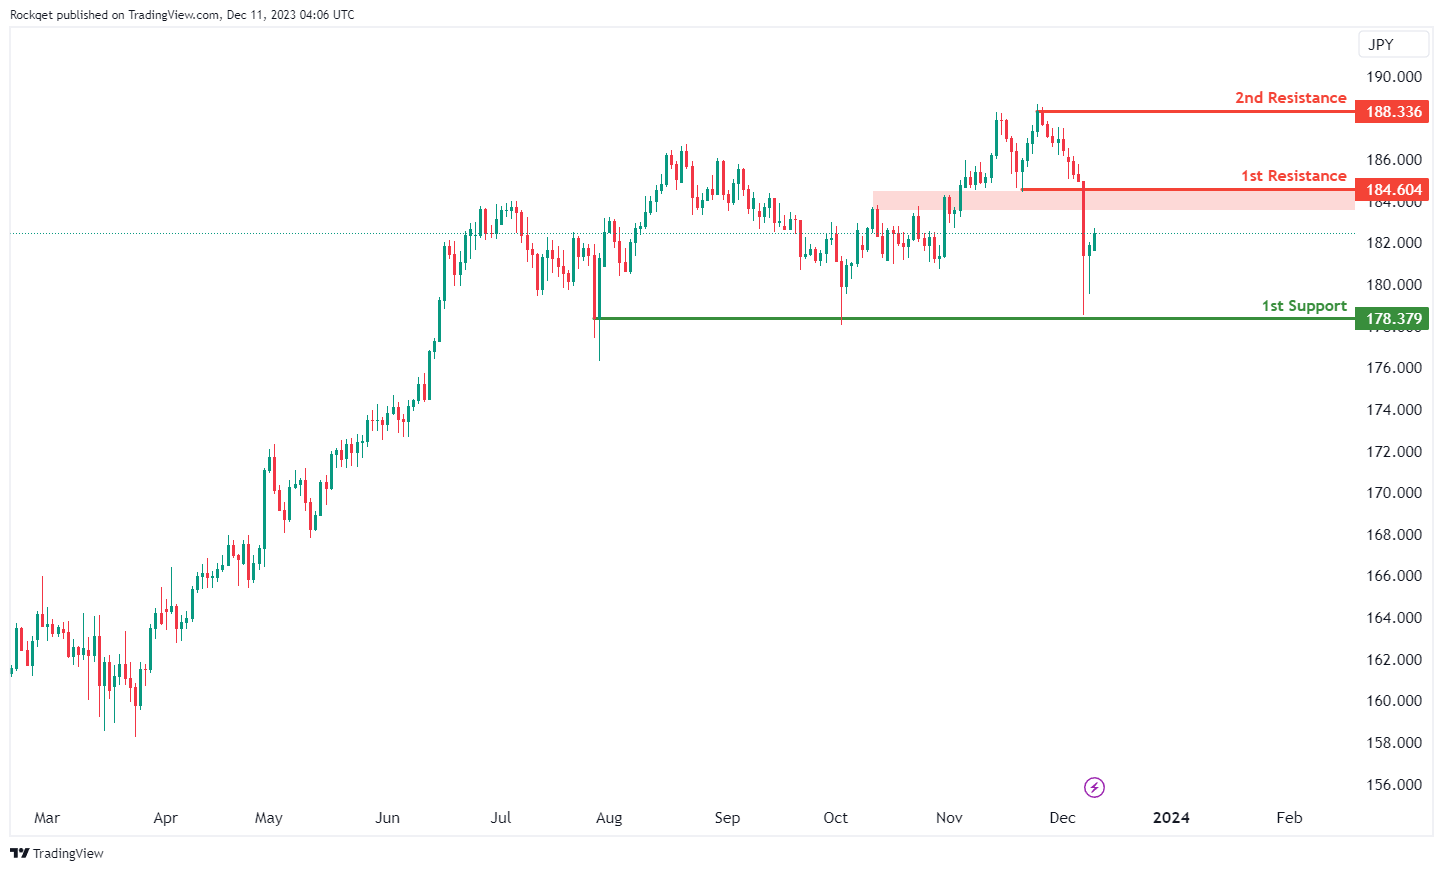
GBP/JPY:
The GBP/JPY currency pair is currently experiencing a bullish overall momentum, suggesting a potential bullish bounce off the first support towards the first resistance.
1st Support at 178.38: This level is identified as a multi-swing low support, indicating historical significance as a level where the price has found support. It represents a potential area for buying interest.
1st Resistance at 184.60: The first resistance is recognized as a pullback resistance, suggesting a level where selling interest might be observed, potentially acting as a hurdle to further upward movement.
2nd Resistance at 188.34: The second resistance is noted as a swing high resistance, indicating a level where historical selling pressure and potential reversals may occur.
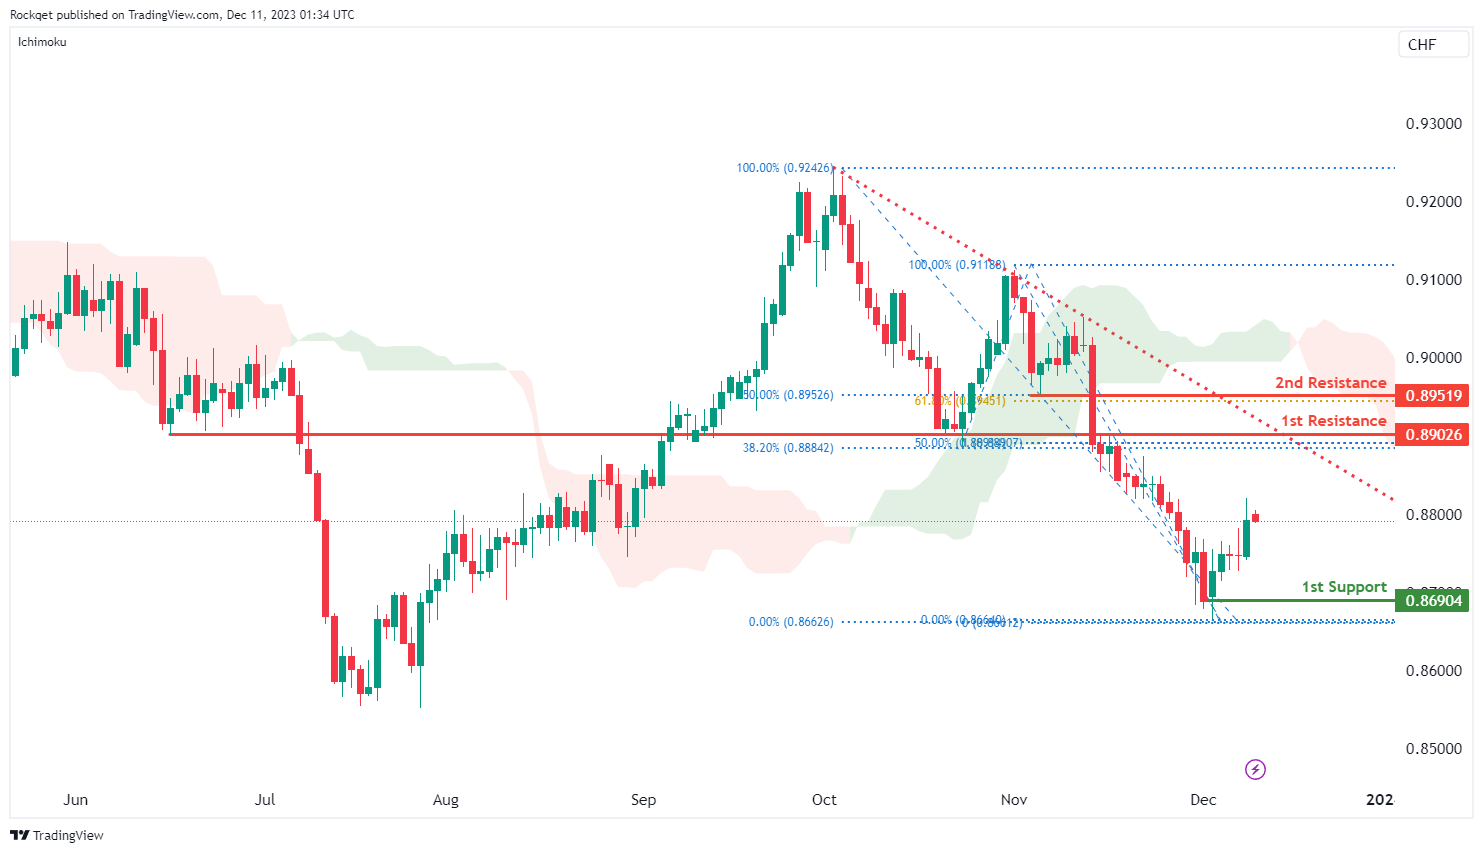
USD/CHF:
The USD/CHF chart currently has a bearish overall momentum, with price trading below a major descending trend line, indicating a bearish trend is in place. In the short term, there’s potential for a temporary rise towards the 1st resistance level before a reversal and a drop towards the 1st support.
The 1st support at 0.8690 is categorized as a swing low support. This level is significant as it suggests a potential area where buying interest may emerge, providing temporary support for USD/CHF.
On the resistance side, the 1st resistance at 0.8762 is identified as an overlap resistance and coincides with the 50% and 38.20% Fibonacci Retracement levels, indicating a potential confluence of Fibonacci levels. This level is likely to act as a substantial barrier where selling interest could intensify, potentially triggering a bearish reversal.
Further up, the 2nd resistance at 0.8951 is categorized as a pullback resistance and coincides with the 61.80% and 50% Fibonacci Retracement levels, suggesting another level where selling pressure may increase.
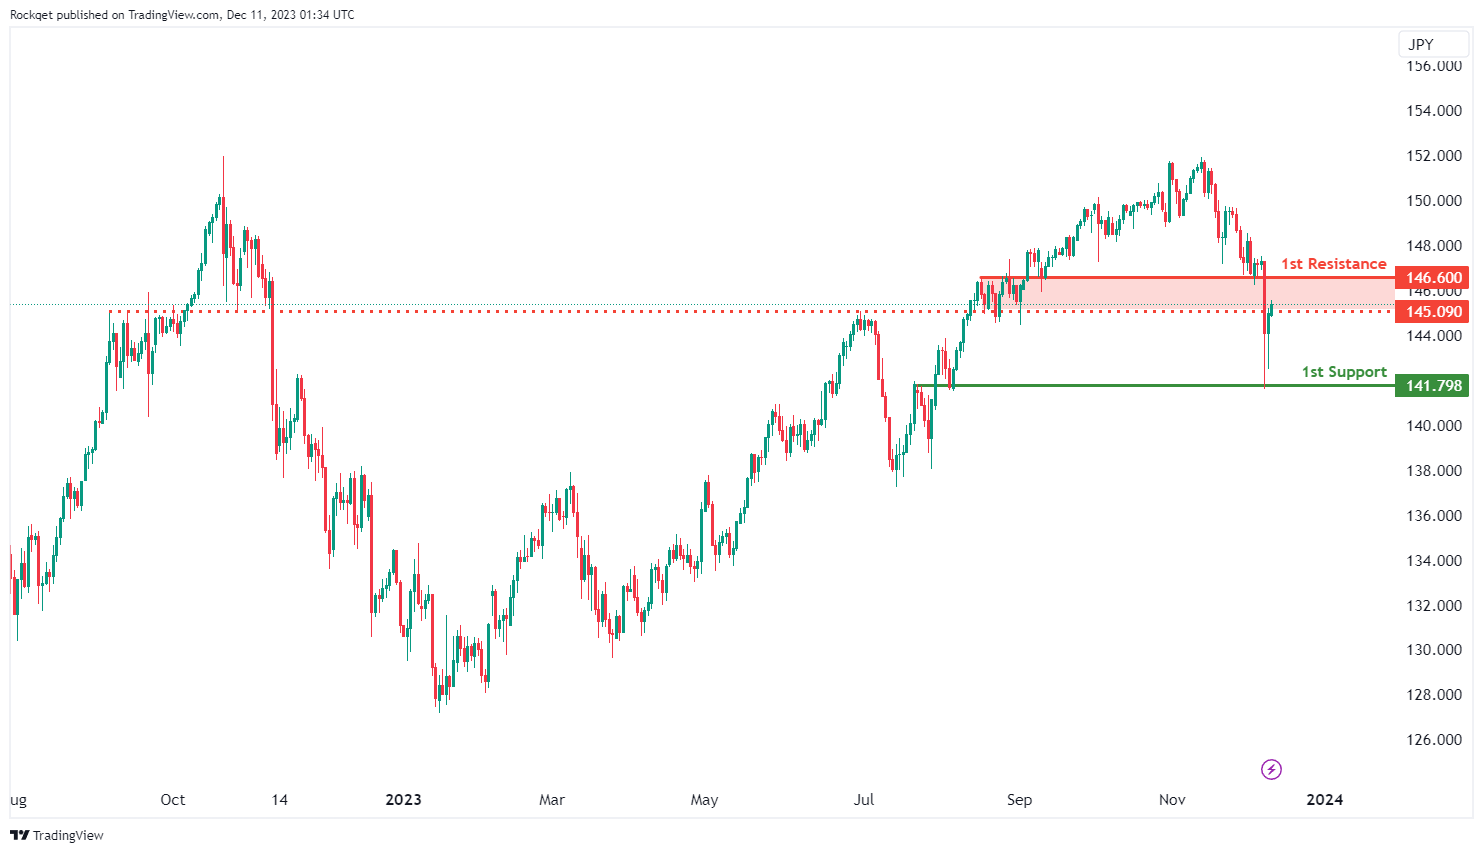
USD/JPY:
The USD/JPY chart currently has a bullish overall momentum. However, there’s potential for a bearish reaction off the 1st resistance level, followed by a drop towards the 1st support.
The 1st support at 141.79 is categorized as an overlap support. This level is significant as it suggests a potential area where buying interest may emerge, providing support for USD/JPY.
On the resistance side, the 1st resistance at 146.60 is identified as a pullback resistance. This level is likely to act as a barrier where selling interest could intensify, potentially leading to a bearish reaction.
Intermediate resistance at 145.09 is another level to watch, as it also acts as pullback resistance and could influence the price movement.
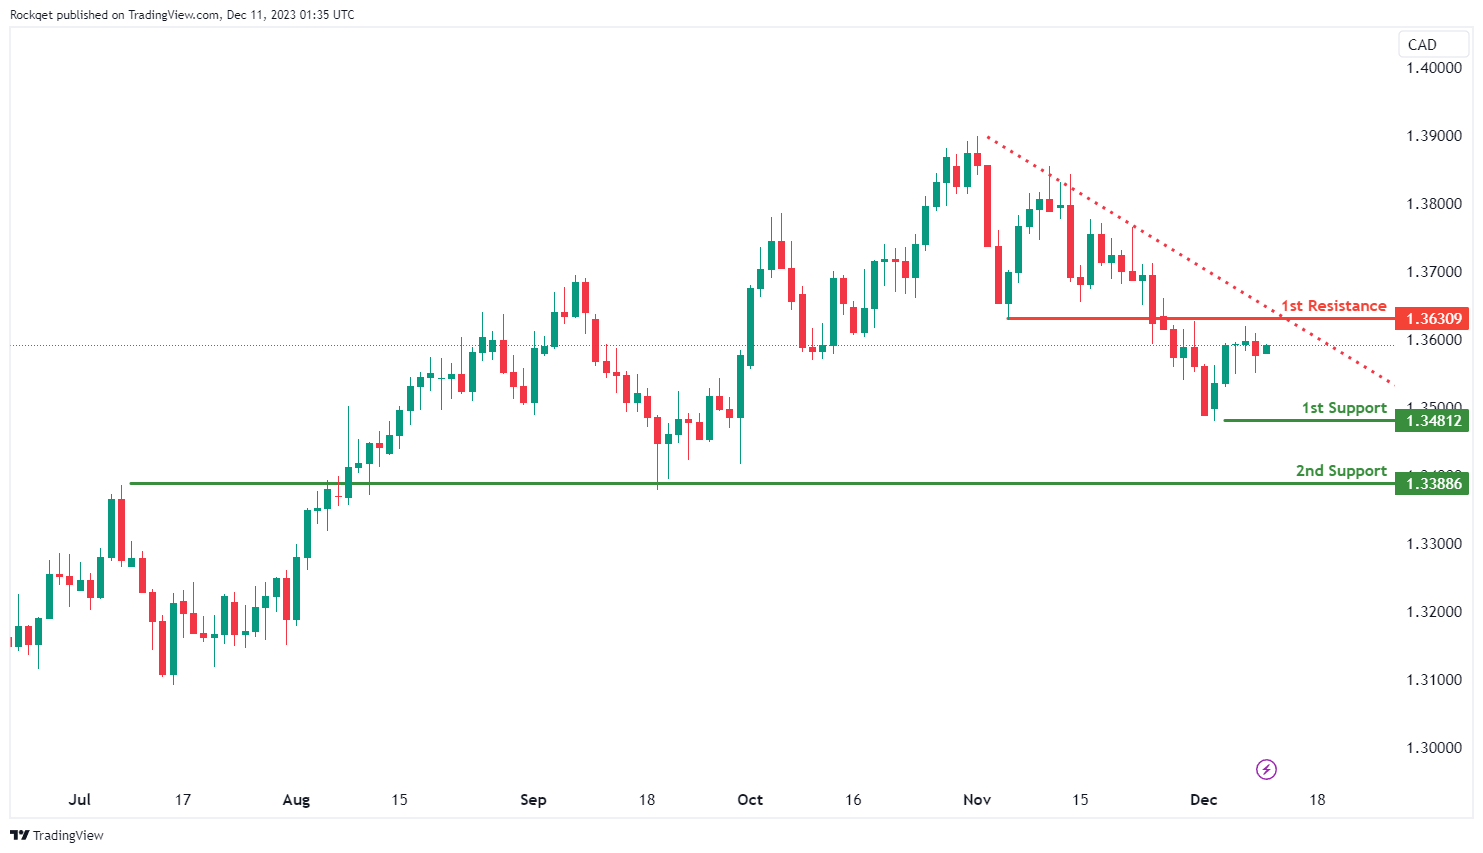
USD/CAD:
The USD/CAD chart currently exhibits a bearish overall momentum, and there’s a potential scenario where price could make a bearish reaction off the 1st resistance level and drop to the 1st support.
The 1st support at 1.3481 is identified as a swing low support, suggesting that it could be a significant level where buying interest may emerge, potentially providing support for the USD/CAD pair.
The 2nd support at 1.3388 is categorized as an overlap support, further reinforcing its significance as a potential level where buyers might become active.
On the resistance side, the 1st resistance at 1.3630 is noted as an overlap resistance. This level is likely to act as a substantial barrier where selling interest may intensify, potentially leading to a bearish reversal.
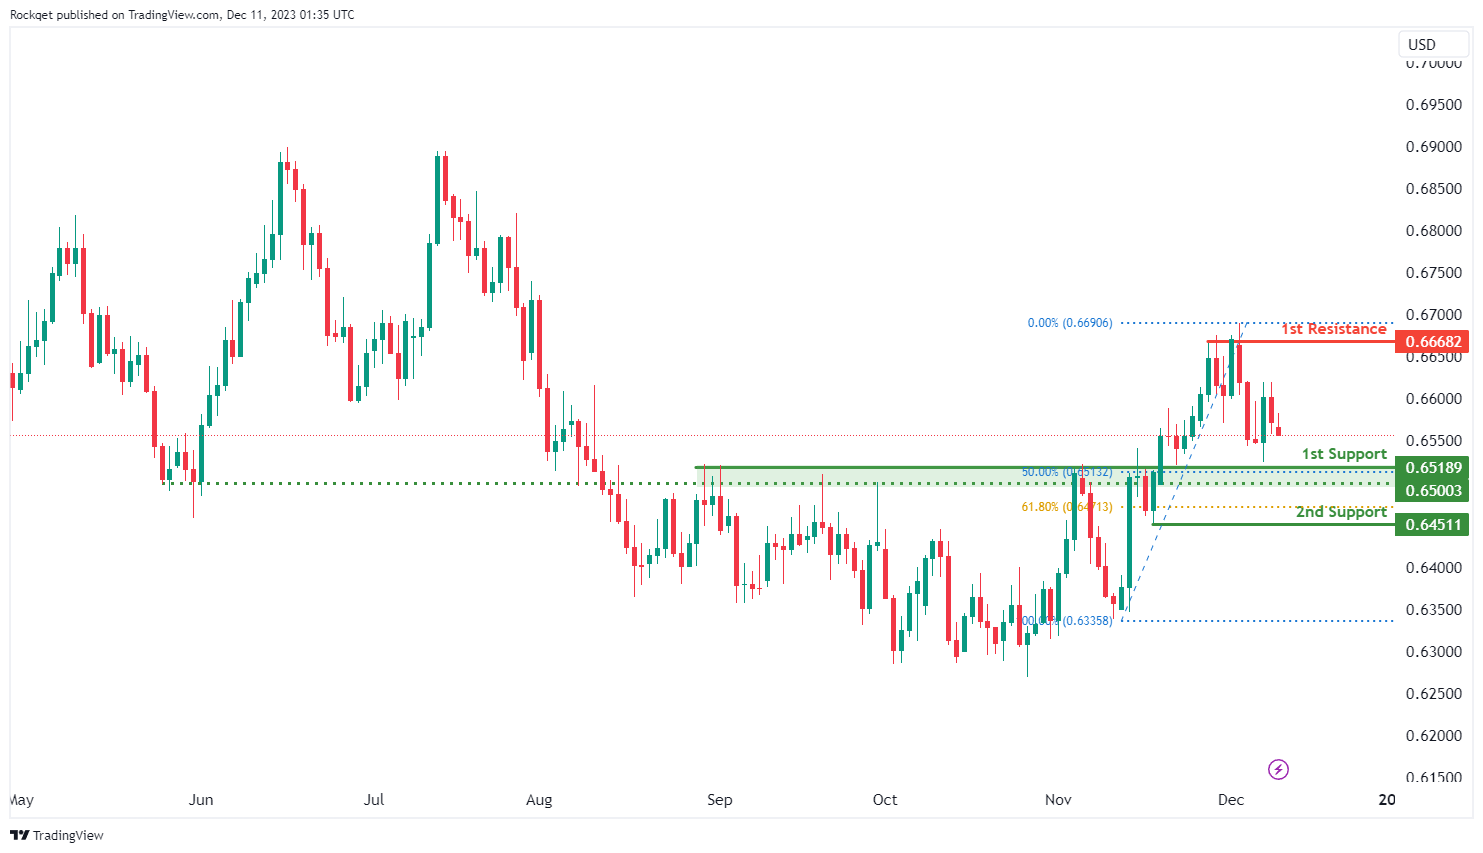
AUD/USD:
The AUD/USD chart currently shows a bullish overall momentum, and there’s a potential scenario where price could make a bullish bounce off the 1st support level and head towards the 1st resistance.
The 1st support at 0.6518 is identified as an overlap support and coincides with the 50% Fibonacci Retracement level. This level is significant and suggests it could act as a substantial area where buying interest may emerge, providing support for the AUD/USD pair.
The 2nd support at 0.6451 is noted as a 61.80% Fibonacci Retracement level, reinforcing its significance as a potential level where buyers might become active.
On the resistance side, the 1st resistance at 0.6668 is categorized as multi-swing high resistance. This level is likely to act as a substantial barrier where selling interest may intensify, potentially limiting upward movements.
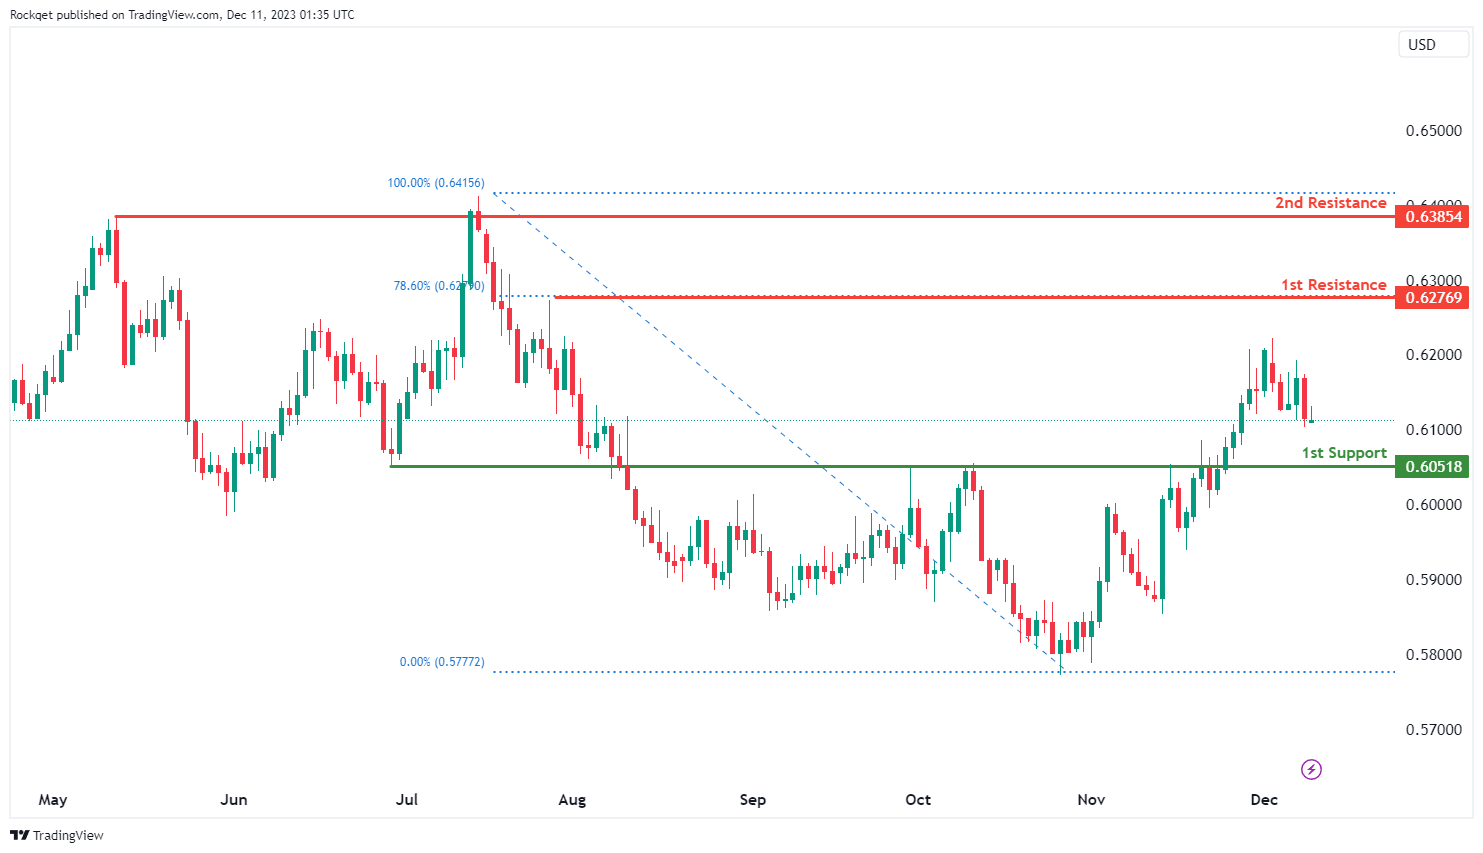
NZD/USD
The NZD/USD chart currently exhibits a bullish overall momentum, and there’s a potential scenario where price could make a bullish bounce off the 1st support level and head towards the 1st resistance.
The 1st support at 0.6053 is categorized as pullback support, indicating it as a significant level where buying interest may emerge, potentially providing support for NZD/USD.
On the resistance side, the 1st resistance at 0.6276 is identified as an overlap resistance and coincides with the 78.60% Fibonacci Retracement level, suggesting a potential confluence of technical factors that could act as a substantial barrier where selling interest may intensify.
Further up, the 2nd resistance at 0.6389 is categorized as a swing high resistance.
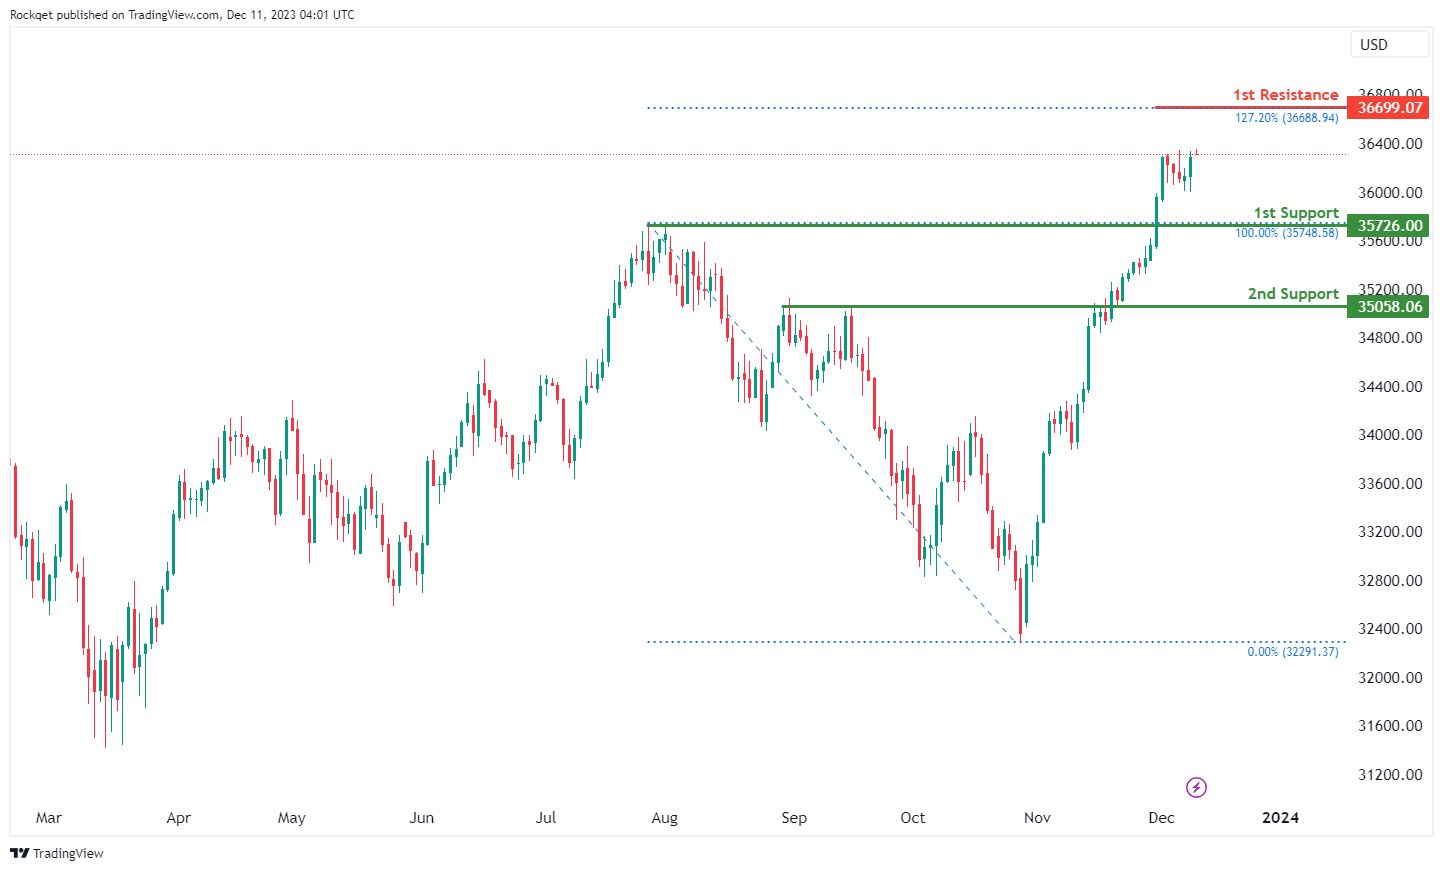
DJ30:
The DJ30 shows a bearish overall momentum, indicating a prevailing downward trend. However, there is a short-term potential for a rise towards the first resistance before a reversal and a subsequent drop towards the first support.
1st Support at 35726.00: This level is identified as a pullback support, indicating a potential area where buying interest might emerge, contributing to a short-term stabilization in the price.
2nd Support at 35058.06: The second support is described as an overlap support, suggesting historical significance as a level where the price has found support in the past.
1st Resistance at 36699.07: The first resistance is noted as being at the 127.20% Fibonacci Extension level, signifying a potential barrier where the price might face selling pressure or a reversal within its bearish trend.
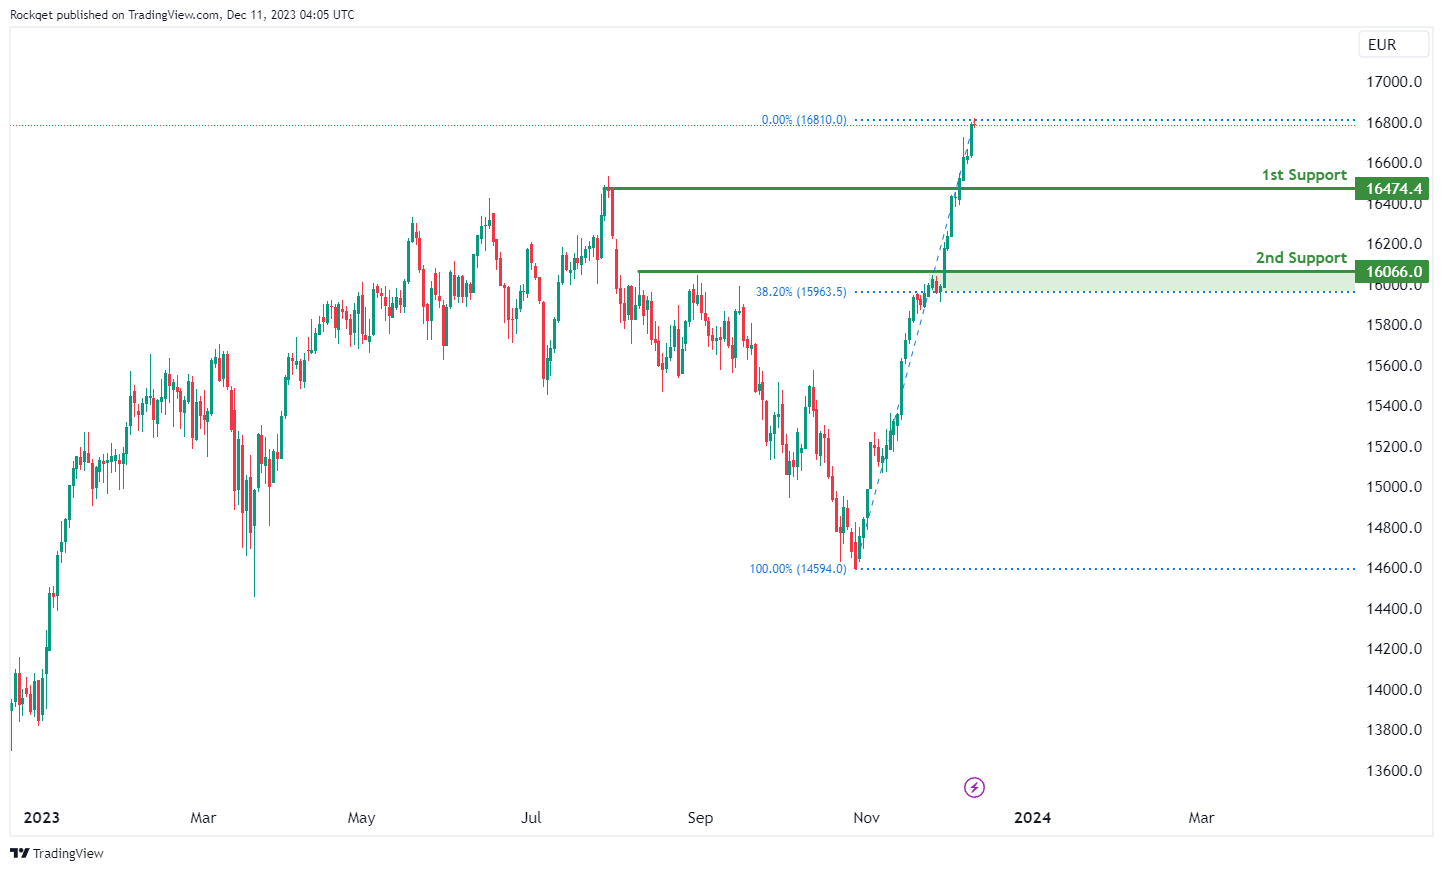
GER40:
The GER40 indicates a bullish overall momentum, suggesting a potential bullish continuation towards the first resistance.
1st Support at 16474.4: This level is identified as a pullback support, indicating a potential area where buying interest might emerge. It serves as a support zone for potential price stabilization.
2nd Support at 16066.0: The second support is described as a pullback support, reinforcing the notion that buyers might show interest at this level, potentially leading to a stabilization in price.
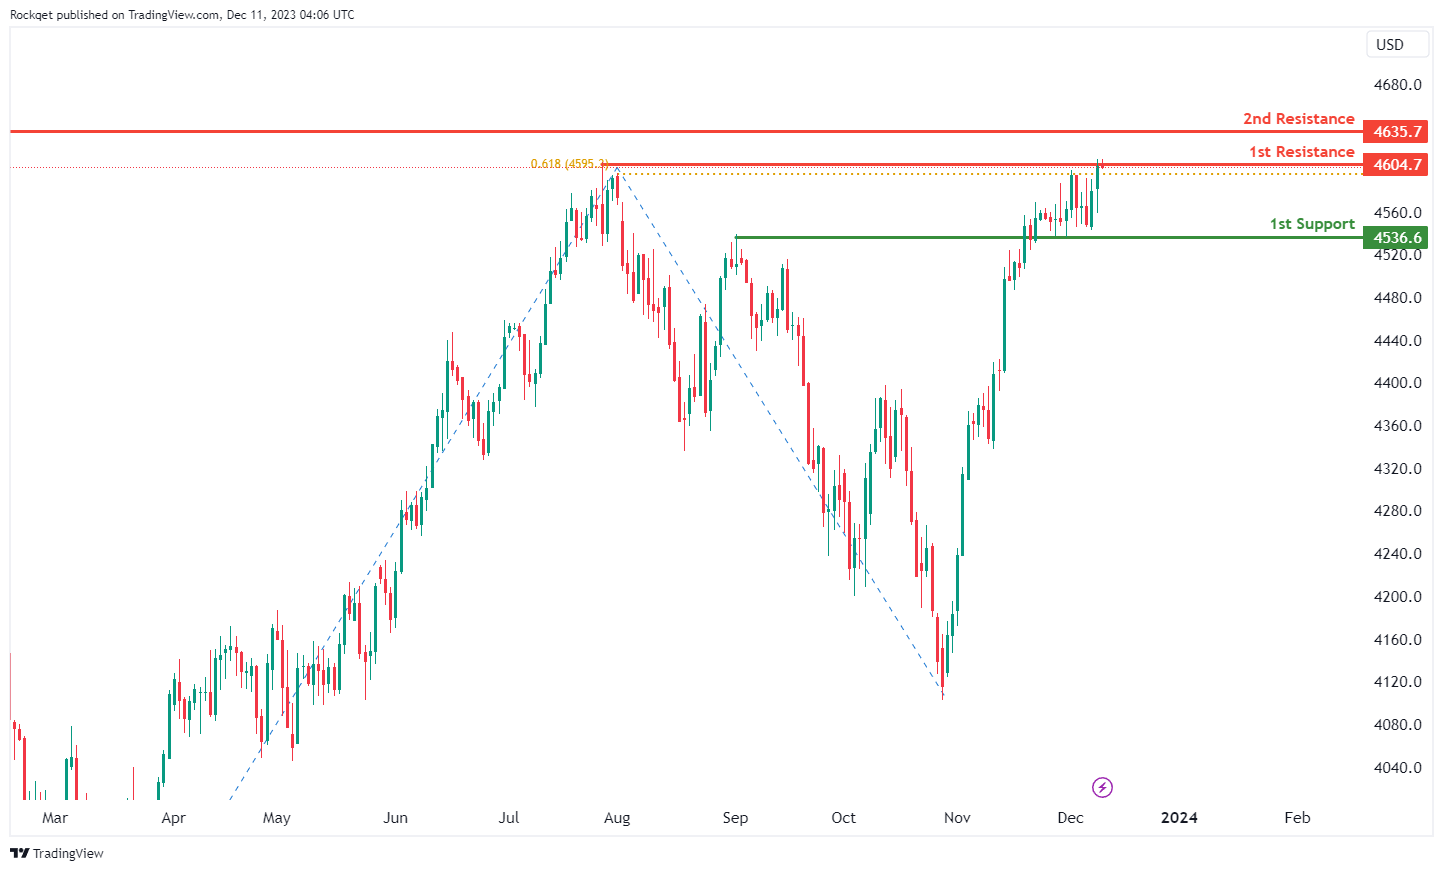
US500:
The chart of US500 indicates a bullish overall momentum, suggesting a potential bullish bounce off the first support and a subsequent movement towards the first resistance.
1st Support at 4536.6: This level is identified as an overlap support, indicating historical significance as a level where the price has found support. The overlapping support adds to its potential strength.
2nd Support at 4383.8: The second support is described as a pullback support, suggesting a level where buyers might show interest. This level contributes to the support zone, potentially stabilizing the price
1st Resistance at 4604.7: The first resistance is recognized as a multi-swing high resistance, signifying a historical point where the price has faced obstacles and potential reversals. Additionally, it aligns with the -61.8% Fibonacci Projection, adding further significance to this resistance level.
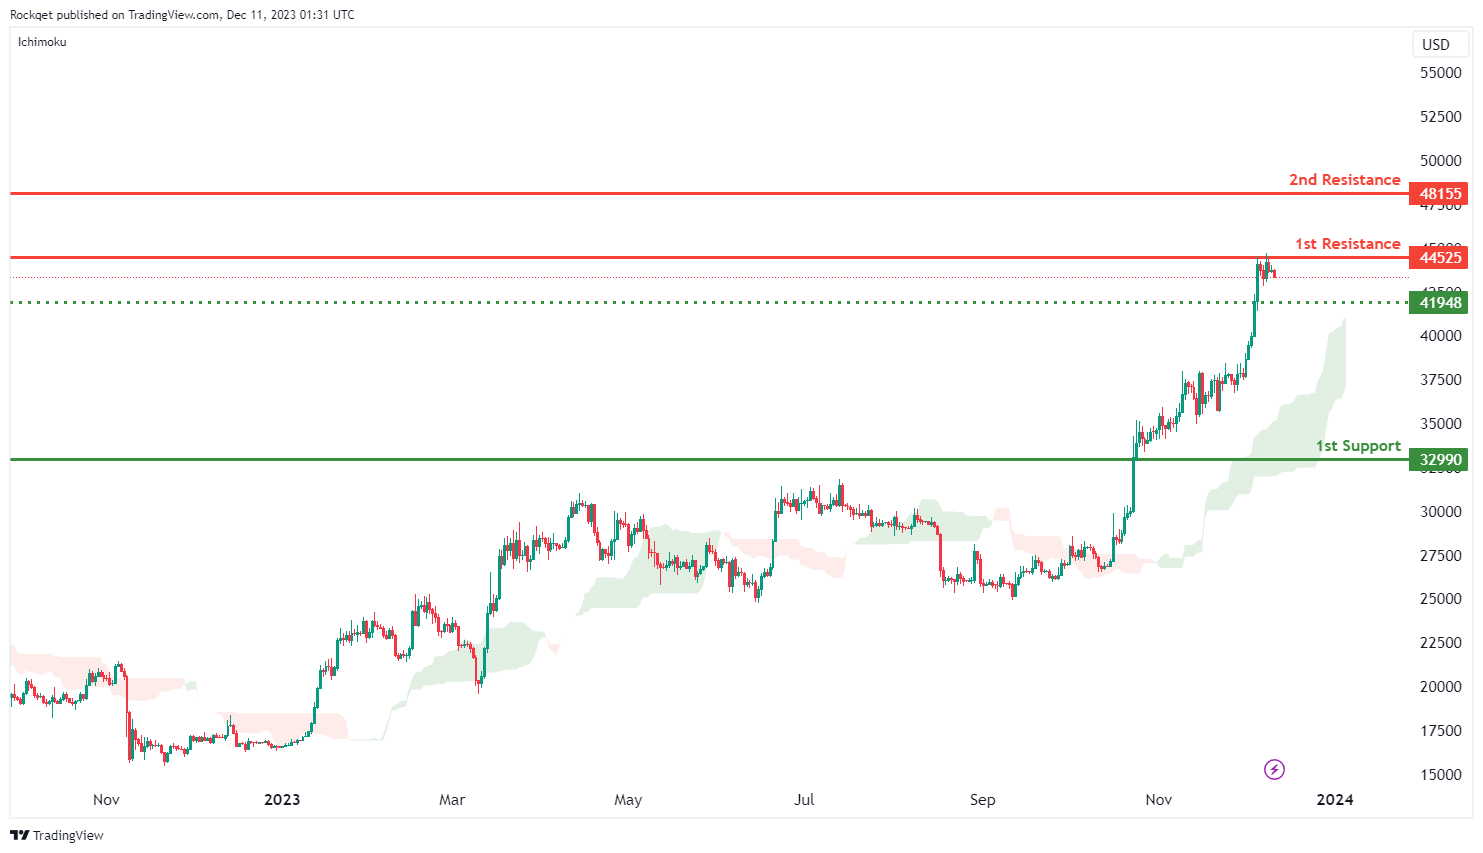
BTC/USD:
The BTC/USD chart currently has a bullish overall momentum, and there’s a potential scenario where price could make a bullish bounce off the 1st support level and head towards the 1st resistance.
The 1st support at 32,990 is identified as a pullback support, suggesting that it could be a significant level where buying interest may emerge, potentially providing support for the BTC/USD pair.
The intermediate support at 41,948 is also categorized as a pullback support, further reinforcing its significance as a potential level where buyers might become active.
On the resistance side, the 1st resistance at 48,155 is noted as a multi-swing high resistance. This level is likely to act as a substantial barrier where selling interest may intensify, potentially triggering a bearish reversal.
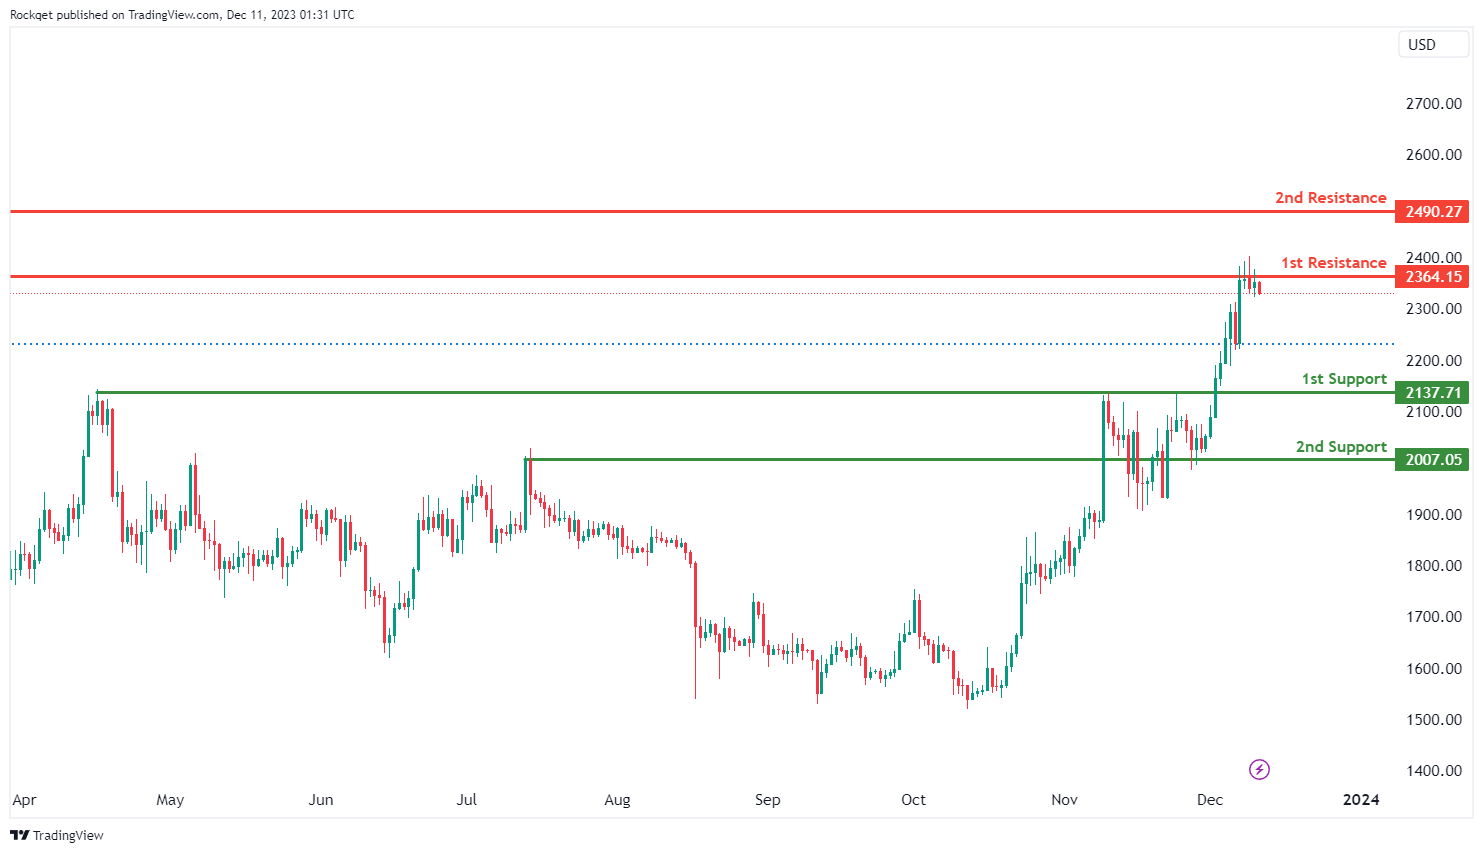
ETH/USD:
The ETH/USD chart currently has a bullish overall momentum, and there’s a potential scenario where price could make a bullish bounce off the 1st support level and head towards the 1st resistance.
The 1st support at 2,137.71 is identified as a pullback support, suggesting that it could be a significant level where buying interest may emerge, potentially providing support for the ETH/USD pair.
The 2nd support at 2,007.05 is categorized as an overlap support, further reinforcing its significance as a potential level where buyers might become active.
On the resistance side, the 1st resistance at 2,364.15 is noted as a multi-swing high resistance. This level is likely to act as a substantial barrier where selling interest may intensify, potentially triggering a bearish reversal.
The 2nd resistance at 2,490.27 is categorized as a pullback resistance, indicating another level where selling pressure may increase.
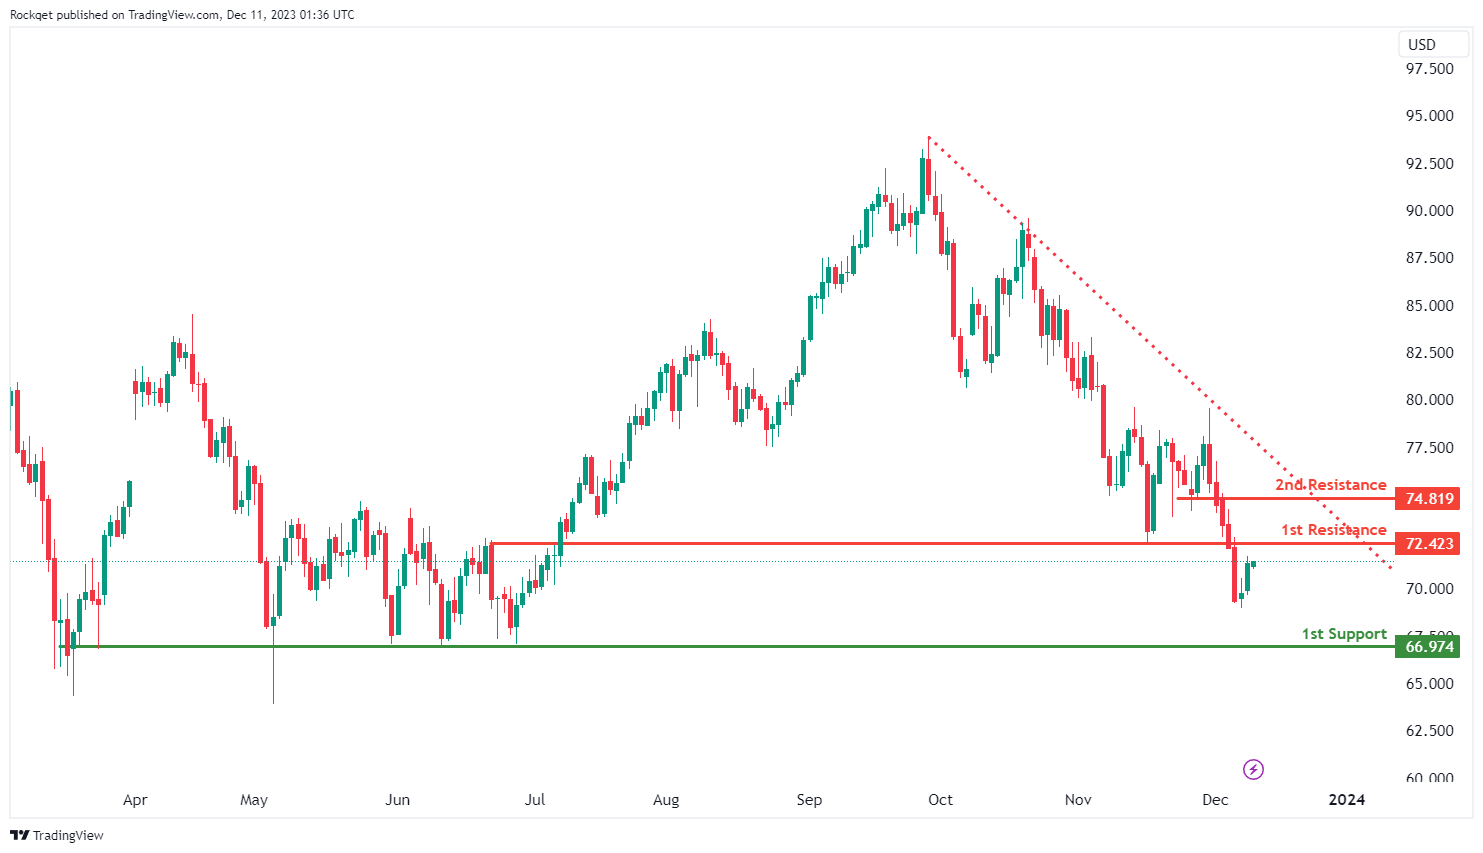
WTI/USD:
The WTI chart currently has a bearish overall momentum, and this bearishness is reinforced by the fact that price is trading below a major descending trend line, indicating a bearish trend is in place.
There’s a potential scenario where price could make a bearish reaction off the 1st resistance level and drop towards the 1st support.
The 1st support at 66.97 is categorized as a multi-swing low support. This level is significant as it implies a potential area where buying interest may emerge, potentially providing support for WTI.
On the resistance side, the 1st resistance at 72.42 is identified as pullback resistance. This level is likely to act as a substantial barrier where selling interest could intensify, potentially causing a bearish reaction.
Further up, the 2nd resistance at 74.81 is also categorized as pullback resistance, suggesting another level where selling pressure may increase.
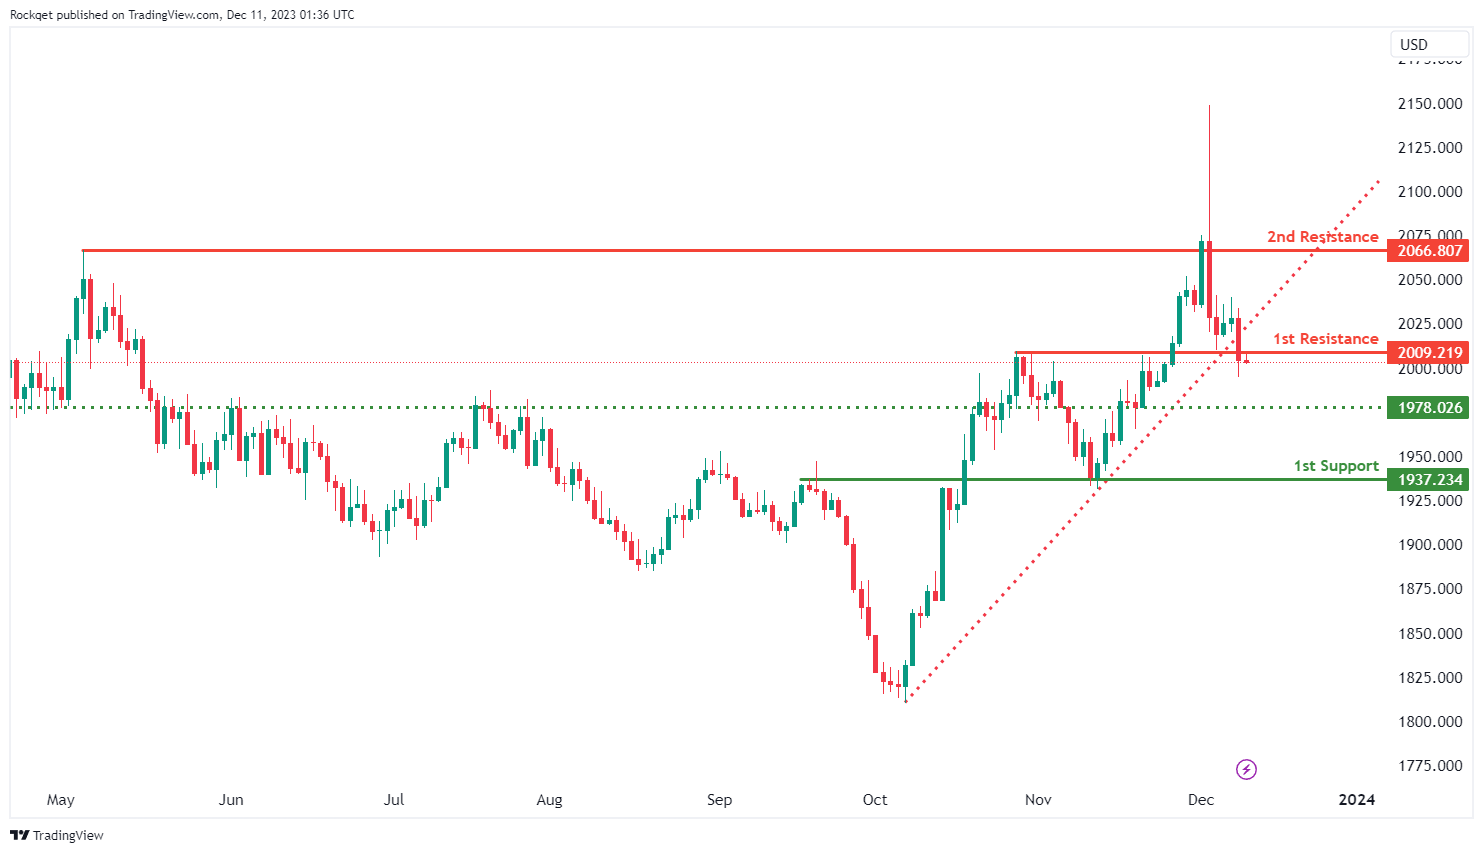
XAU/USD (GOLD):
The XAU/USD chart currently has a bearish overall momentum, and this is attributed to the price breaking below an ascending support line, indicating the potential for a bearish move.
There’s a possibility that price could make a bearish reaction off the 1st resistance level and drop towards the 1st support.
The 1st support at 1937.23 is categorized as an overlap support, which suggests it could be a significant level where buying interest may emerge, potentially providing support for XAU/USD.
Intermediate support at 1978.02 is another level to consider, as it’s identified as pullback support and could act as a potential area where buyers become active.
On the resistance side, the 1st resistance at 2009.21 is noted as pullback resistance, indicating it could be a substantial barrier where selling interest may intensify, potentially causing a bearish reaction.
Further up, the 2nd resistance at 2066.80 is also categorized as pullback resistance, suggesting another level where selling pressure may increase.
USD/CHN sets sight on 7.2 as rebound from fibonacci support extends
Chinese Yuan weakens notably in Asian session today, setting its sights on crossing the 7.2 mark against Dollar. This movement is largely attributed to deepening deflation in consumer and factory prices in China, exerting downward pressure on the Yuan. Concurrently, Dollar is still riding the tailwind generated by last week's robust job data.
A key question for Yuan is whether its extended decline, which began in January this year, concluded in September. And, if Yuan is now in a medium-term up trend that's set to extend through 2024.
Some economists remain cautious about the currency's prospects, pointing to the prolonged downturn in China's housing market and consumer spending as significant drags on its value. Further impacting Yuan is the ongoing "de-risking" efforts by multinational corporations. These firms are increasingly adopting a "China+" strategy, diversifying their operations by adding plants and facilities in other countries, thereby diverting investments away from China. Moreover, these companies are likely to continue repatriating earnings, driven by China's relatively low interest rates, which could further depress Yuan.
From a technical perspective, it remains to be confirm is USD/CNH's fall from 7.3679 is a correction to the up trend from 6.6971, or reversing it.
The notable rebound from 7.1154 cluster support (38.2% retracement of 6.6971 to 7.3679 at 7.1117) is favoring the former case. Even so, sustained break of 55 D EMA (now at 7.2311) is needed to confirm completion of the pull back, and bring retest of 7.3679/3745 resistance zone.
On the other hand, sustained break of 7.1117/54 will favor the latter case of bearish trend reversal, and target 61.8% retracement at 6.9533 and below.
USD/CNH's trajectory is not only crucial in understanding the Yuan's movements but also serves as a valuable guide for USD/JPY. Additionally, it acts as a secondary indicator for the strength or weakness of AUD/USD.
EUR/USD Takes Hit And At Risk of More Downsides
Key Highlights
- EUR/USD struggled near 1.1020 and started a fresh decline.
- It traded below a key bullish trend line with support at 1.0860 on the 4-hour chart.
- GBP/USD is also correcting gains below the 1.2600 level.
- Gold prices declined heavily and traded below $2,000.
EUR/USD Technical Analysis
The Euro failed to gather momentum above the 1.1000 level against the US Dollar. EUR/USD formed a short-term top and started a fresh decline below 1.0920.
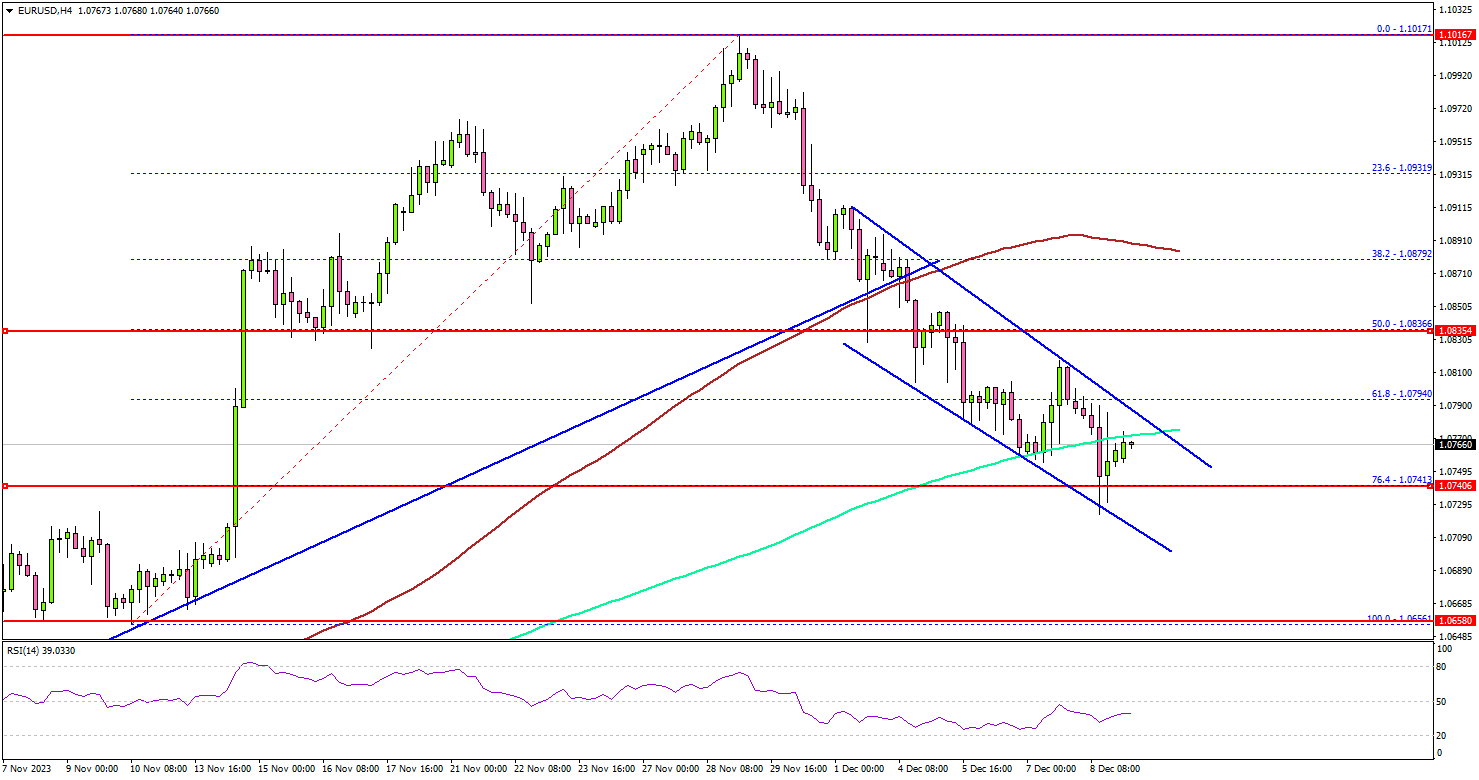
Looking at the 4-hour chart, the pair settled below the 1.0880 support, the 100 simple moving average (red, 4 hours), and the 200 simple moving average (green, 4 hours).
It traded below a key bullish trend line with support at 1.0860 on the same chart. There was a drop below the 61.8% Fib retracement level of the upward move from the 1.0656 swing low to the 1.1017 high.
The pair is now consolidating above the 76.4% Fib retracement level of the upward move from the 1.0656 swing low to the 1.1017 high.
If there is a downside break below the 1.0740 support, the pair could drop toward the 1.0700 level. The next major support is 1.0650, below which the bears might take control.
On the upside, immediate resistance is near the 1.0820 level. The next key resistance is near the 1.0880 level. The main resistance is near 1.0920. A close above the 1.0920 zone could open the doors for more upsides. The next stop for the bulls might be 1.1000.
Looking at GBP/USD, the pair is also moving lower and there is a risk of a drop toward the 1.2440 support in the near term.
Economic Releases
- Japanese Machine Tool Orders (YoY) for Nov 2023 – Forecast -18.0%, versus -20.6% previous.
Bitcoin and Ether undergo sudden pullback as consolidation phase commences
The cryptocurrency markets saw a sharp downturn in today's Asian session. The decline doesn't seem to be triggered by any specific event and might be amplified by the typically low liquidity on Mondays in the Asian markets. Another contributing factor could be profit-taking by traders following a recent strong bull run, especially with the impending FOMC rate decision looming on Wednesday.
Technically speaking a short term top should be in place at 44727 in Bitcoin. Consolidations should follow in the near term, and deeper pull back cannot be ruled out. But downside should be contained by 36710 cluster support (38.2% retracement of 24896 to 44727 at 37151) to bring rebound. Larger uptrend from 15452 is expected to resume at a later stage.
As for Ethereum, a short term top is in place at 2402, and more consolidative trading would be seen in the near term. There is risk of deeper pull back from outlook will stay cautiously bullish as long as 1984.4 support holds, which is close to 55 D EMA (now at 2017).
However, the larger outlook of Ethereum is less bullish, as it's just capped by 38.2% retracement of 4863.7 to 878.5 at 2400. Break of above mentioned 1984.4 support will indicate rejection by 2400 fibonacci level, and keeps medium term outlook neutral at best.
China’s CPI fell to -0.5% yoy in Nov, deepening deflation
Released over the weekend, China's economic data revealed a concerning trend as CPI plunged further into negative territory in November, marking the country's deepest deflationary period in three years. CPI fell to -0.5% yoy, a notable decline from -0.2% yoy in the previous month and falling short of the expected -0.2% yoy. This deflationary reading is the most significant since November 2020, indicating mounting economic pressures. Core CPI, which excludes volatile items such as food and fuel, remained stable at 0.6% yoy, mirroring October's figures.
National Bureau of Statistics chief statistician, Dong Lijuan, highlighted that the overall decline was driven primarily by decrease in energy and food prices. In particular, food prices dropped by -4.2% yoy, significantly impacted by a sharp -31.8% yoy decrease in pork prices. Meanwhile, non-food prices saw a modest increase of 0.4% yoy, with services prices climbing by 1.0% yoy.
On a month-on-month basis, CPI also experienced a downturn, falling by -0.5% mom in November from the previous month. This decline was characterized by a -0.9% drop in food prices and a -0.4% decrease in non-food prices.
From January to November, the average CPI increase was a mere 0.3% yoy, starkly undershooting China's set annual inflation target of around 3%.
Furthermore, PPI also recorded a downturn, declining by -3.0% yoy, which is worse than the prior month's -2.6% yoy and below the anticipated -2.8% yoy. This marks the 14th consecutive month of negative PPI readings, the worst since August.
Markets Daily
A solid US November employment report sparked a rise in US yields, though a slide in consumer inflation expectations reinforced Fed easing expectations. Equities rallied but AUD slipped to 0.6570. This week’s calendar is crowded but there is little today.
Friday
Australia’s calendar was quiet though we did see the Statement on the Conduct of Monetary Policy agreed between the Treasurer and the RBA Board. This marks the next step in the response to the RBA Review earlier this year. The changes are in line with the Review recommendations. We expect the February post-meeting communication to include unattributed votes and much more detailed forecasts. Most regional bourses rallied, the ASX 200’s 0.3% gain an underperformance. The exception was Japan, where further (more modest) upward pressure on Japanese government bond yields and the yen upset the Nikkei 225.
Currencies/Macro
The US dollar rose against all G10 currencies except CAD on Friday on the better profile of data and the rebound against JPY. EUR/USD was volatile, closing at 1.0762 (-0.3%) but off a spike low of 1.0724, GBP closed -0.35% at 1.2550. USD/CAD chopped around 1.3580. AUD/USD was around 0.6600 pre-NFP and opens the week around 0.6570. NZD/USD slipped about 55 pips or -0.9% to 0.6120, leaving AUD/NZD up 40 pips at 1.0745.
US November non-farm payrolls rose 199k (consensus 185k) though the prior two months were revised down a combined -35k. November unemployment declined to 3.7% (consensus unchanged at 3.9%) and underemployment pared back to 7.0% from prior 7.2%. The participation rate ticked up to 62.8% (prior 62.7%), but the pullback in unemployment was more pronounced. Average weekly hours worked also rose to 34.4 (est. unch. at 34.3) though average hourly earnings were unchanged (as expected) at 4.0%y/y.
US preliminary December consumer sentiment (University of Michigan) firmed to 69.4 (est. 62.0, prior 61.3) on higher expectations of 66.4 (est. 57.0, prior 56.8) and current conditions at 74.0 (est. 68.5, prior 68.3). Inflation expectations surprised with 1yr pulling back to 3.1% (est. 4.3%, prior 4.5%) and 5-10yr slipping to 2.8% (est. 3.1%, prior 3.2%).
UK November BoE/Ipsos 12 month Inflation Expectation pulled back to 3.3% (prior 3.6%).
German final November CPI was unchanged from preliminary levels with headline CPI at 3.2% and EU harmonised 2.3%.
Interest rates
The US 2yr treasury yield bounced from 4.63% pre-data to 4.72% while 10yr yields firmed from 4.18% pre-NFP to 4.225%. Though markets are not pricing any move at this week’s FOMC meeting, March 2024 pricing was pared back to around 70% for a cut, and December 2024 Fed pricing pared back some 16bps to -111bps or 4.22%.
Australian 3yr government bond yields (futures) pared -7bps to imply 3.97%, while 10yr yields also firmed +6bps to 4.36%. Market pricing in February 2024 and March 2024 is effectively for zero change.
New Zealand rates markets price the OCR, currently at 5.50%, to be unchanged on 28 February, with no further rate hikes in this cycle, and around 30bps cut for August 2024.
Credit spreads were firm with Main marginally tighter at 66.5, CDX in a bp to 61.5 to be just off its ytd lows, and US IG cash was 1-3bp better on the combination of sound underlying sentiment and lack of primary activity (no supply in either Europe or the US on Friday) as the year draws to a close. The majority of the remaining supply for the year is expected to be completed early this week ahead of the Fed.
Commodities
Crude markets managed a small bounce on Friday as equity markets hit 21-month highs though we still closed lower on the week, for the seventh consecutive weekly loss. The US DoE announced it will purchase 3mmb of crude for March delivery and will hold monthly tenders through at least May to refill the SPR. The DoE has bought close to 9mmb in 2023 and has secured nearly 4mmb on exchange returns so far this year. Venezuelan President Maduro threatened to annex the disputed oil region of Essequibo which is claimed by Guyana after holding a referendum last week which, if he follows through, would likely see US sanctions reinstated. Guyana is intensifying border security measures while Brazil has increased its military presence along its borders. The US has called on Venezuela to respect the territory as Guyana’s until the matter is settled. Guyana has denounced Venezuelan aggression and vowed to resist the claim. Exxon and Chevron are significant operators in the region. Reuters reported that the Venezuelan President Maduro and Guyana President Mohamed Irfaan Ali will meet on Thursday to discuss the dispute. Bloomberg reported that Europe is poised for an influx of US diesel this month according to data from Kpler as a result of worsening bottlenecks in the Panama Canal. And the EU reached a deal Friday that would allow member states to ban Russian LNG without EU wide sanctions.
Metals ended the week on a positive note with copper bouncing 1.15% to $8,438 and nickel up 1.8% to $16,805. There was little fresh news though the ‘Goldilocks’ NFP report and risk on move helped lift sentiment. First Quantum called on Panama to clear “illegal roadblocks” noting that the “access road to the mine and the international port must be urgently cleared”. Over the weekend however the Panama government formally ordered First Quantum to end all operations at the Cobre Panama mine. Anglo American shares plunged 18% Friday after it announced plans to cut copper production in mines including the Los Bronces mine in Chile. Chinese press noted that a Politburo meeting was held December 8, vowing that fiscal policy will be stepped up “appropriately” under the slogan of “using progress to promote stability” though monetary policy was ‘downgraded’ to “targeted” rather than forceful.
Iron ore markets closed the week on a high with the Politburo meeting lifting sentiment further. The January SGX contract is down 15c from the same time Friday morning at $134.60 though the 62% Mysteel index rose $1.35 to $137.30. The FT reported that the authorities have told steel manufacturers that annual production caps would not apply this year while the weaker yuan has allowed excess steel supply to be exported, helping iron ore prices to surge against expectations. Chinese iron ore imports in November came in at 102.74mt up 7.3% versus the 5yr seasonal average. China will report industrial production and fixed asset investment for November on Friday. Mysteel will also hold its annual steel conference in Shanghai on Friday.
Day ahead
A huge week for central bank meetings – Fed, Bank of England, ECB – starts with a quiet calendar.
NZ: November’s REINZ house sales and REINZ house prices are expected to reflect a strengthening housing market, though interest rates are still a suppressing factor.
UK: Following recent rapid falls, December’s Rightmove house prices are expected to be near lows.