
Sample Category Title
GBP/JPY Daily Outlook
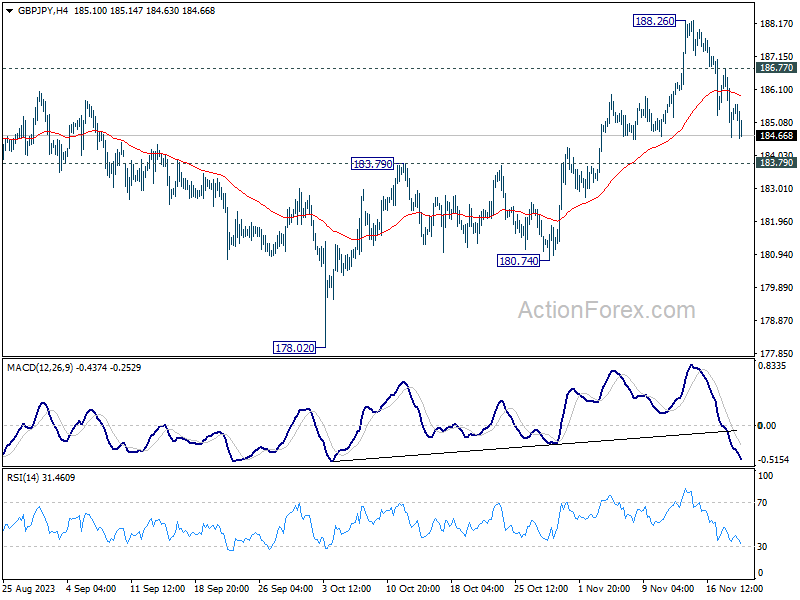
Daily Pivots: (S1) 184.53; (P) 185.66; (R1) 186.68; More...
Intraday bias in GBP/JPY is now mildly on the downside as fall from 188.26 is extending. But strong support could be seen from 183.79 to bring rebound. Above 186.77 will bring retest of 188.26 resistance. However, decisive break of 183.79 will bring deeper fall back towards 178.02 key support level.
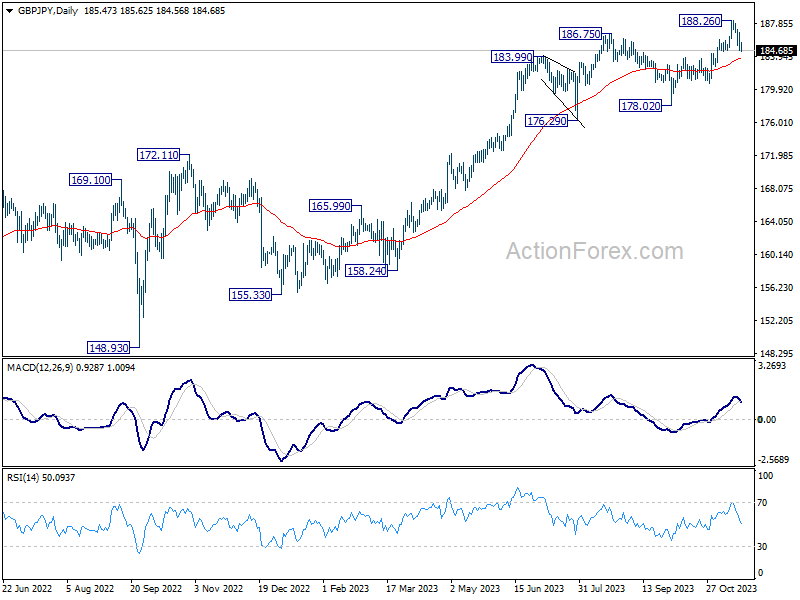
In the bigger picture, as long as 180.74 support holds, larger up trend from 123.94 (202 low) should still be in progress, next target is 195.86 (2015 high). However, firm break of 180.74 will now argue that a medium term top is formed, possibly in bearish divergence condition in D MACD, and bring deeper fall back to 178.02 support.
EUR/JPY Daily Outlook
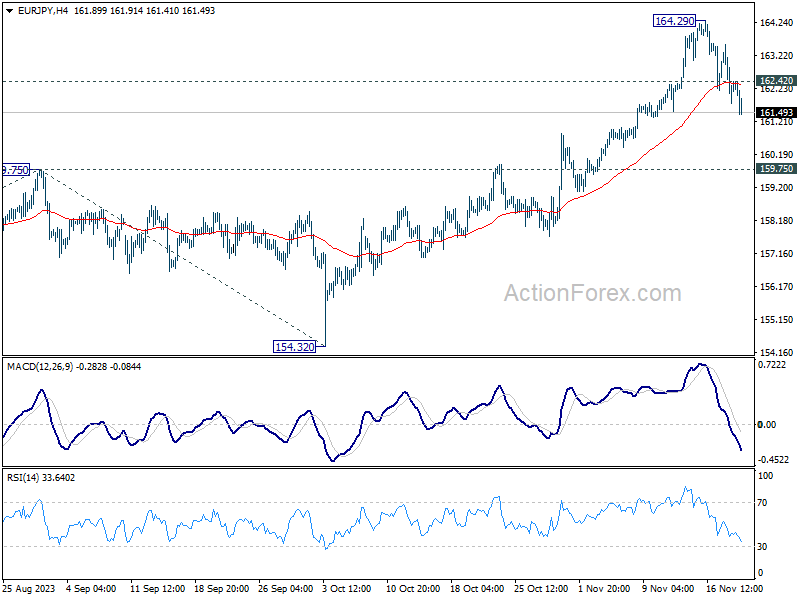
Daily Pivots: (S1) 161.57; (P) 162.56; (R1) 163.35; More....
Intraday bias in EUR/JPY is now on the downside as fall from 164.92 extends. Deeper decline would be seen, but downside should be contained well above 159.75 resistance turned support to bring another rally. On the upside, above 162.42 minor resistance will bring retest of 164.29. Firm break there will resume larger up trend.
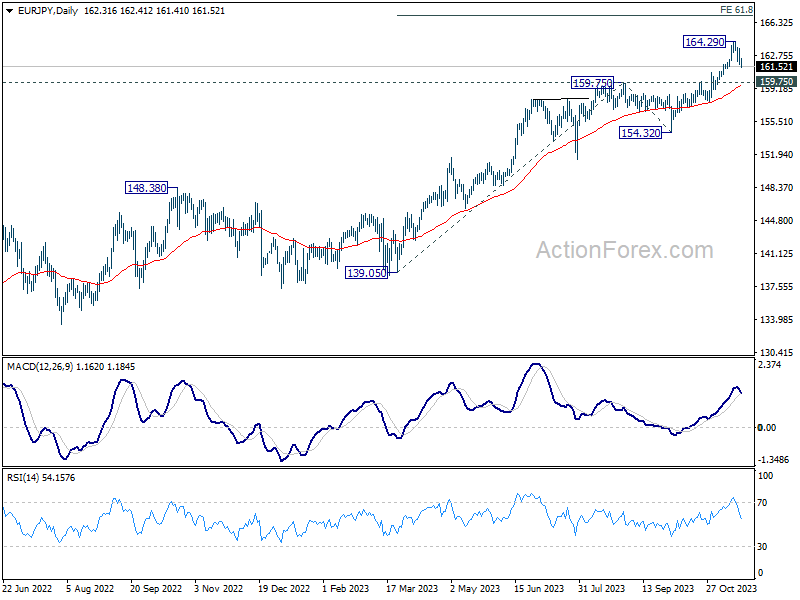
In the bigger picture, rise from 114.42 (2020 low) is in progress. Next target is 169.96 (2008 high). On the downside, break of 159.75 resistance turned support is needed to be the first sign of medium term topping. Otherwise, outlook will remain bullish even in case of deep pullback.
EUR/GBP Daily Outlook
Daily Pivots: (S1) 0.8738; (P) 0.8752; (R1) 0.8761; More....
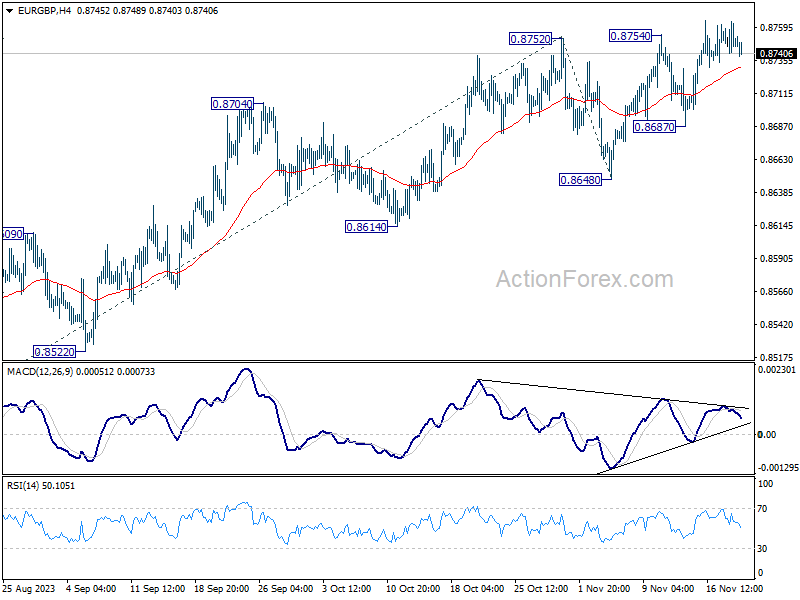
Further rally is expected in EUR/GBP as long as 0.8648 support holds. Current rise from 0.8491 should target 61.8% projection of 0.8491 to 0.8752 from 0.8648 at 0.8809. On the downside, break of 0.8687 support will indicate short term topping, and turn bias back to the downside.
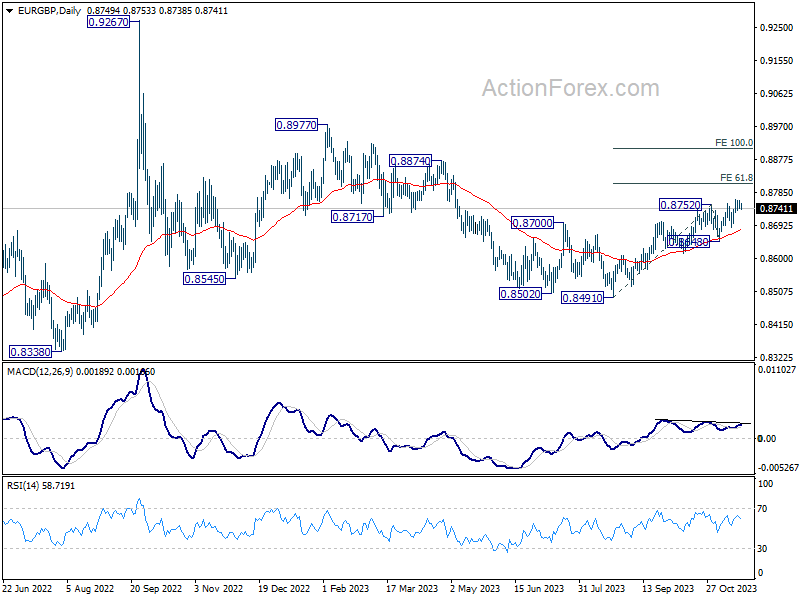
In the bigger picture, down trend from 0.9267 (2022 high) should have completed completed with three down to to 0.8491. Rise from 0.8491 is seen as another leg inside that pattern from 0.9499 (2020 high). Further rally should be seen to 0.8977 resistance and above. This will remain the favored case as long as 0.8648 support holds.
EUR/AUD Daily Outlook
Daily Pivots: (S1) 1.6630; (P) 1.6702; (R1) 1.6759; More...
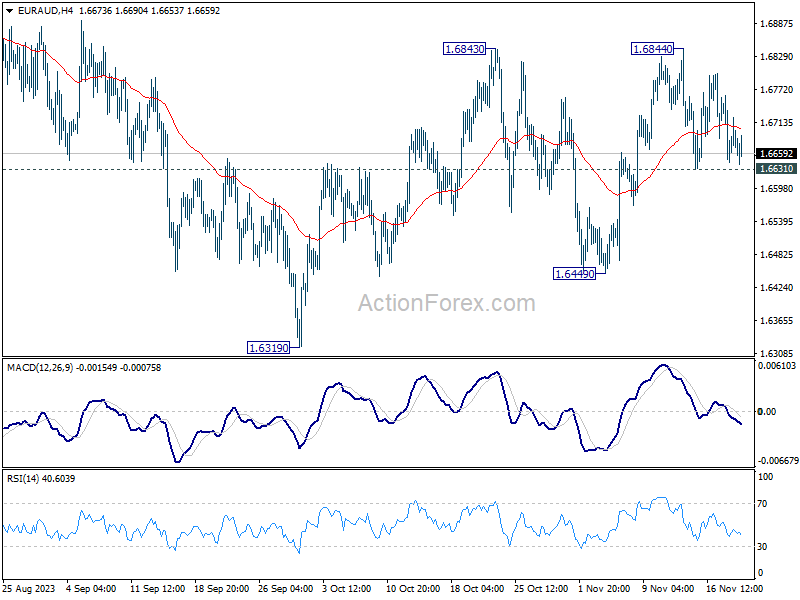
Range trading continues in EUR/AUD and intraday bias stays neutral. On the upside, sustained break of 1.6843/4 will resume the rebound from 1.6319 for retesting 1.7062 high next. On the downside, however, below 1.6631 minor support will turn bias back to the downside for 1.6449 support instead.
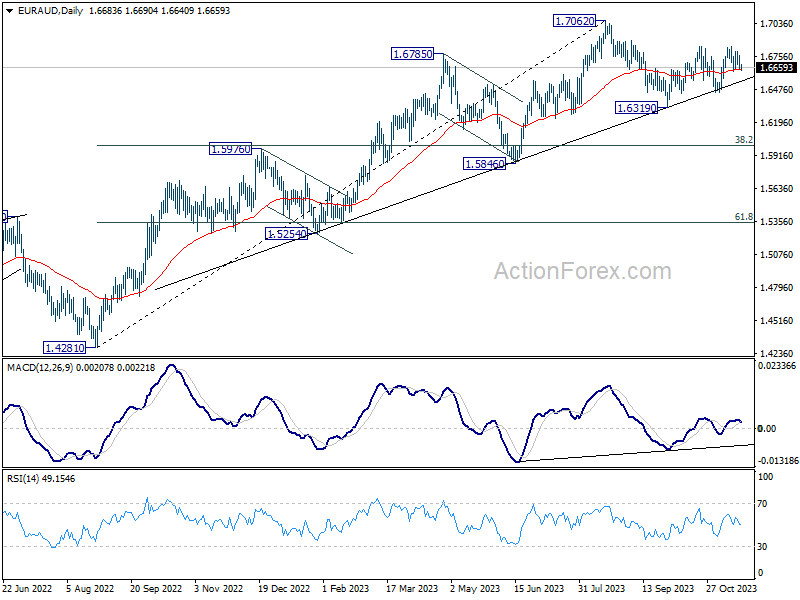
In the bigger picture, while 1.7062 is a medium term top, there is no clear sign of trend reversal as EUR/AUD continues to draw strong support from the medium term trend line. Break of 1.7062 will resume the larger up trend from 1.4281 (2022 low) to 1.7691 fibonacci level. Nevertheless, break of 1.6449 support will argue that deeper correction is underway to 38.2% retracement of 1.4281 to 1.7062 at 1.6000.
EUR/CHF Daily Outlook
Daily Pivots: (S1) 0.9660; (P) 0.9672; (R1) 0.9695; More...
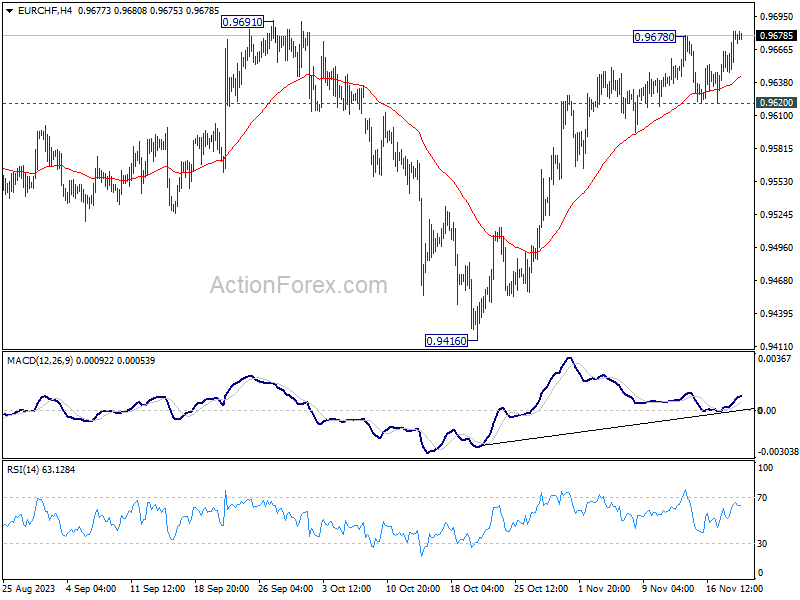
Intraday bias in EUR/CHF is back on the upside with break of 0.9678 resistance. Rise from 0.9416 is now resuming. Decisive break to 0.9891 will carry larger bullish implication, and target 0.9840 resistance next. On the downside, however, break of 0.9620 support will indicate short term topping, and turn bias back to the downside for deeper pull back.
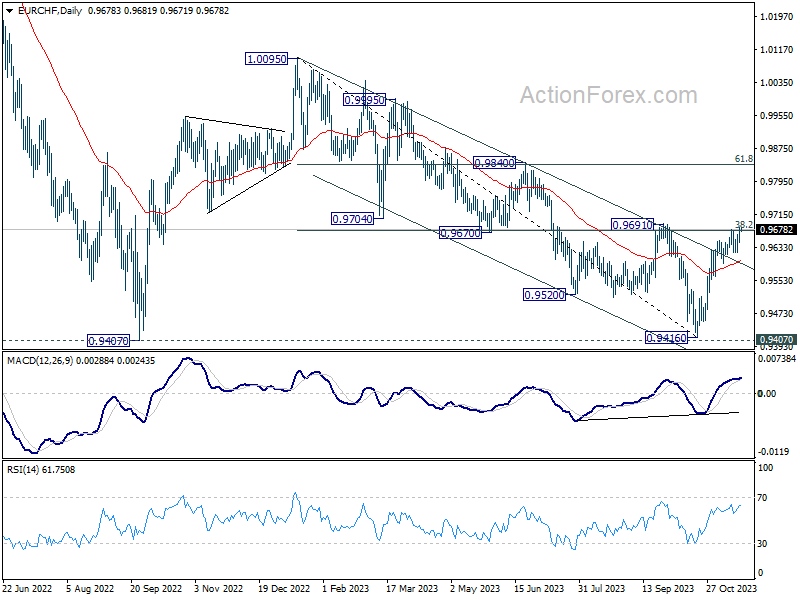
In the bigger picture, fall from 1.0095 (2023 high) might have completed at 0.9416, just ahead of 0.9407 support (2022 low). Sustained break of 0.9691 cluster resistance (38.2% retracement of 1.0095 to 0.9416 at 0.9675) will pave the way to 61.8% retracement at 0.9836 and above. However, rejection by 0.9691 will maintain medium term bearishness for another test on 0.9407 at least.
Exponent of Broadbased Dollar Weakness is USD/JPY
Markets
The US Treasury’s $16bn 20-yr Bond auction stopped a full bp though the 1:00 PM bid side and provided a new boost to the Treasury rally. Especially after the lackluster 30-yr Bond sale earlier this month. Investors snapping up longer term US debt is both testament to market belief in the Fed’s soft landing scenario and indifference on deteriorating public finances for the moment. Indirect bidders took home 74% of the volume, which was the most since June 21. This mainly represents foreign interest (eg central banks), but also domestic money managers placing bids through primary dealers. The auction bid cover was 2.58, the lowest in three months and well-below the 1y average, but markets turned a blind eye to this detail. Daily changes on the US yield curve ranged between -0.6 bps and -3.9 bps after Treasuries recovered from early losses. The US 10-yr yield closed just above 4.4%, closing in on 4.34% support (38% retracement on this year’s rise). Traded volumes remained relatively low for a third session straight. The auction results pushed US stock markets 0.6% (Dow) to 1.1% (Nasdaq) higher as well. The S&P closed at its highest level since August, with the 2023 high being within reach (4607 vs 4547). The technical picture for Nasdaq looks similar with the 2023 top at 14447 vs 14285 close. The trade-weighted dollar (DXY) slipped below the 50% retracement level on the ascent from mid-July to early October (103.46) with 62% retracement standing at 102.55. EUR/USD is already testing that 62%-reference at 1.0960. The exponent of broadbased dollar weakness is USD/JPY, with the pair drifting further away from 150+ levels (147.50). Today’s eco calendar is extremely thin with Minutes of the previous Fed meeting and ECB comments the sole highlights. They aren’t expected to change the underlying market drift.
Bank of England governor Bailey in a speech delivered to the National Farmers’ Union after European close, said that the UK central bank was “on watch for further signs of inflationary persistence that may require interest rates to rise again”. It’s too soon to be thinking about rate cuts with services inflation being much too high and wage growth still elevated. He also mentioned upward inflation risks ranging from global economic fragmentation (prioritization of local markets when supply fails), events in the Middle East via energy prices and the cost of food production and climate change (food prices). Bailey’s comments had no direct impact, but if any managed to halt sterling’s decline. EUR/GBP yesterday closed back below 0.8750 from a start at 0.8762. Bailey testifies to UK Parliament later today.
News & Views
News agency Bloomberg had an early peak into the European draft assessments of the 2024 national budgets, which is scheduled for release later today. It reported that France risks being put on the European Commission’s watch list for ignoring the bloc’s fiscal rules, joining other potentials including Finland, Croatia and Belgium. Germany and Italy are deemed not fully compliant, as are (amongst others) The Netherlands, Portugal and Slovakia. It’s the first time since the pandemic the EC is about to issue this assessment. Fiscal rules, which limit deficits to 3% of GDP, up to 2023 were suspended in the wake of Covid-19 and the energy crisis. The period in between has been used to rework the rigid framework but lacking a general consensus from member states means the old rules kick back in next year. Being on the list has no immediate consequences. It is up to the Commission to decide later whether or not it triggers the so-called excessive deficit procedure if countries at risk fail to correct the situation.
The Reserve Bank of Australia had discussed a fifth consecutive pause for the November meeting, the minutes revealed, but opted for a hike to 4.35% instead. Policymakers noted that the risk of not achieving the 2-3% inflation target had increased. Forecasts showing that goal reached by end 2025 were based on one or possibly two more rate rises, the minutes said. Australian money markets only attach a 30% probability to another hike to 4.6%. There’s a low tolerance level in general vs too high inflation with the minutes citing a scenario where “even a modest further increase in inflation expectations would make it significantly more challenging and costly to return inflation back to target within a reasonable timeframe.” In other words: a hike now is needed to prevent more aggressive tightening later. The Aussie dollar this morning briefly rose to the highest level since August on USD weakness before paring gains again. AUD/USD is currently trading around 0.656.
Gold Technical: Potential Multi-Week Bullish Movement Kickstarts
- Spot Gold (XAU/USD) minor corrective pull-back of -3.8% from the 27 October 2023 high to 13 November 2023 low may have ended.
- Potential start of another multi-week bullish up move for Spot Gold (XAU/USD).
- A further slide in the 10-year US Treasury real yield supports a bullish narrative for Gold.
- Watch the key short-term support at US$1,972.
Spot Gold (XAU/USD) has indeed shaped the corrective decline from its key short-term resistance of US$1,972 mentioned in our report and hit the US$1,932/1,920 support zone (printed an intraday low of US$1,931) on last Monday, 13 November.
Thereafter, the price actions of Gold (XAU/USD) have shaped a strong bullish reversal movement which in turn increases the odds that the corrective decline of -3.8% from the 27 October 2023 high of US$2,009 to 13 November 2023 low may have ended.
Several key technical elements and Intermarket analysis now suggest the Gold (XAU/USD) is likely undergoing another potential multi-week impulsive upmove sequence to retest its current all-time high of US$2,075 in the first step.
Lower opportunity cost of holding Gold
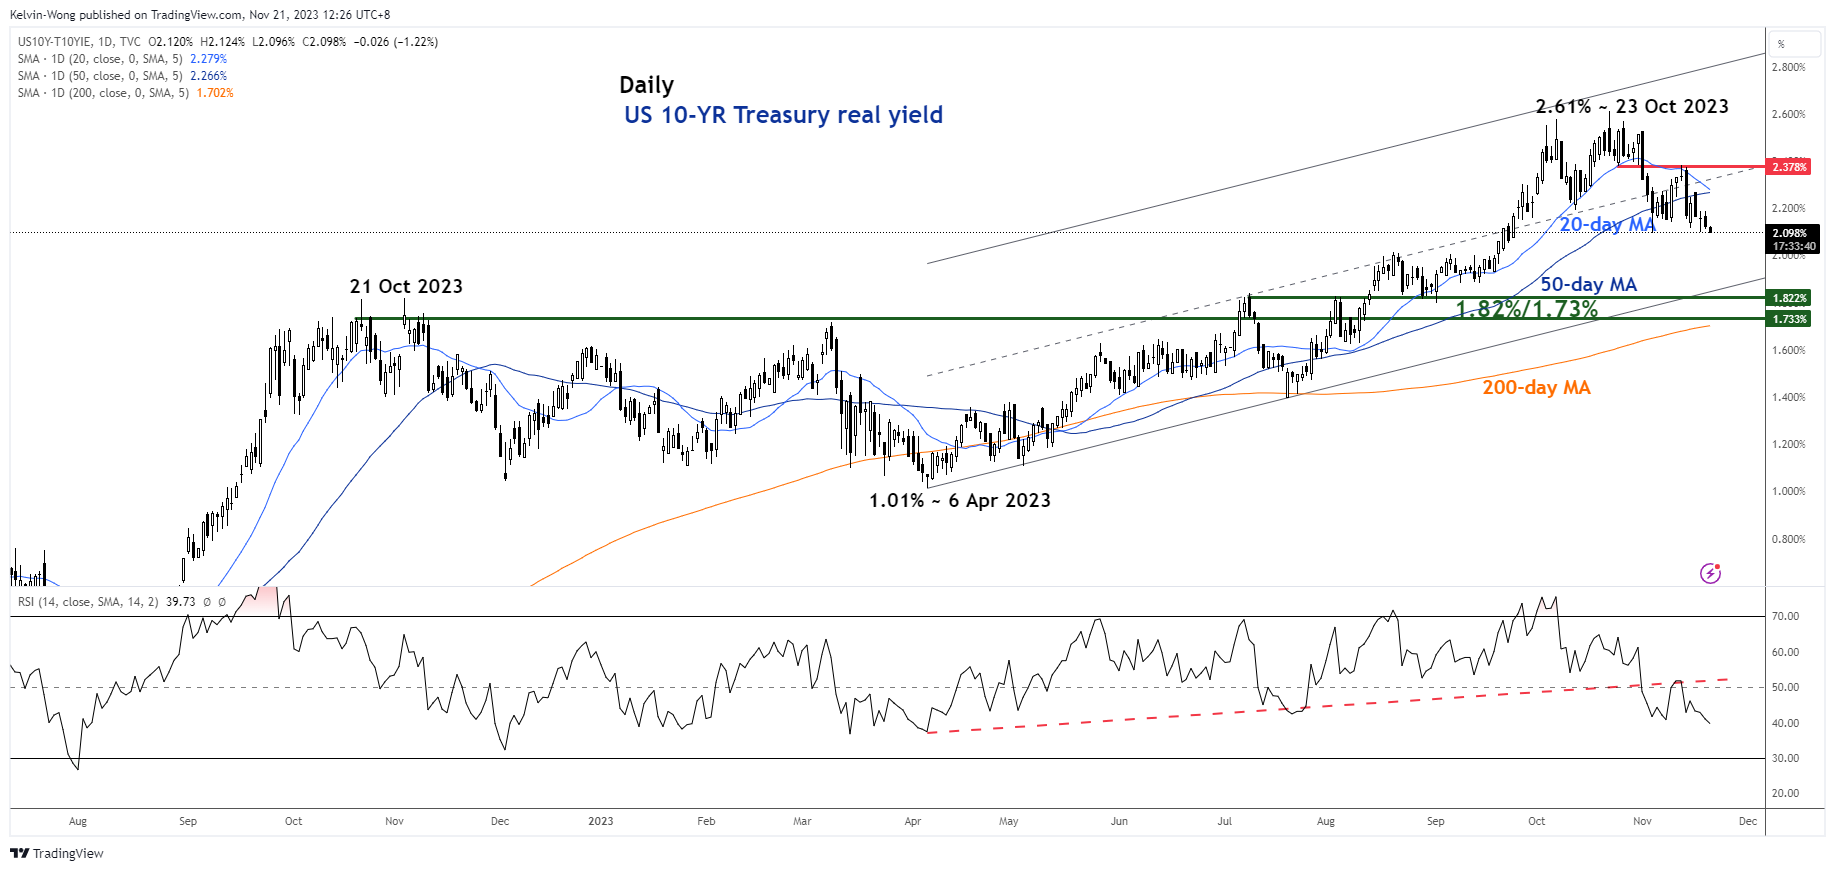
Fig 1: US 10-year Treasury real yield medium-term trend as of 21 Nov 2023 (Source: TradingView, click to enlarge chart)
The 10-year US Treasury real yield has shed -50 basis points (bps) from its 23 October 2023 high of 2.61% to yesterday, 20 November low of 2.11%; its steepest decline since the period of 9 March 2023 to 6 April 2023.
Technically speaking, medium-term momentum has turned bearish for the 10-year US Treasury real yield which increases the odds of a further slide at this juncture toward the long-term pivotal support zone of 1.82%/1.73% (also the lower boundary of the ascending channel from 6 April 2023 low & the 200-day moving average).
Hence, a further slide in the longer-term US Treasury real yield implies a lower opportunity cost of holding Gold as it is a non-interest bearing which in turn may increase its “relative attractiveness” and drive-up demand.
Bullish reversal after a retest on key 200-day moving average
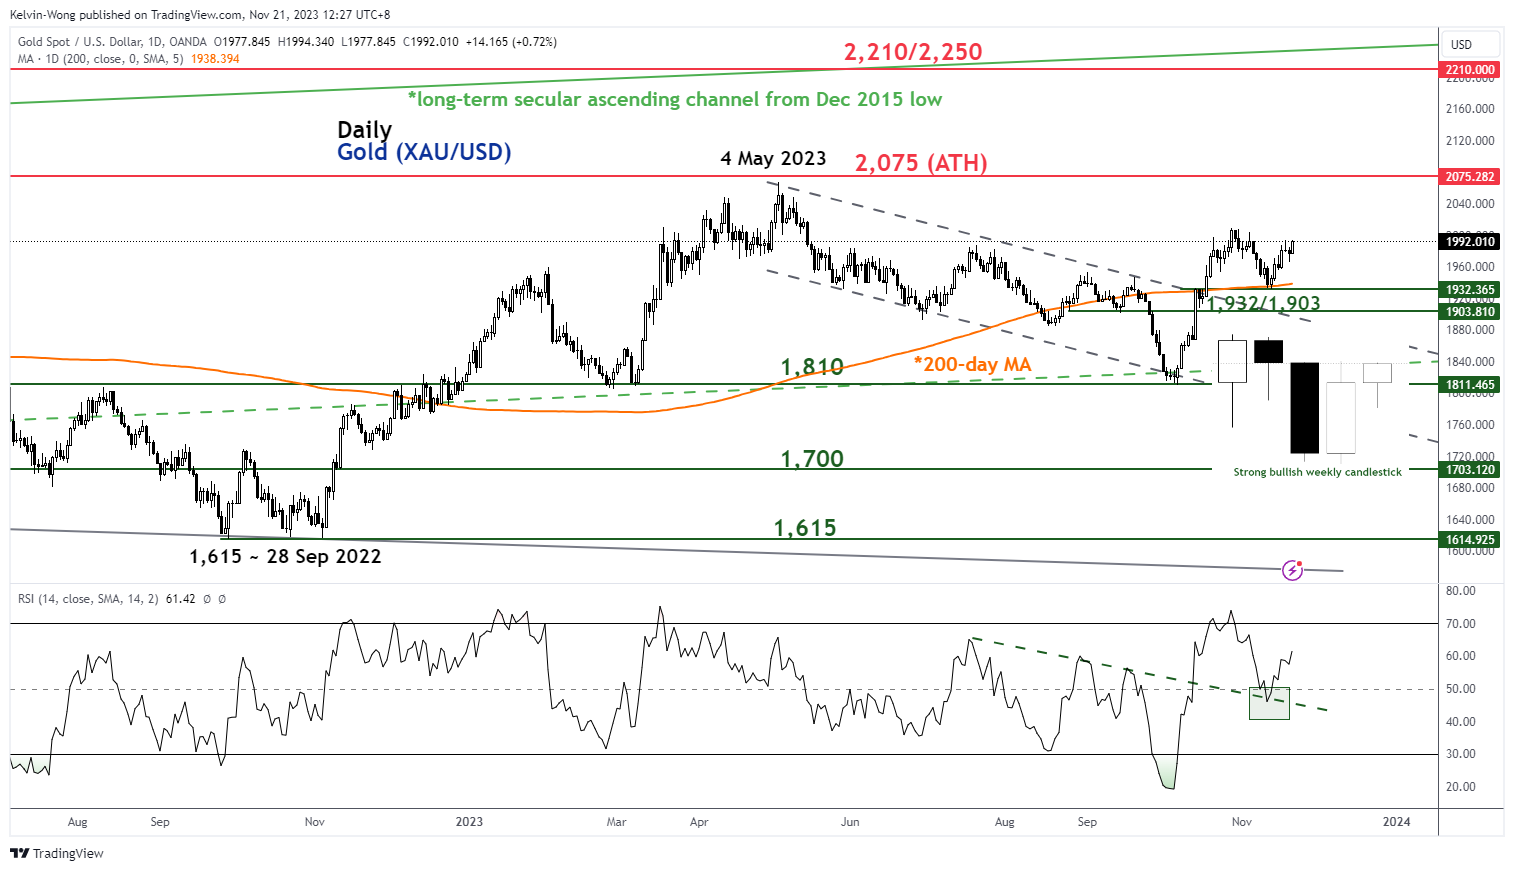
The price actions of Gold (XAU/USD) have shaped a strong weekly bullish candlestick last week that closed more than 50% of the long bearish Marubozu weekly candlestick for the week of 6 November 2023.
In addition, the daily RSI momentum has staged a rebound from its 50 level, indicating a revival of medium-term bullish momentum.
These observations suggest a significant change of sentiment from bearish to bullish that in turn advocates a potential terminal end to its short-term minor corrective decline from 27 October 2023 to 13 November 2023.
Watch the key short-term support at US$1,972
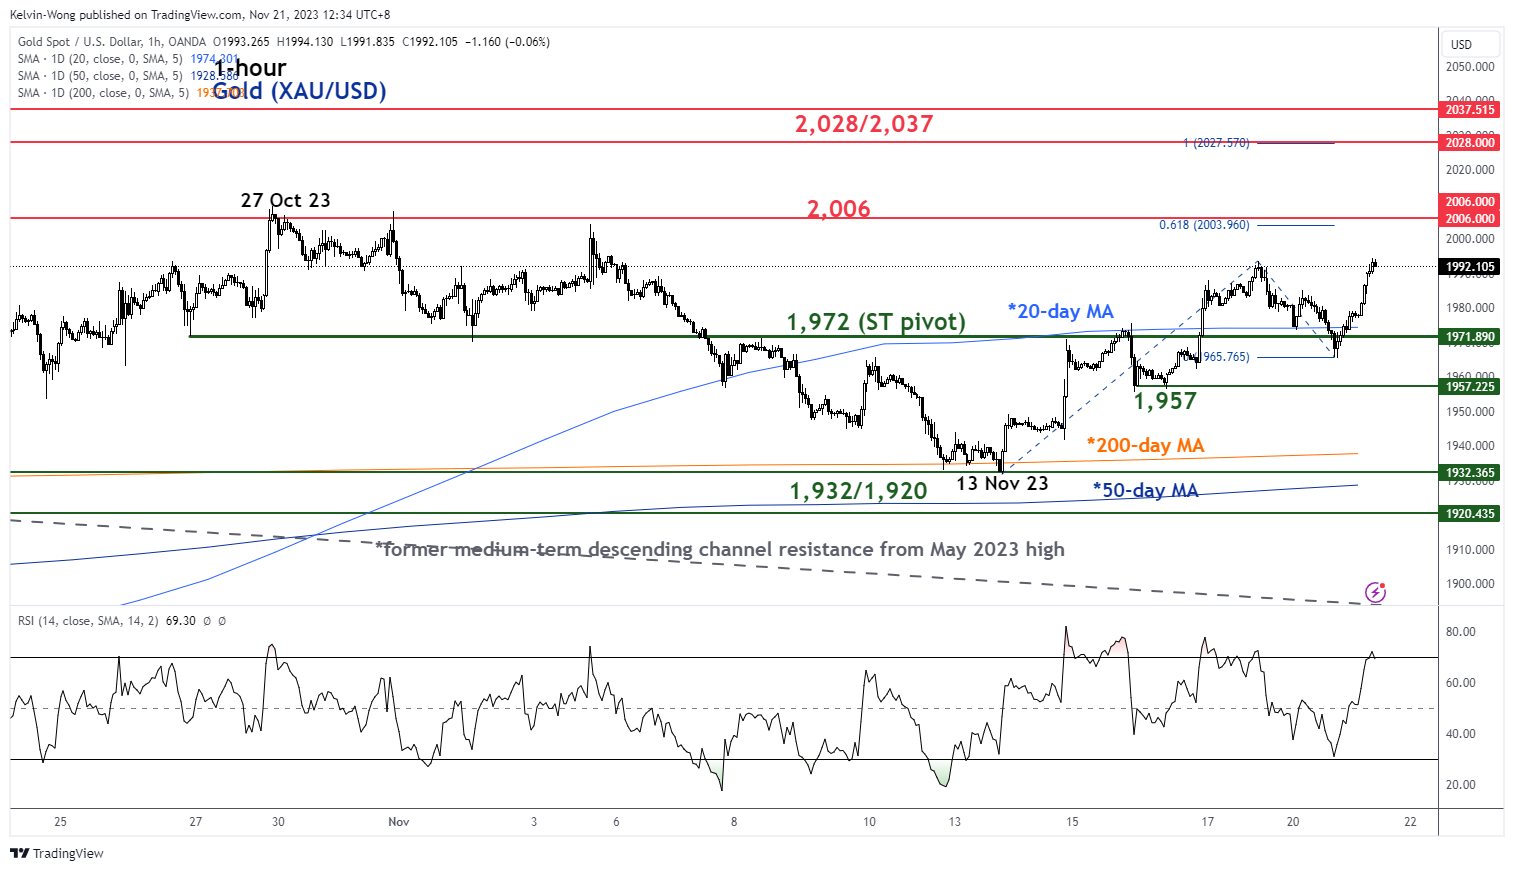
Fig 3: Spot Gold (XAU/USD) minor short-term trend as of 21 Nov 2023 (Source: TradingView, click to enlarge chart)
Yesterday’s price actions of Gold (XAU/USD) have shaped a minor pull-back of -1.4% from last Friday, 17 November high of US$1,993 before it staged a bullish reversal right at its 20-day moving average.
If the US$1,972 key short-term pivotal support holds, the minor short-term uptrend from the 13 November 2023 low remains intact. The next immediate resistances to watch will be at US$2,006 and US$2,028/US$2,037 (minor swing high area of 11 May 2023 & Fibonacci extension from 13 November 2023 low).
However, a break below US$1,972 negates the bullish tone for a pull-back towards the US$1,957 intermediate support.
Gold (XAUUSD) Elliott Wave Impulse Breakout In Progress
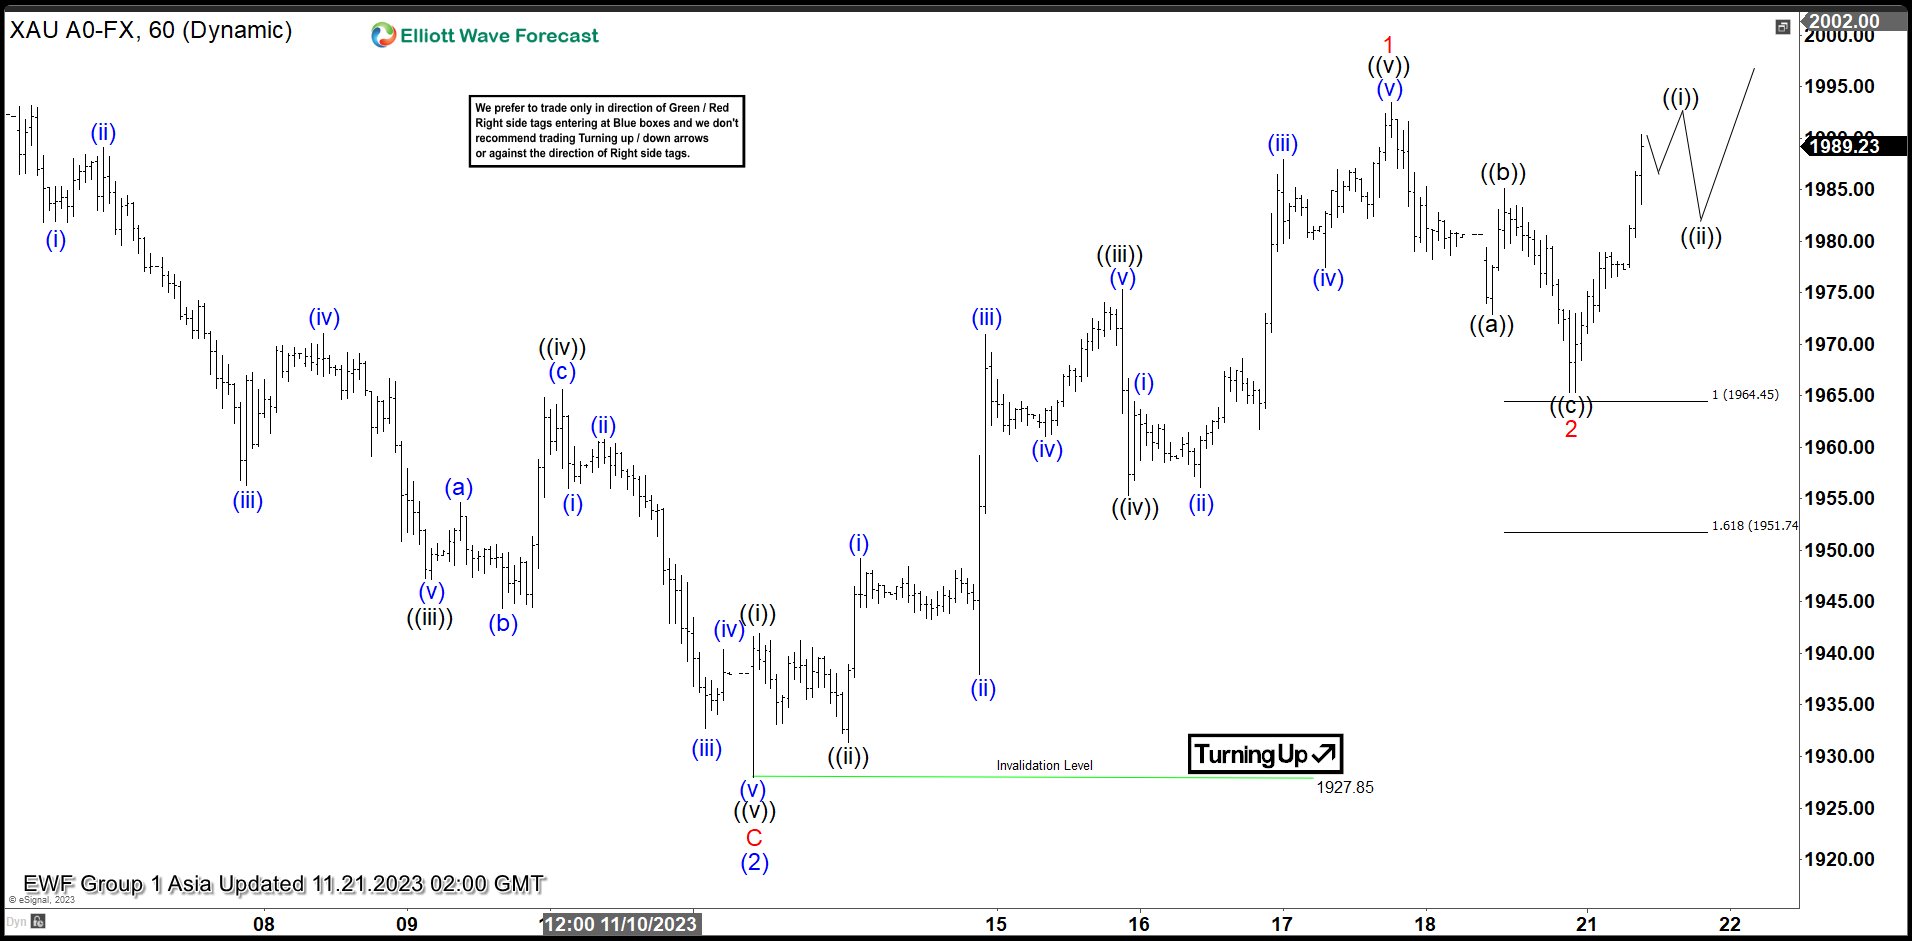
Rally from 9.28.2022 low is currently in progress as a 5 waves Elliott Wave impulse structure. Up from 9.28.2022 low, wave (1) ended at 2081.82 and pullback in wave (2) ended at 1810.58. The metal has resumed higher in wave (3). Internal subdivision of wave (3) is unfolding as another impulsive structure in lesser degree. Up from wave (2), wave ((i)) ended at 1941.95 and wave ((ii)) ended at 1931.4. Wave ((iii)) higher ended at 1975.30 and dips in wave ((iv)) ended at 1955.33.
Wave ((v)) higher ended at 1993.42 and this completed wave 1 in higher degree. Down from wave 1, wave ((a)) ended at 1972.90 and rally in wave ((b)) ended at 1985.16. The metal then extends lower in wave ((c)) towards 1965.30 which completed wave 2 in higher degree. The metal then turns higher in wave 3. Up from wave 2, wave ((i)) is expected to end soon, then it should pullback in wave ((ii)) before the metal resumes higher again. Near term, as far as pivot at 1927.85 low stays intact, expect dips to find support in 3, 7, or 11 swing for further upside.
Gold (XAUUSD) 60 Minutes Elliott Wave Chart
Gold Elliott Wave Video
https://www.youtube.com/watch?v=0RRdOTudhkg
Fasten Your Seatbelts: Nvidia Reports
The US bonds extended their rally after a relatively strong US 20-year bond auction. The US 20-year yield tanked to 4.70% from 5.40% back in October. The US 10-year yield slipped below 4.40%, while the 2-year yield, which captures the Federal Reserve (Fed) bets, remained steady near 4.90%. The significant fall in US long-term yields compared to the short-term yields widens the yield spread across the US yield curve. The gap between the US 2 and 10-year yield is back above 50bp. That means that the recession odds are mounting – again – according to the usual interpretation of a yield curve inversion. Investors accept lower yields for longer-term papers as they price in a higher possibility of economic slowdown and recession. The latter also boosts the odds for the first Fed rate cut in a few months from now. Activity on Fed funds futures price in more chance for a rate cut in the Fed’s May meeting than otherwise. On a side note, the fact that the 20-year auction came right after the US government averted a shutdown (hence the risk of another rating cut) also explained why the US 20-year auction was much better than the 10 and 30-year auctions which were conducted before the latest US CPI report, and amid the uncertainty of yet another possible government shutdown.
Now expect the Fed minutes, due later today, to be much less exciting for bond traders. The Fed minutes will come as a reminder that the falling long-term yields were a major reason why the Fed decided to keep rates steady at the latest meeting. Tanking yields mean that the Fed must stay alert. And it’s not only the Fed! The European Central Bank (ECB) Governing Council Perre Wunsch warned yesterday that the bets on ECB rate cuts are raising the possibility the central bank will hike the borrowing costs again – to make sure that the financial conditions don’t loosen before time. In vain. Yields in Europe continue falling despite warnings, as well, and global stocks continue to surf on persistent fall in long term yields. The Stoxx 600 index tests the 200-DMA to the upside, the S&P500 extended gains yesterday to a fresh high since summer, while the rate-sensitive Nasdaq hit the highest levels since January 2022. Microsoft and Nvidia hit fresh records.
Nvidia reports
Nvidia is due to release earnings after today’s closing bell. The company will attempt to beat its own prediction of $16bn sales in the Q3, up from $13.50bn a quarter earlier and around $10bn more than the Q3 of last year. Even though the S&P500 CEOs cut down their mentions of AI in earnings call, the gap between the demand and supply for Nvidia chips is comfortably large to allow the company to grow at desired pace. Better-than-expected results could send Nvidia to a fresh high, but anything less than stellar is poised to trigger substantial profit-taking. If confidence falters, the $500 psychological benchmark becomes an attractive target for sellers. The US-China chip war and the US curbs on advanced chip exports to China are the major sticky points for future sales projections.
In both cases, expect volatility in the wake of the earnings announcement of the year’s most loved and intriguing company. Options trading implies that we could see a positive or a negative swing of around 8% after the earnings report hits the ground.
Elsewhere, HP, Lowe’s and Best Buy will also expected to report earnings today and their sales are expected to have slowed due to weaker consumer and corporate spending.
More Central Bank Thoughts Today
Market movers today
Today we have only tier-2 data. US existing home sales are expected to fall a bit further from an already low level as high mortgage rates weigh on housing demand.
Tonight FOMC minutes will give more insights into the thinking of the Fed. However, it may be a bit outdated as the main theme at the time of the meeting was the tight financial conditions. Since then we have seen a big decline in bond yields and a rally in equities and credit bonds.
The central bank of Hungary meets today and we expect a 25bps rate cut to 12.0%.
We also have Canada CPI and ECB's Lagarde, Schnabel and Centeno speaking late in the day.
The 60 second overview
Markets: Yesterday was another risk-on session with the VIX volatility index at the lowest levels since mid-September. USD weakened and oil traded to USD 83 per barrel. Also industrial metals took a leg higher.
German inflation: It has been very slow on the data front, but we have received German producer prices, which declined 0.1% mom. They are now 15% below the peak in September last year, which continues to weigh on goods inflation in the biggest euro area economy.
Equities: Global equities started the week higher as the hope of a soft landing could not hold back the positive sentiment. Yields were lower, credit spreads tighter, the dollar weaker and cyclical growth outperforming in equity space. Not a classic old-fashioned risk-on as yields moved lower, but a classic inflation-relief risk-on rally as we have seen it post the last Fed meeting. In the US: Dow +0.6%, S&P 500 +0.7%, Nasdaq +1.1% and Russell 2000 +0.5%. Some of the optimism is moving on to Asia this morning with most indices higher. China is taking a next step in saving their developers with a "white list" that should secure better financing conditions. US and European futures marginally positive this morning.
FI: The global yield curves flattened from the front end as the 2Y German government bond yield rose 4bp, while 30Y was unchanged. In the US the curve flattened some 5bp between 2Y and 30Y after a solid auction of 20Y US Treasuries. This was the first long-dated Treasury auction after the very poor 30Y auction in early November.
Italian government bonds performed after the change in the outlook from negative to stable by Moody's. Moody's also upgraded Portugal with two notches from Baa2 to A3 although the Portuguese government has resigned and a snap election has called for 10 March.
FX: EUR/USD has stabilised above the 1.09 mark in a quiet start to the week as the USD sell-off has continued steadily after the soft US CPI print last week. Today, focus turns to the release of the FOMC minutes. Scandies were the big winners yesterday with EUR/NOK trading close to the 11.70 mark and EUR/SEK ending the day around to the 11.45 mark. Scandies were boosted by positive risk sentiment while the NOK leg additionally took comfort in a move higher in oil prices.
Credit: The positive tone continued in credit markets yesterday, and spreads were tighter with iTraxx Main closing at 68bp (-1bp) and Xover at 381bp (-6bp). There was plenty of action in the primary market as both corporate (Ford, SNAM) and financial issuers (Credit Agricole, Nationwide) priced deals in EUR. In the Nordics, Ericsson and Vestas announced new mandates.