
Sample Category Title
EUR/USD Daily Outlook
Daily Pivots: (S1) 1.0908; (P) 1.0930; (R1) 1.0962; More...
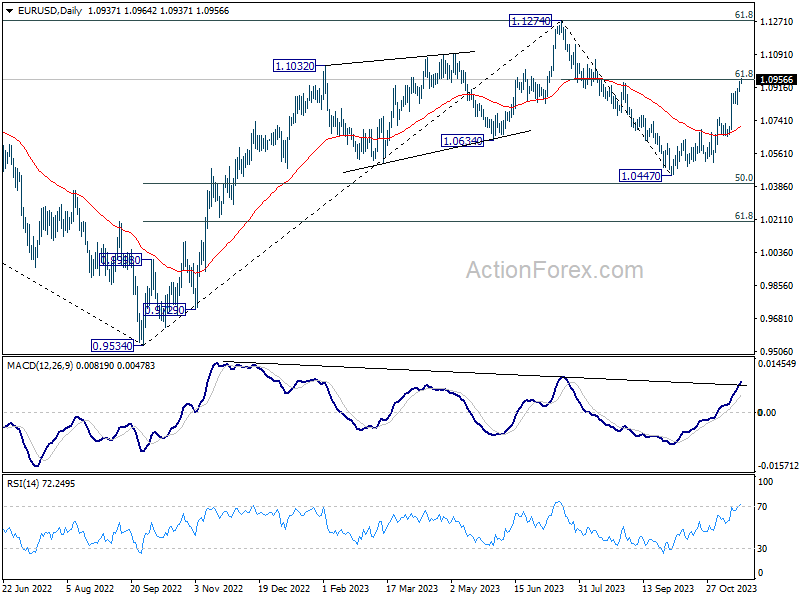
EUR/USD's rally from 1.0447 is in progress and intraday bias stays on the upside. Sustained break of 61.8% retracement of 1.1274 to 1.0447 at 1.0958 will pave the way to retest 1.1274 high. On the downside, break of 1.0823 support is needed to indicate short term topping. Otherwise, further rally is in favor in case of retreat.
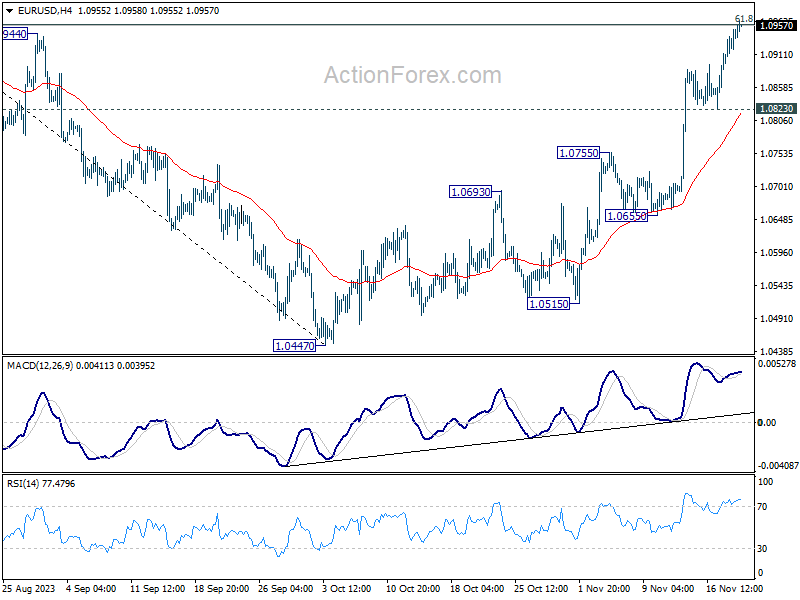
In the bigger picture, price actions from 1.1274 are viewed as a corrective pattern to rise from 0.9534 (2022 low). Rise from 1.0447 is tentatively seen as the second leg. Hence while further rally could be seen, upside should be limited by 1.1274 to bring the third leg of the pattern.
USD/JPY Daily Outlook
Daily Pivots: (S1) 147.68; (P) 148.83; (R1) 149.55; More...
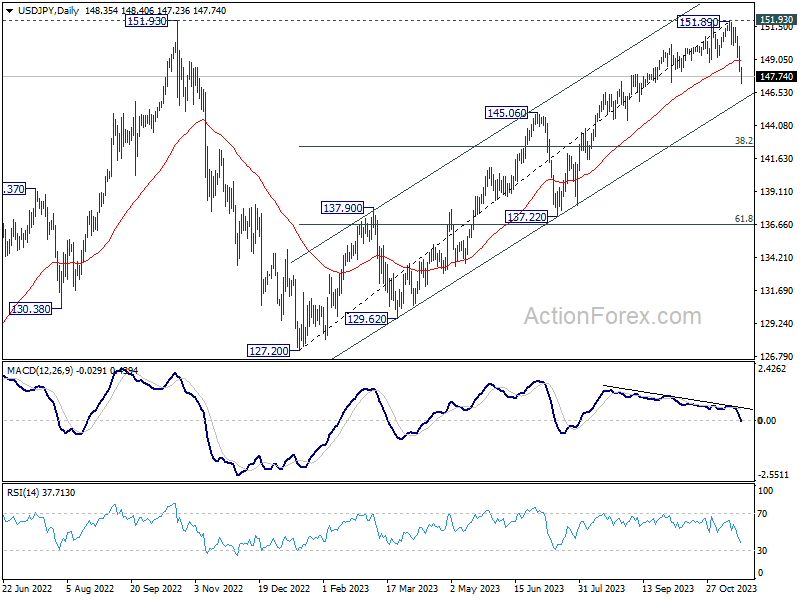
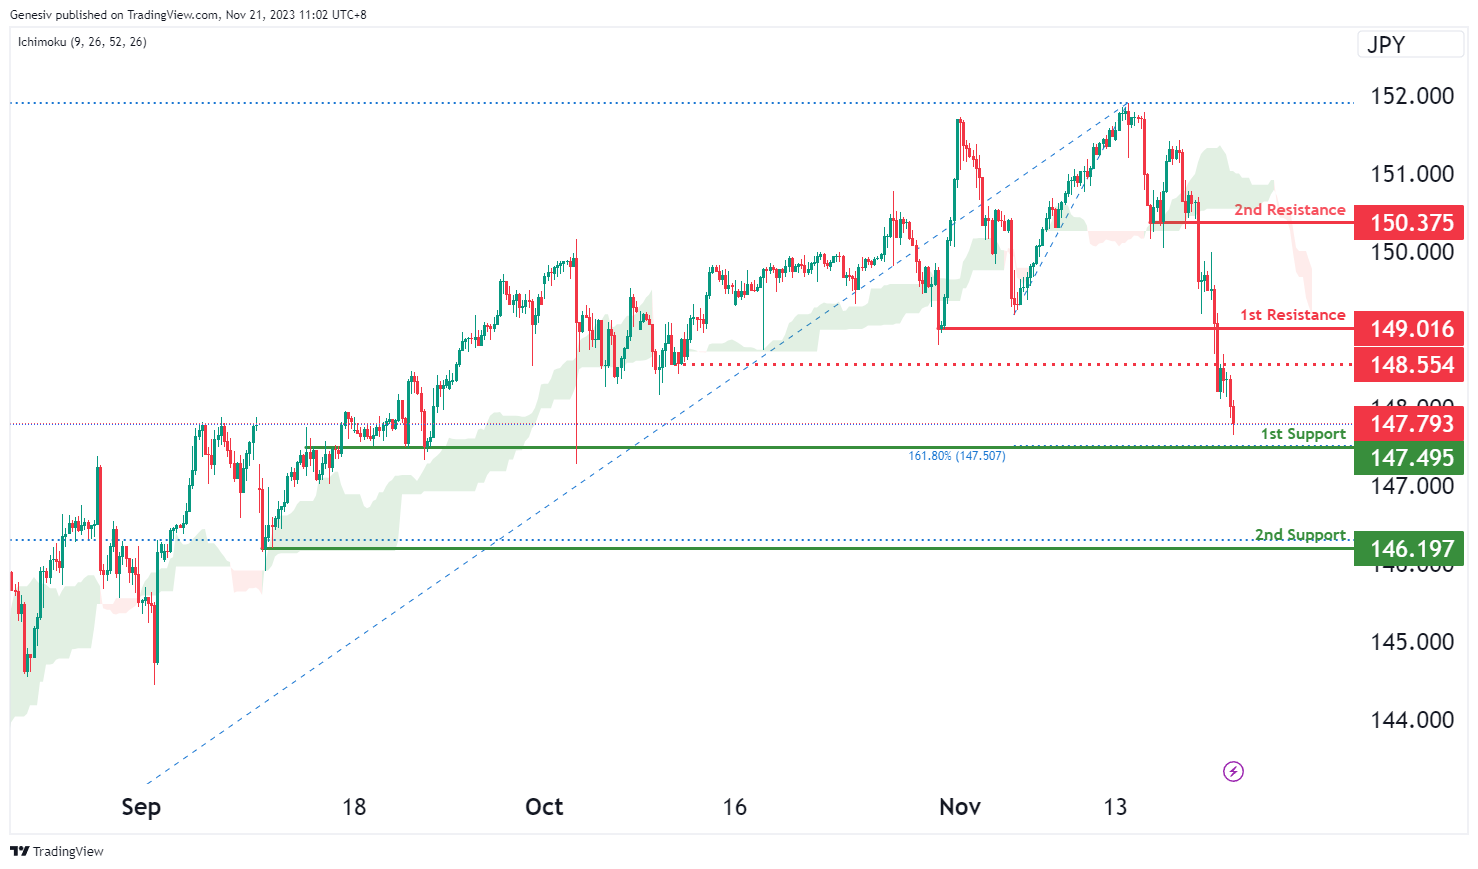
Intraday bias in USD/JPY remains on the downside at this point. Current fall from 151.89 should target medium term channel support at 146.00 next. On the upside, above 148.67 minor resistance will turn intraday bias neutral and bring recovery. But risk will stay on the downside as long as 151.89 resistance holds.
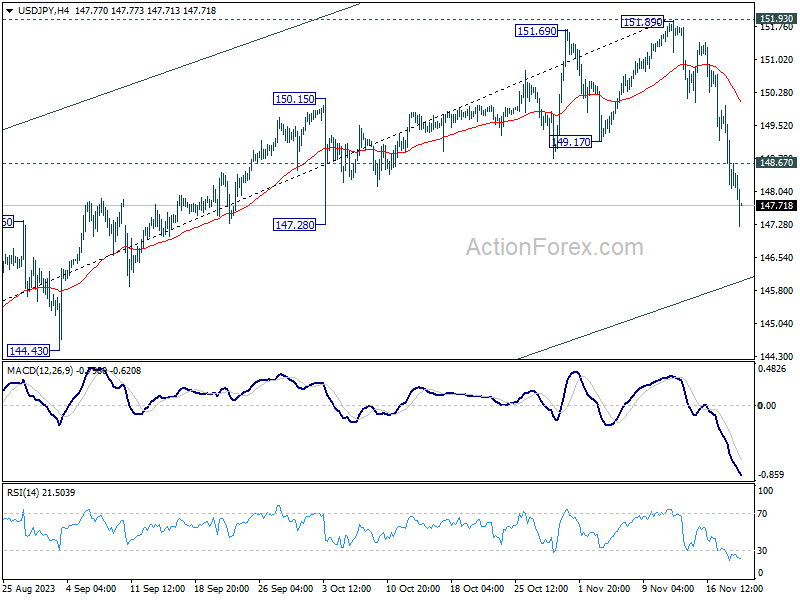
In the bigger picture, rise from 127.20 (2023 low) is seen as the second leg of the pattern from 151.93 resistance (2022 high). Decisive break of 145.06 resistance turned support will confirm that this second leg has completed, after rejection by 151.93. Deeper fall would be seen through 38.2% retracement of 127.20 to 151.89 at 142.45 to 61.8% retracement at 136.63. Nevertheless strong bounce from 145.06 will retain medium term bullishness for another test on 151.93 at a later stage.
GBP/USD Daily Outlook
Daily Pivots: (S1) 1.2461; (P) 1.2490; (R1) 1.2533; More...
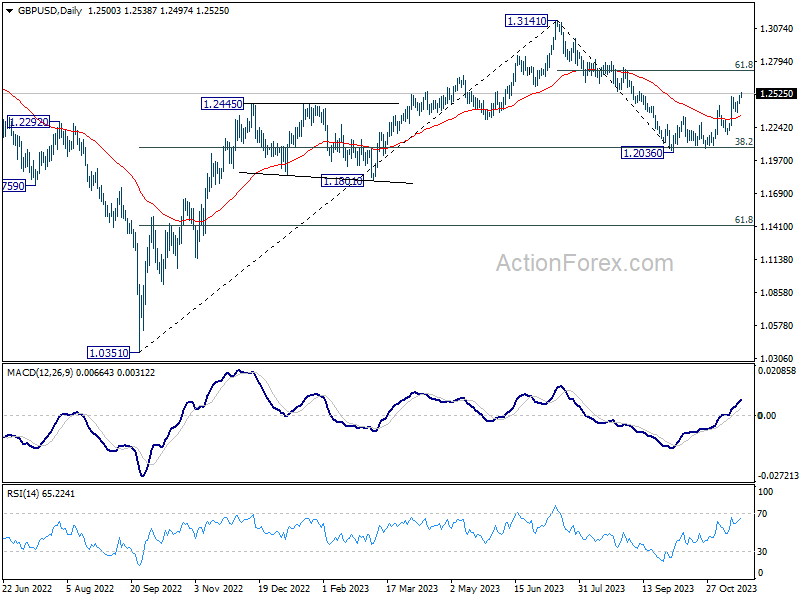
Intraday bias in GBP/USD stays on the upside as rise from 1.2036 is in progress. Current rally should target 61.8% retracement of 1.3141 to 1.2036 at 1.2716 next. On the downside, break of 1.2372 support is needed to indicate short term topping. Otherwise, further rally will remain in favor in case of retreat.
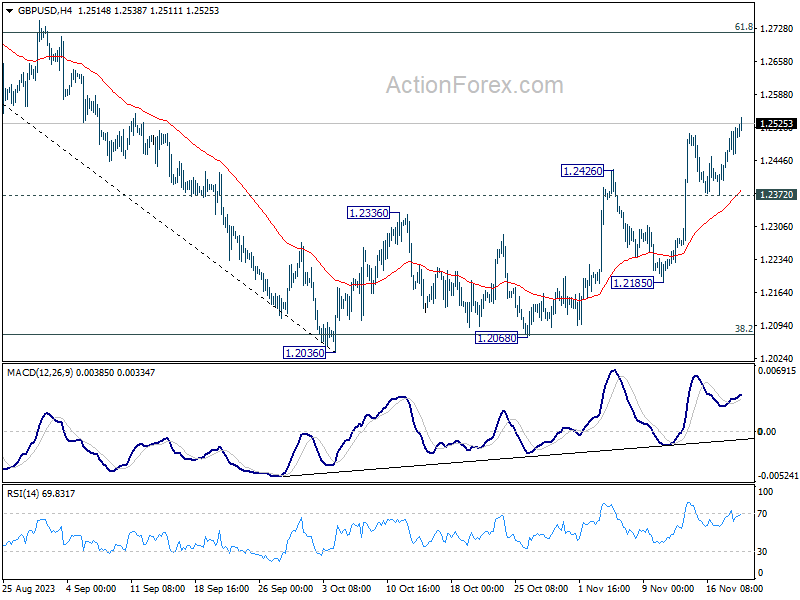
In the bigger picture, price actions from 1.3141 are seen as a corrective pattern to rise from 1.0351 (2022 low). Strong rebound from 38.2% retracement of 1.0351 (2022 low) to 1.3141 at 1.2075 argues that current rise from 1.2036 is the second leg. However, while further rally could be seen, upside should be limited by 1.3141 to bring the third leg of the pattern.
USD/CHF Daily Outlook
Daily Pivots: (S1) 0.8828; (P) 0.8849; (R1) 0.8872; More....
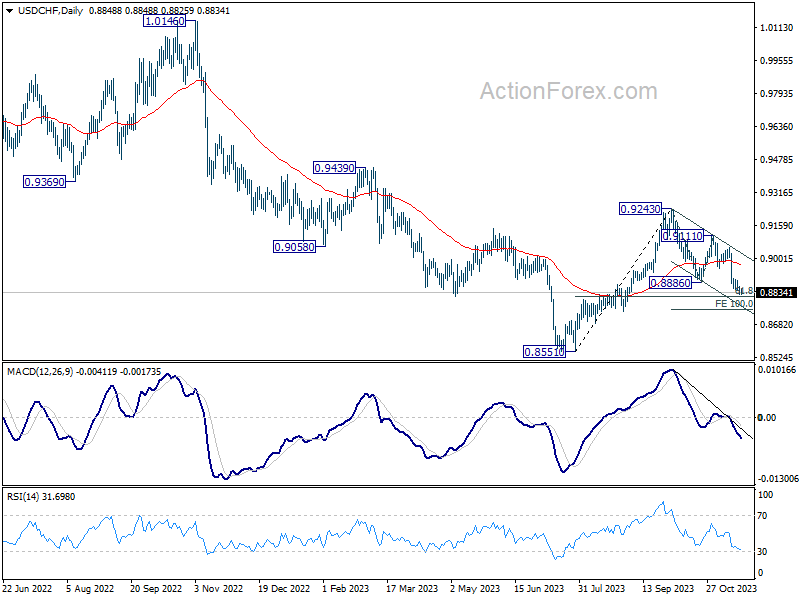
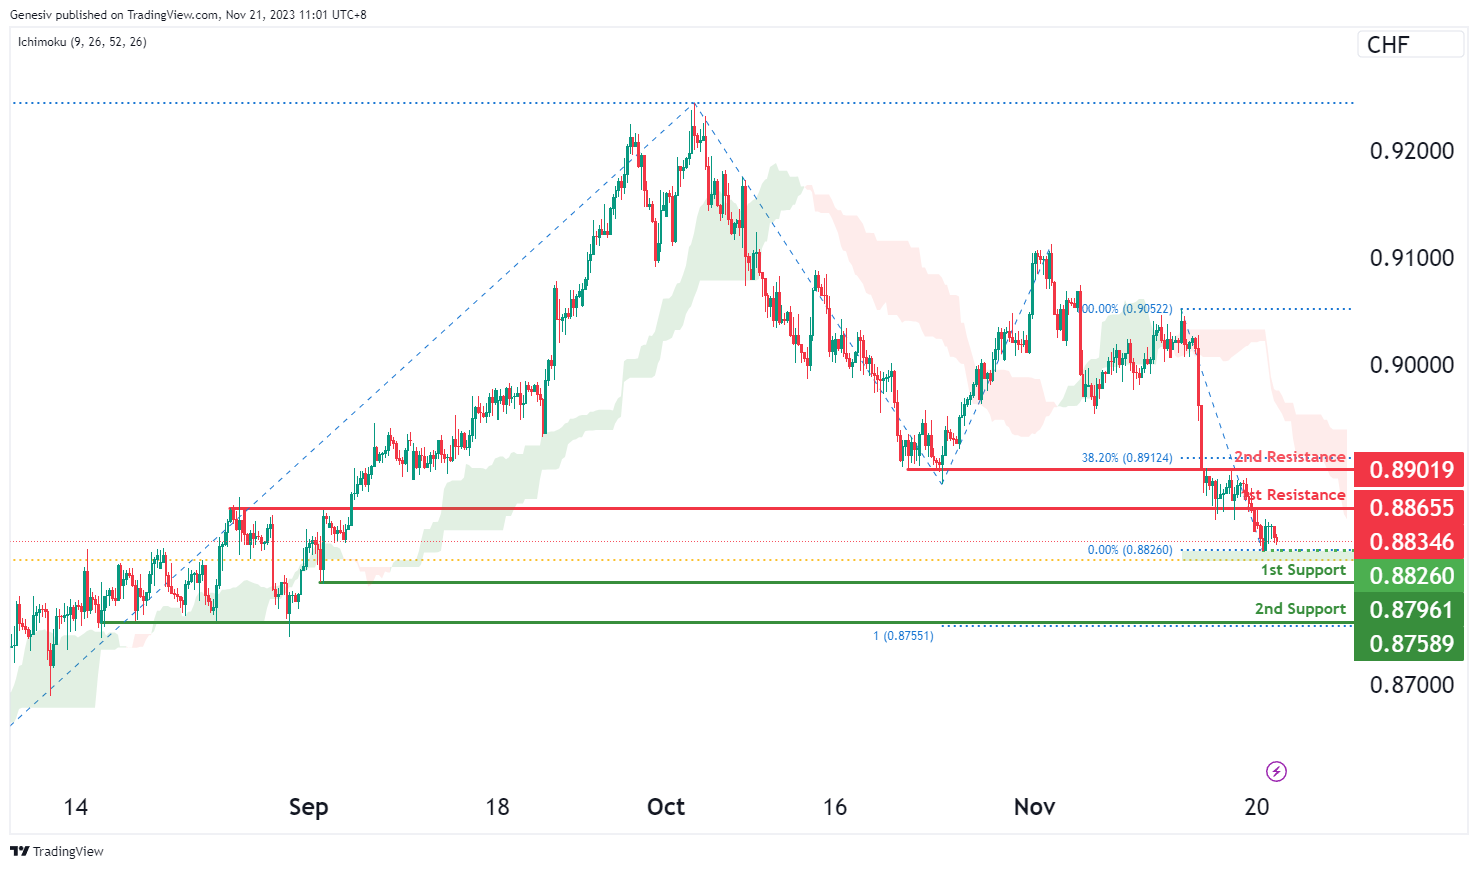
USD/CHF's decline is still in progress and intraday bias stays on the downside. Current fall from 0.9243 should target 100% projection of 0.9243 to 0.8886 from 0.9111 at 0.8754 next. On the upside, above 0.8898 minor resistance will turn intraday bias neutral and bring consolidations again. But in case of recovery, outlook will stay bearish as long as 0.8952 support turned resistance holds.
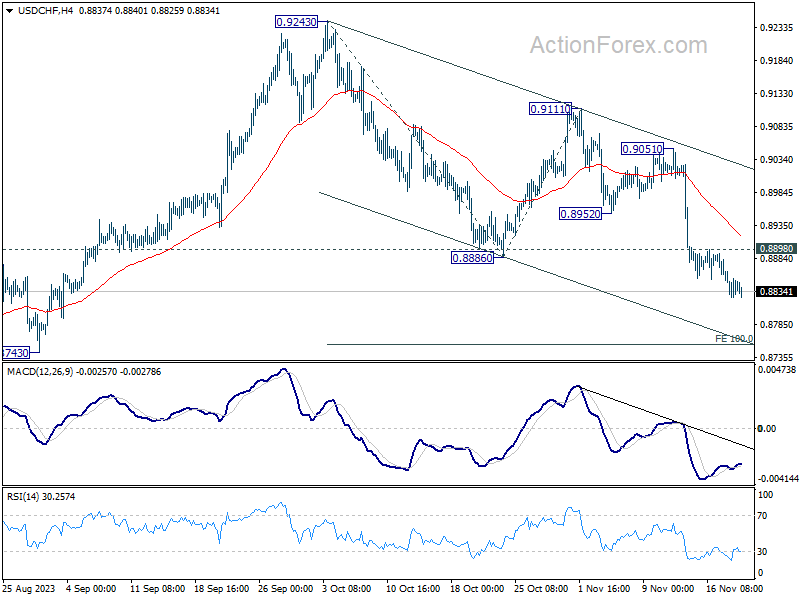
In the bigger picture, price actions from 0.8551 are currently seen as part of a corrective pattern to the decline from 1.0146 (2022 high). Fall from 0.9243 is seen as the second leg for now. Deeper fall would be seen to 61.8% retracement of 0.8551 to 0.9243 at 0.8815. Sustained break there will bring retest of 0.8551 low. For now, this will remain the favored case as long as 0.9111 resistance holds.
USD/CAD Daily Outlook
Daily Pivots: (S1) 1.3694; (P) 1.3722; (R1) 1.3754; More...
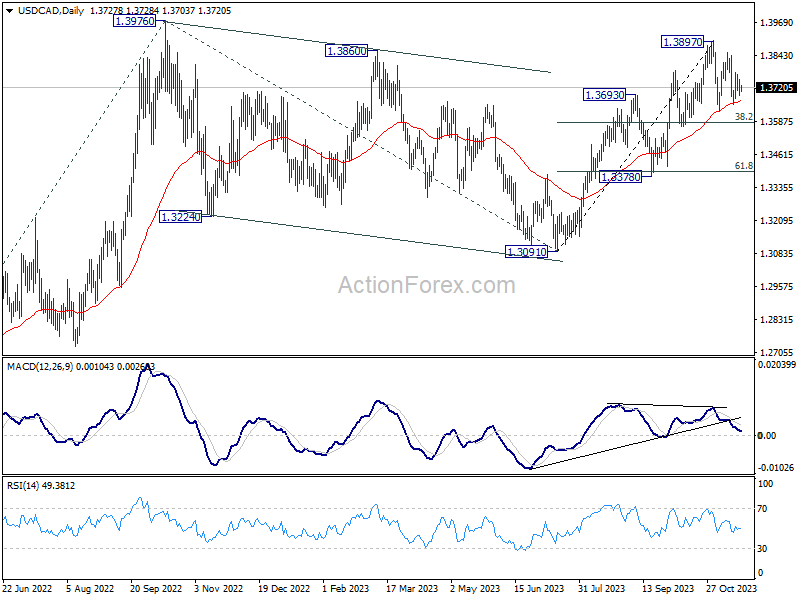
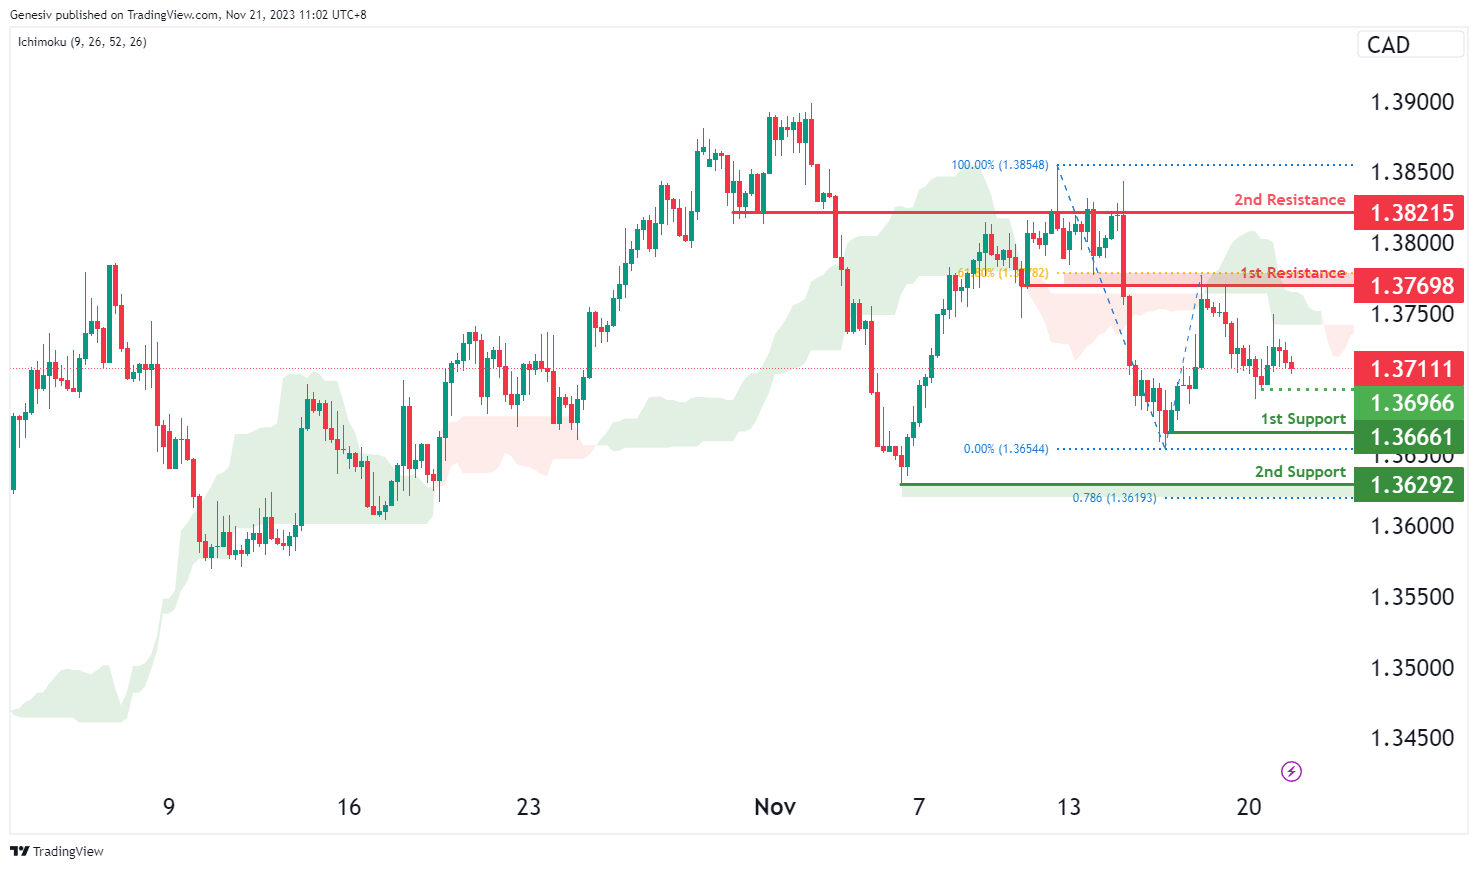
Range trading continues in USD/CAD and intraday bias stays neutral. While another fall cannot be ruled out, downside should be contained by 38.2% retracement of 1.3091 to 1.3897 at 1.3589 to bring rebound. Break of 1.3897 is expected at a later stage to resume larger rally.
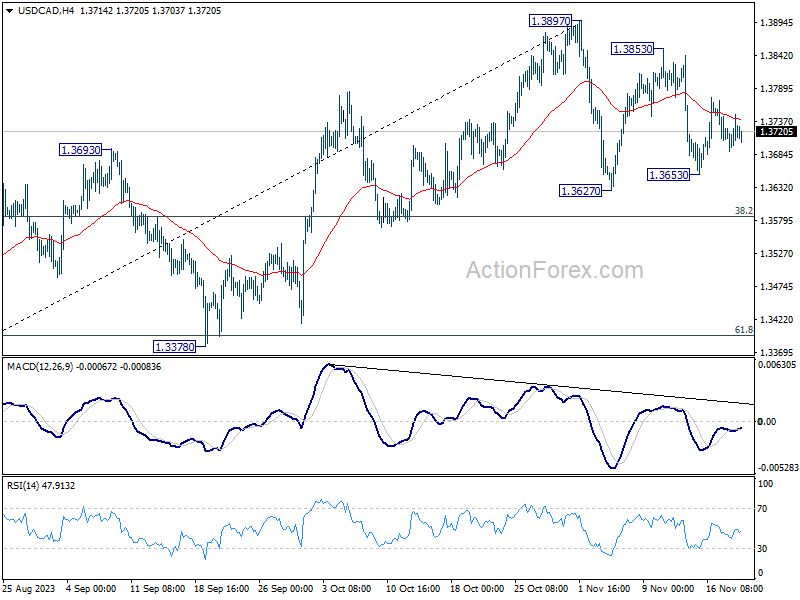
In the bigger picture, corrective pattern from 1.3976 (2022 high) should have completed with three waves down to 1.3091. Decisive break of 1.3976 high will confirm resumption of up trend from 1.2005 (2021 low). Next target is 61.8% projection of 1.2401 to 1.3976 from 1.3091 at 1.4064. This will remain the favored case as long as 1.3378 support holds.
RBA Minutes November 2023: It’s Mostly About Mindset
The RBA minutes contained little new information given recent publications and speeches. Inflation is not coming down as fast as the RBA would like. The upside surprise is attributed to domestic factors more so than the earlier global shocks. Domestic demand has been a bit more resilient than expected, outside the consumer sector, at least. The Board is becoming concerned that businesses are developing an inflationary mindset.
The RBA minutes contained little new information given the Statement on Monetary Policy and a speech by Acting Assistant Governor Kohler had already provided considerable detail on the forecasts and the policy decision.
Inflation is declining but underlying inflation (i.e., trimmed mean) has declined more slowly than expected a year ago. Domestic demand and the labour market have been a bit more resilient than the RBA expected, though it should be noted that the upside surprise has been outside the consumer sector. Population growth has been stronger than expected as student numbers recovered after the borders reopened. But foreign students’ spending counts as services exports not consumption. Given the squeeze on real household incomes from inflation and higher interest rates, consumption over the past year has been weak and largely in line with the RBA’s earlier forecasts.
In light of the more resilient labour market, the RBA lowered its forecasts for unemployment for 2025. Some of this reflects a judgement that more of the slowing in the economy will be seen in average hours worked and underemployment rather than job losses and unemployment. This is a judgement, though, and it remains to be seen if this will play out as the RBA expects. There is also an open question of whether business investment will continue to be as resilient in future as it was in the first half of 2023. Our own forecasts embed a view that some of this surprising strength was a bring-forward of spending to take advantage of tax concessions, as well as some catch-up as supply chain disruptions eased.
A puzzle in the RBA’s explanation of its forecast moves is the choice of the November 2022 forecasts as the point of comparison. This is partly a legacy of the RBA’s annual review cycle for its forecasting process, but it tends to overstate the recency of some of the surprise. The November 2022 forecasts were for trimmed mean inflation to be 5.4% over the year to June 2023, 3.8% for calendar 2023 and 3.2% for calendar 2024. This compares with the 5.9% outcome for the year to June 2023, 4.5% for 2023 overall and 3.3% for 2024, a material near-term upgrade. But most of that upgrade had already happened in the February forecasts: 6.2% for year to June 2023, 4.3% for 2023 and 3.1% for 2024. Policy had already responded to that upgrade. From this we can infer that the RBA put considerable weight on the miss for September quarter, which we think was likely to be a 0.9% quarterly read in their August forecasts, versus the 1.2% outcome.
Although the RBA now assesses risks of a price–wage spiral as having diminished, the Board is becoming increasingly concerned about the prospect of higher inflation expectations becoming embedded in business behaviour. The minutes point to the “slight upward drift” in financial market measures of expectations. It was noted that “If sustained, this would contribute to higher inflation” and “would create a risk that a larger monetary policy response might be required in coming months, especially if inflation pressures turned out to be stronger than expected.” This makes a lot of an imperfect measure that keys off the views of people who do not actually set the prices of goods and services. In drawing such a long bow, the Board is highlighting the degree of its concern. The minutes also report that RBA staff presented a scenario showing the effects of a “modest” increase in inflation expectations on the inflation outlook. Unsurprisingly, it showed that this would make it “significantly” harder to get inflation back to target.
Related to this, a noteworthy shift in language was the comment, “Furthermore, members noted growing signs of a mindset among businesses that any cost increases could be passed onto consumers. In this environment, members assessed that tightening monetary policy at this meeting would help to mitigate the risk of an unwelcome rise in inflation expectations.” If any cost increases were being passed on, it is not clear why goods inflation has declined as expected but services inflation has not. Goods prices at the consumer level still embody a considerable fraction of domestic costs, including labour.
The concern about past-through of costs is reminiscent of a line from the February 2023 Statement on Monetary Policy Overview. “[The Board] will be closely monitoring how quickly declines in global costs are passed through to prices by businesses in Australia.” But that was about global costs, not domestic costs, which seem to have become more prominent in the Board’s thinking. The other awkwardness here is that it is households, not businesses, feeling most of the pressure of higher rates, and who in some cases stand to lose their jobs as tighter monetary policy takes effect.
The minutes were a bit more explicit about the path for the cash rate assumed in constructing the forecasts, incorporating “one to two increases in the cash rate”. These assumptions are based on market pricing and the forecasts of market economists. One of these “one to two” increases was delivered following the meeting, so there is only about half a rate rise assumed in the forecasts from here. Given the relatively small effect of single rate increases on inflation assumed in the RBA’s forecasting models, a further rate rise is not baked in. Rather, as we have said previously, the RBA will act if they observe further upward surprises on the outlook for demand and inflation. Unless they continue to be surprised in the way they have recently, they are likely to be on hold, but every meeting next year should be considered “live”. As the minutes acknowledged, the Board has low tolerance for any further upside surprises or delays in the return of inflation to the target range.
Technical Outlook and Review
DXY:
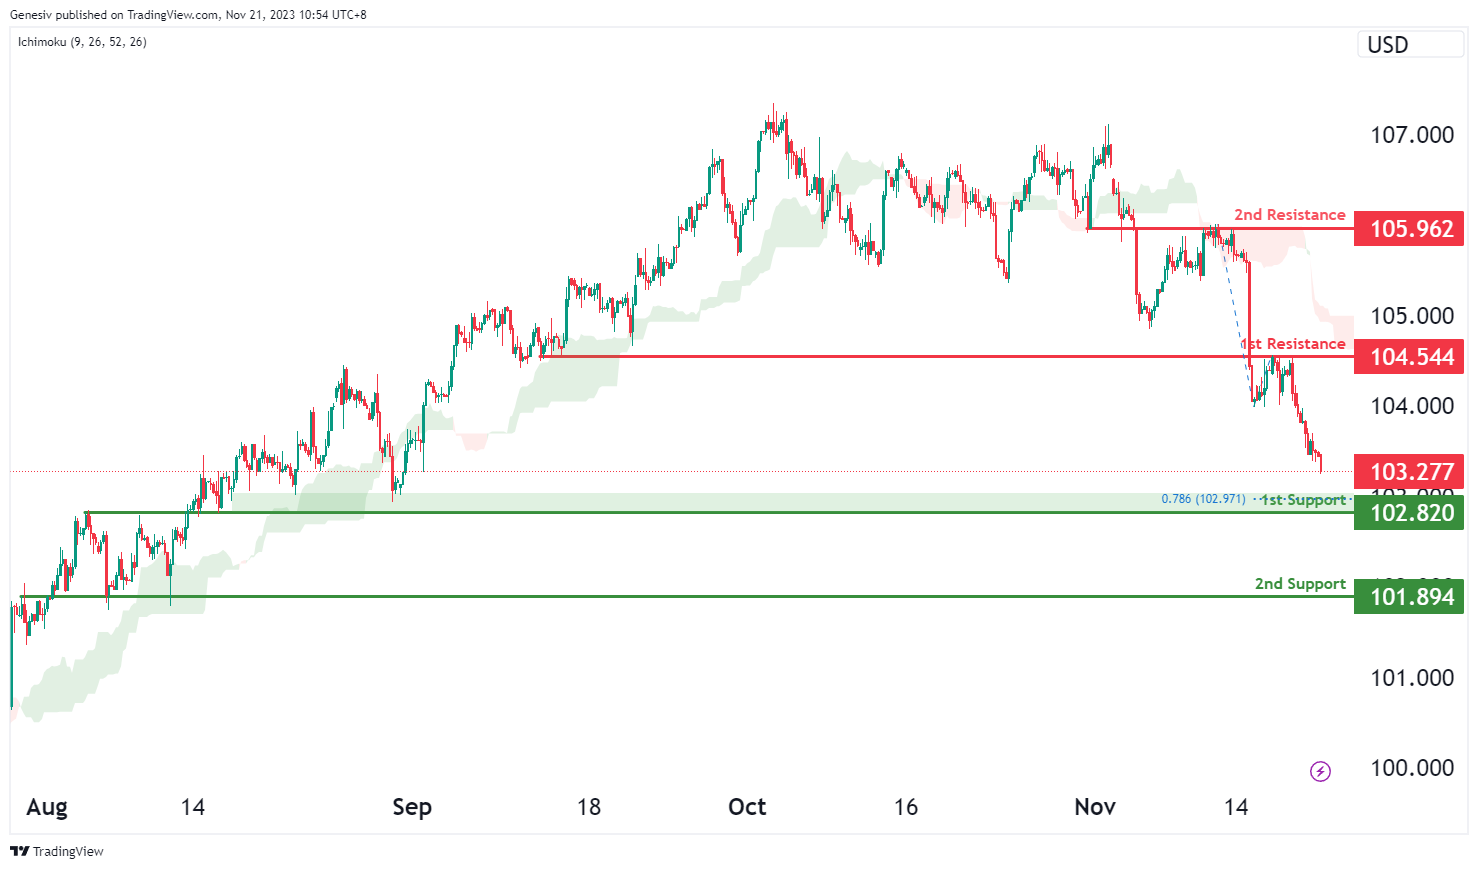
The DXY (US Dollar Index) chart currently has an overall bearish overall momentum, suggesting the potential for a bearish continuation towards the 1st support.
The 1st support level at 102.82 is identified as an overlap support that coincides with the 78.60% Fibonacci projection level. Further below, the 2nd support level at 101.89 is also marked an overlap support, further reinforcing its potential as a support level.
On the resistance side, the 1st resistance level at 104.54 is categorized as an overlap resistance. Higher up, the 2nd resistance level at 105.96 is also noted as an overlap resistance, potentially acting as a barrier to further upward movement.
EUR/USD:
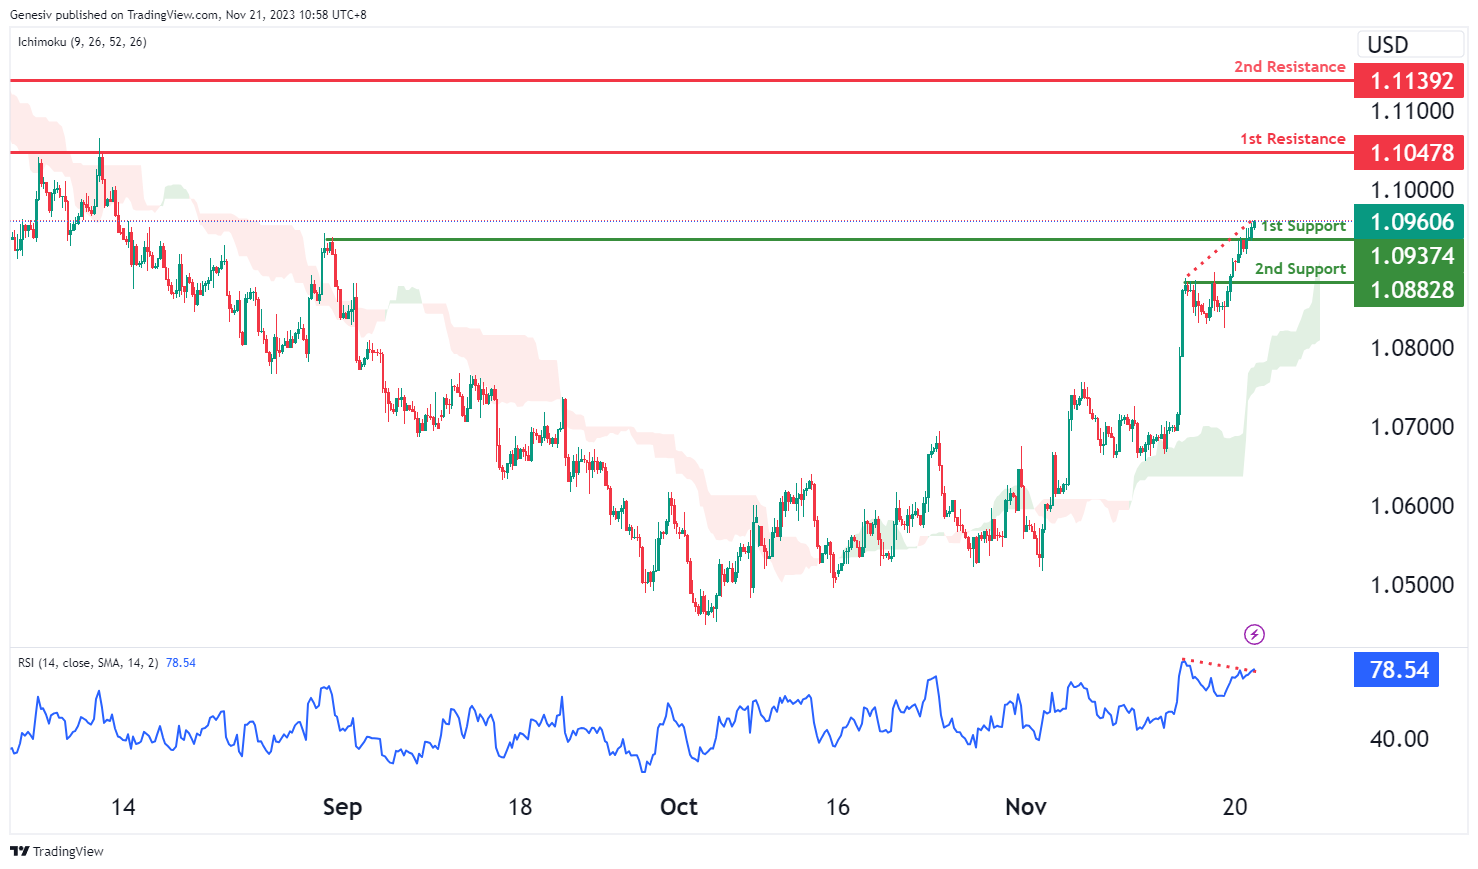
The EUR/USD chart currently has an overall bullish momentum, suggesting a potential for a bullish continuation towards the 1st resistance. However, the Relative Strength Index (RSI) is showing a bearish divergence versus the price, suggesting a potential scenario for price to reverse and fall lower.
The 1st support level at 1.0937 is identified as a pullback support. Further below, the 2nd support level at 1.0883 is also marked as a pullback support, indicating a level where the bearish movement could be halted.
On the resistance side, the 1st resistance level at 1.1048 is identified as a pullback resistance. Higher up, the 2nd resistance level at 1.1139 is also marked as a pullback resistance, further reinforcing its potential as a resistance zone.
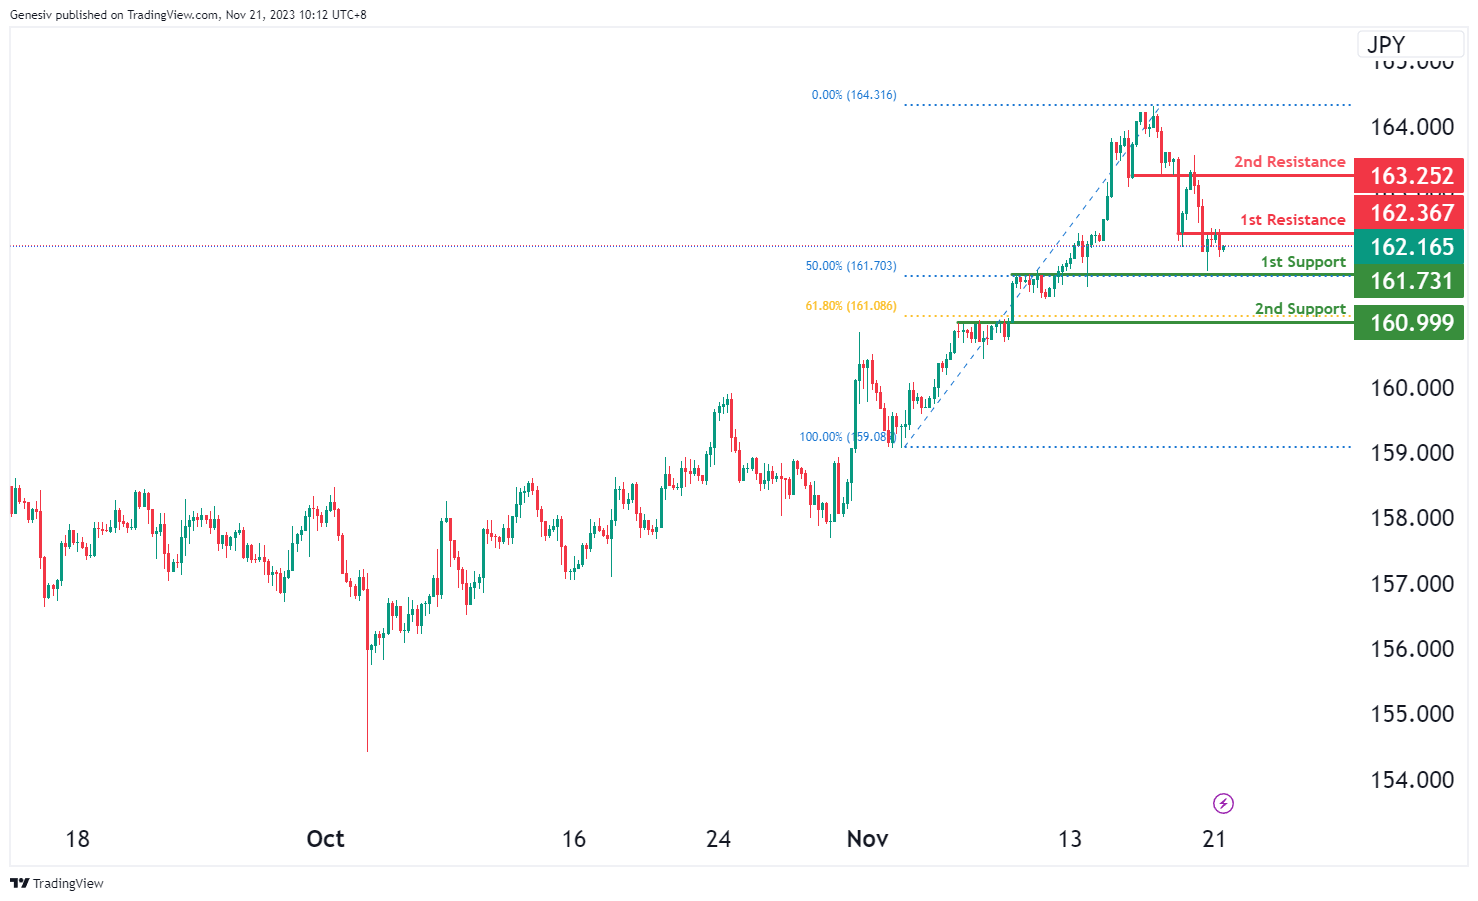
EUR/JPY:
The EUR/JPY chart currently suggests a bearish momentum, indicating a potential bearish continuation towards the first support at 161.73.
The first support at 161.73 is identified as a pullback support, coinciding with the 50% Fibonacci Retracement. This suggests a strong level of potential support, indicating an area where the price might find buying interest.
Additionally, the second support at 160.99 is recognized as another pullback support, reinforcing the potential strength of the support zone with the 61.80% Fibonacci Retracement.
On the resistance side, the first resistance at 162.36 is significant due to its overlap resistance, marking a crucial level where the price might face selling pressure or potential reversals within its bearish movement. Furthermore, the second resistance at 163.25 is identified as another overlap resistance, emphasizing its importance as a potential hurdle for the price and a point where it might encounter obstacles in its bearish continuation.
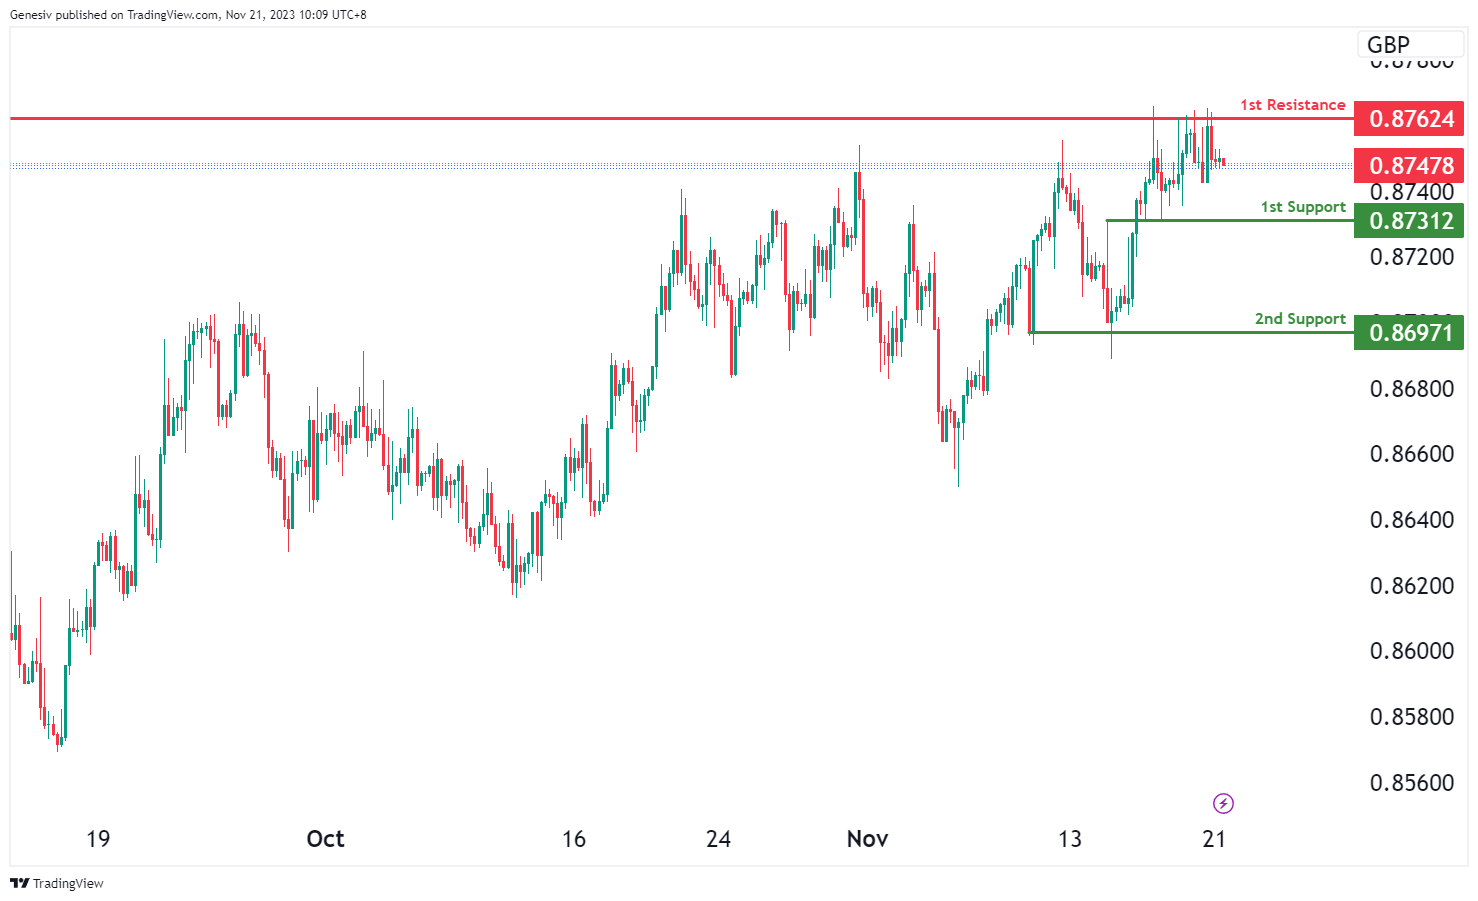
EUR/GBP:
The EUR/GBP chart currently indicates a bearish momentum, suggesting a potential bearish continuation towards the first support at 0.8731.
The first support at 0.8731 is identified as a pullback support, indicating a level where the price might find buying interest. Additionally, the second support at 0.8697 is recognized as a multi-swing low support, reinforcing the potential strength of the support zone.
On the resistance side, the first resistance at 0.8762 is significant due to its overlap resistance, marking a crucial level where the price might face selling pressure or potential reversals within its downward movement.
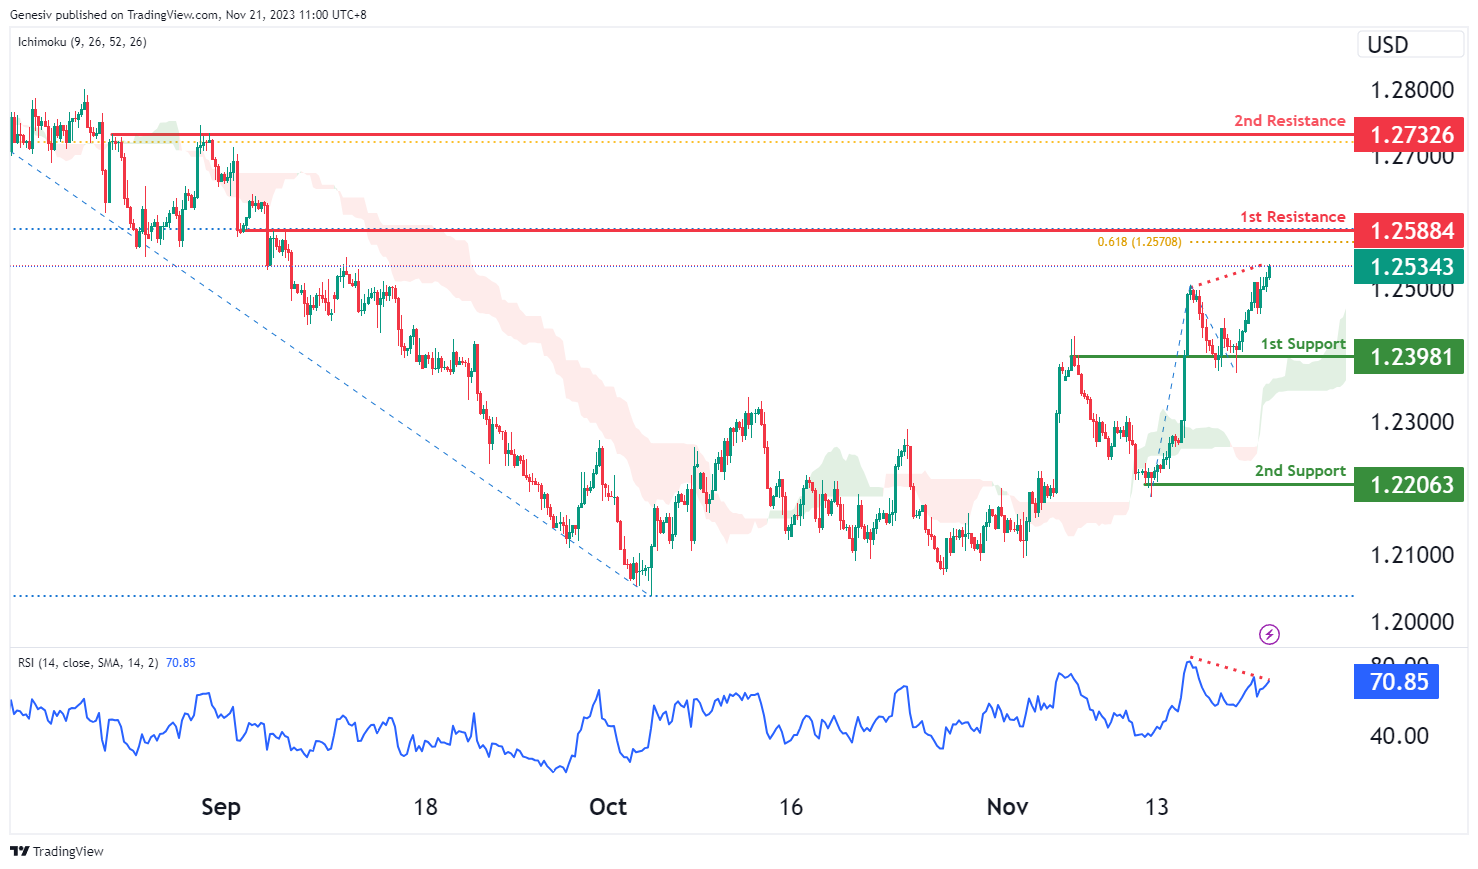
GBP/USD:
The GBP/USD chart currently has an overall bullish momentum, suggesting a potential for a bullish continuation towards the 1st resistance. However, the Relative Strength Index (RSI) is showing a bearish divergence versus the price, suggesting a potential scenario for price to reverse and fall lower.
The 1st support level at 1.2398 is identified as an overlap support. Further below, the 2nd support level at 1.2206 is marked as a pullback support, indicating a level where the bearish movement could be halted.
On the resistance side, the 1st resistance level at 1.2588 is identified as an overlap resistance that aligns with a confluence of Fibonacci levels i.e. the 50.00% retracement and the 61.80% projection levels. Higher up, the 2nd resistance level at 1.2733 is marked as a pullback resistance that aligns with the 61.80% Fibonacci retracement level, further reinforcing its potential as a resistance level.
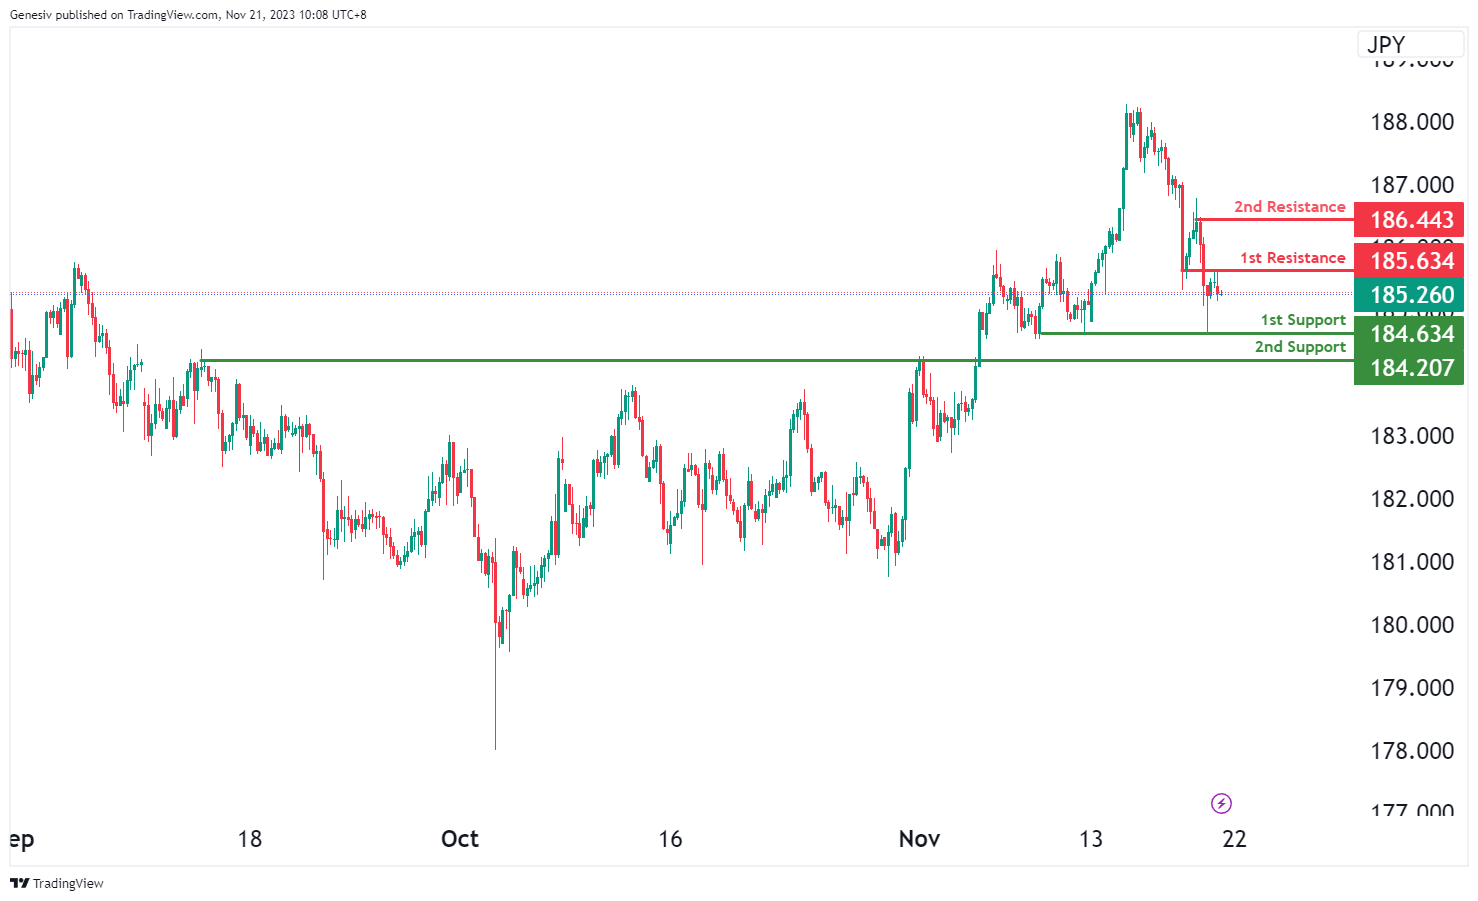
GBP/JPY:
The GBP/JPY chart currently indicates a bearish momentum, suggesting a potential bearish continuation towards the first support at 184.63.
The first support at 184.63 is identified as a multi-swing low support, indicating a level where the price might find buying interest. Additionally, the second support at 184.20 is recognized as a pullback support, reinforcing the potential strength of the support zone.
On the resistance side, the first resistance at 185.63 is significant due to its overlap resistance, marking a crucial level where the price might face selling pressure or potential reversals within its downward movement. Furthermore, the second resistance at 186.44 is identified as a swing high resistance, emphasizing its importance as a potential hurdle for the price and a point where it might encounter obstacles in its bearish continuation.
USD/CHF:
The USD/CHF chart currently has an overall bearish momentum, suggesting the potential for price to make a bearish continuation towards the 1st support should price break below the intermediate support.
The intermediate support level at 0.8826 is identified as a pullback support that aligns close to the 61.80% Fibonacci retracement level while the 1st support level at 0.8796 is also identified as a pullback support. Further below, the 2nd support level at 0.8759 is marked as a pullback support that aligns with the 100.00% Fibonacci projection level, suggesting a significant level of support.
To the upside, the 1st resistance level at 0.8866 is categorized as an overlap resistance. Higher up, the 2nd resistance level at 0.8902 is also marked as an overlap resistance that aligns close to the 38.20% Fibonacci retracement level, indicating a potential area where price could halt its bullish momentum.
USD/JPY:
The USD/JPY chart currently has an overall bearish momentum, suggesting the potential for a bearish continuation towards the 1st support.
The 1st support level at 147.49 is identified as an overlap support that coincides with the 161.80% Fibonacci extension level. Further below, the 2nd support level at 146.19 is noted as a pullback support that aligns with the 38.20% Fibonacci retracement level, potentially acting as a strong barrier against further bearish momentum.
On the resistance side, the intermediate resistance level at 148.55 is identified as a pullback resistance while the 1st resistance level at 149.02 is also categorized as a pullback resistance.Higher up, the 2nd resistance level at 150.38 is noted as a pullback resistance, potentially acting as a barrier to further upward movement.
USD/CAD:
The USD/CAD chart currently exhibits an overall bearish momentum, indicating the potential for a bearish continuation towards the 1st support should price break below the intermediate support.
The intermediate support level at 1.3697 is identified as a pullback support while the 1st support level at 1.3666 is also considered as a pullback support. Further below, the 2nd support level at 1.3629 is identified as a swing-low support that aligns with the 78.60% Fibonacci projection level, further reinforcing the potential for price to find support in this region.
On the resistance side, the 1st resistance level at 1.3769 is categorized as an overlap resistance that aligns close to the 61.80% Fibonacci retracement level. Higher up, the 2nd resistance level at 1.3822 is also noted as an overlap resistance, potentially acting as a barrier to further upward movement.
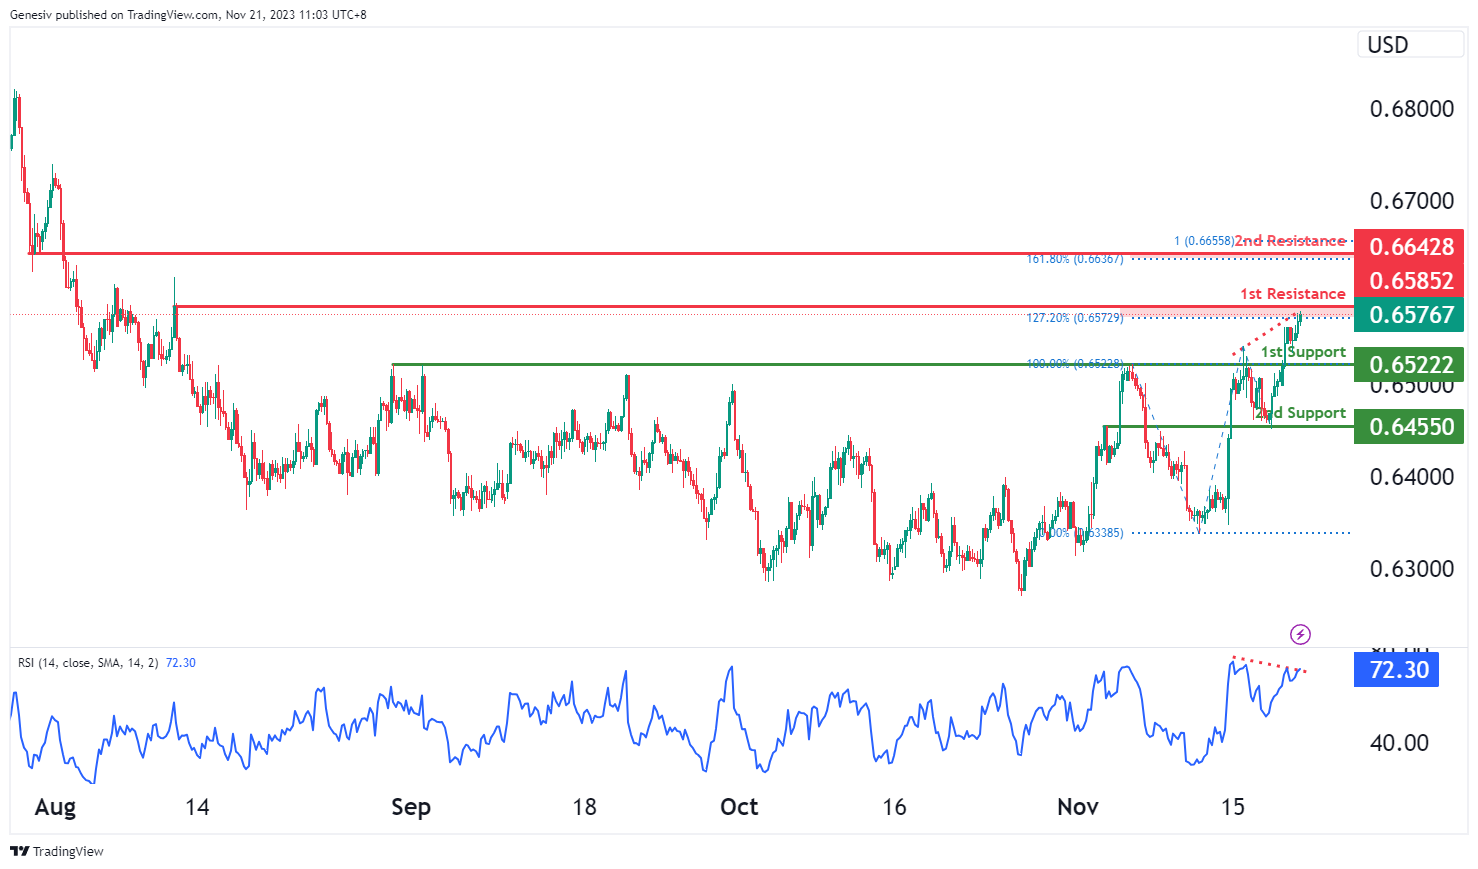
AUD/USD:
The AUD/USD chart currently has overall bullish momentum, suggesting the potential for a bullish continuation towards the 1st resistance. However, the Relative Strength Index (RSI) is showing a bearish divergence versus the price, suggesting a potential scenario for price to reverse and fall lower.
The 1st resistance level at 0.6585 is categorized as a pullback resistance that coincides with the 127.20% Fibonacci extension level. Higher up, the 2nd resistance level at 0.6643 is also noted as a pullback resistance that coincides with the 16.80% Fibonacci extension level, indicating a potential level where price may halt its bullish momentum.
To the downside, the 1st support level at 0.6522 is identified as a pullback support. Further below, the 2nd support level at 0.6455 is noted as an overlap support, indicating a zone where price may find strong support.
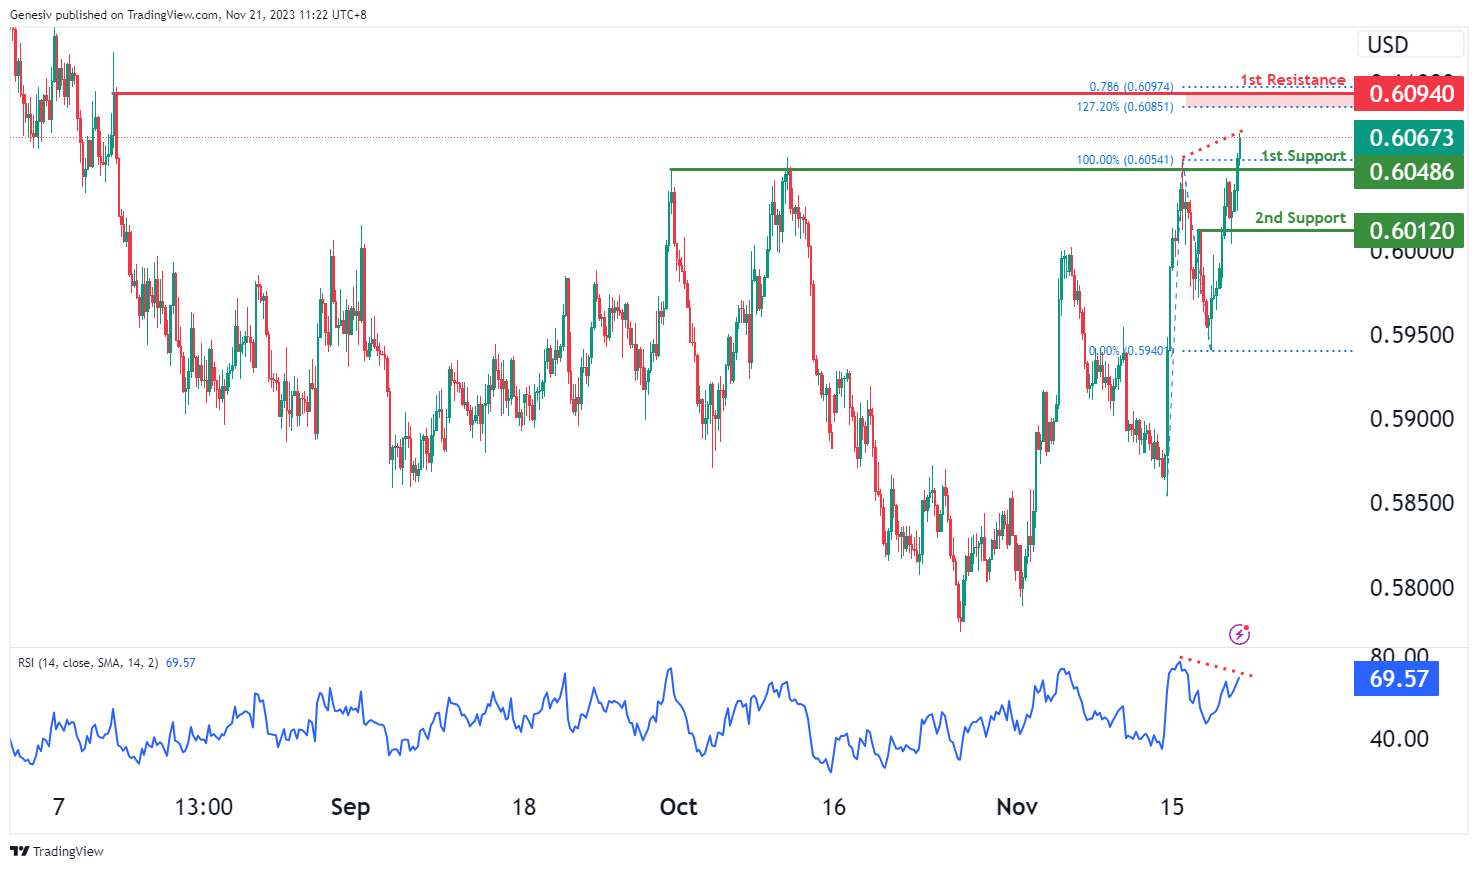
NZD/USD
The NZD/USD chart currently has an overall bullish momentum, suggesting the potential for a bullish continuation towards the 1st resistance. However, the Relative Strength Index (RSI) is showing a bearish divergence versus the price, suggesting a potential scenario for price to reverse and fall lower.
The 1st support at 0.6049 is identified as a pullback support. Further below, the 2nd support level at 0.6012 is noted as an overlap support where price may potentially find strong support around this zone.
To the upside, the 1st resistance level at 0.6094 is categorized as a pullback resistance that aligns with a confluence of Fibonacci levels i.e. the 127.20% extension and the 78.60% projection levels, potentially acting as a barrier to further upward movement.
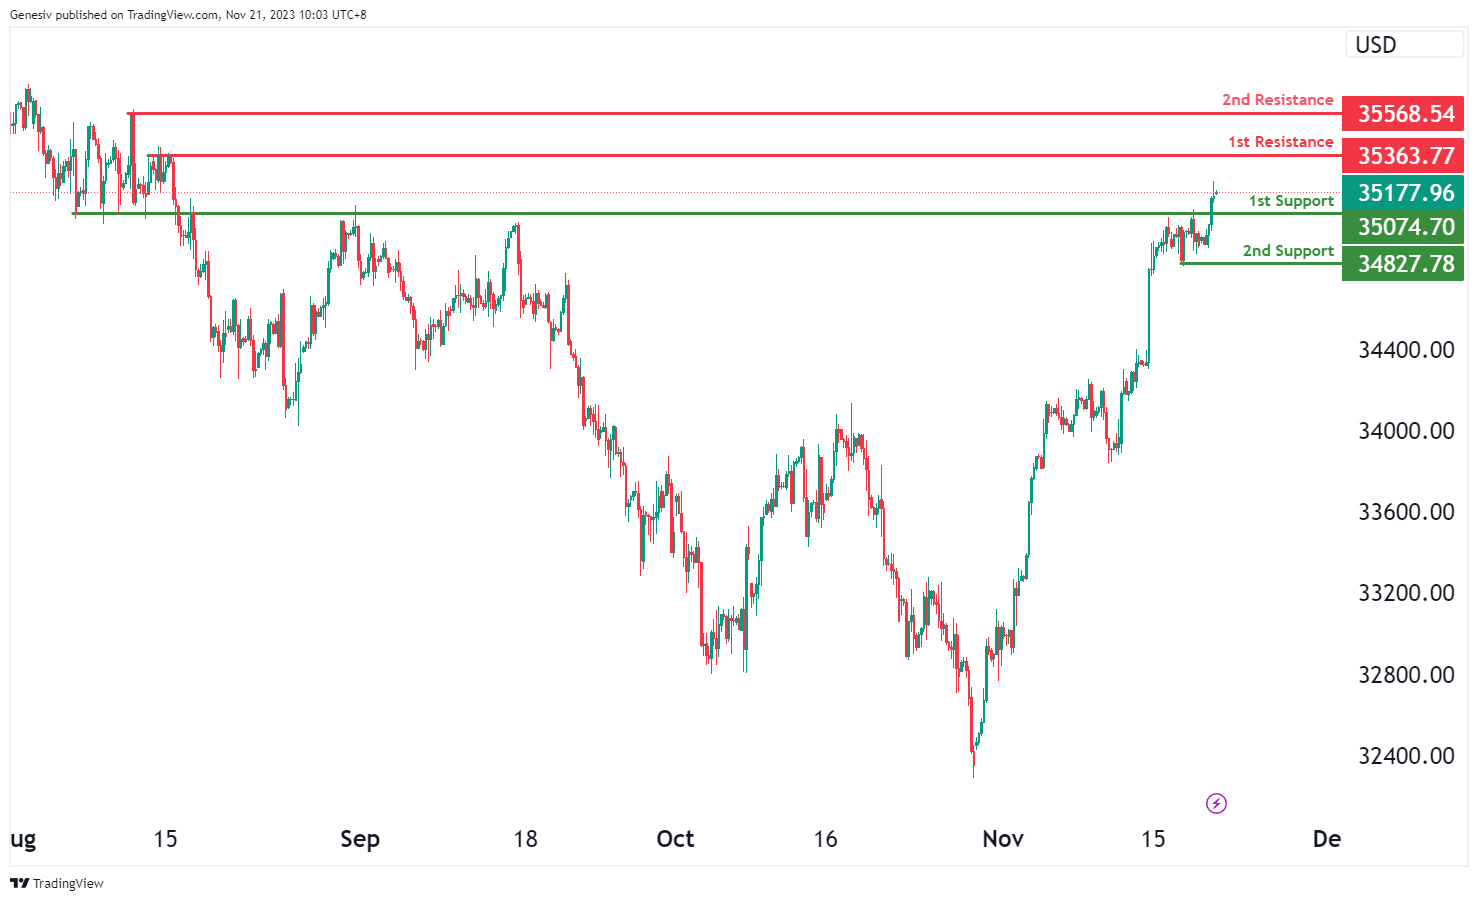
DJ30:
The DJ30 chart currently indicates a bullish momentum, suggesting a potential bullish continuation towards the first resistance at 35363.77.
The first support at 35074.70 is identified as a pullback support, indicating a level where the price might find buying interest. Additionally, the second support at 34827.78 is recognized as a swing low support, reinforcing the potential strength of the support zone.
On the resistance side, the first resistance at 35363.77 is significant due to its multi-swing high resistance, marking a crucial level where the price might face selling pressure or potential reversals within its upward movement. Furthermore, the second resistance at 35568.54 is identified as a swing high resistance, emphasizing its importance as a potential hurdle for the price and a point where it might encounter obstacles in its bullish continuation.
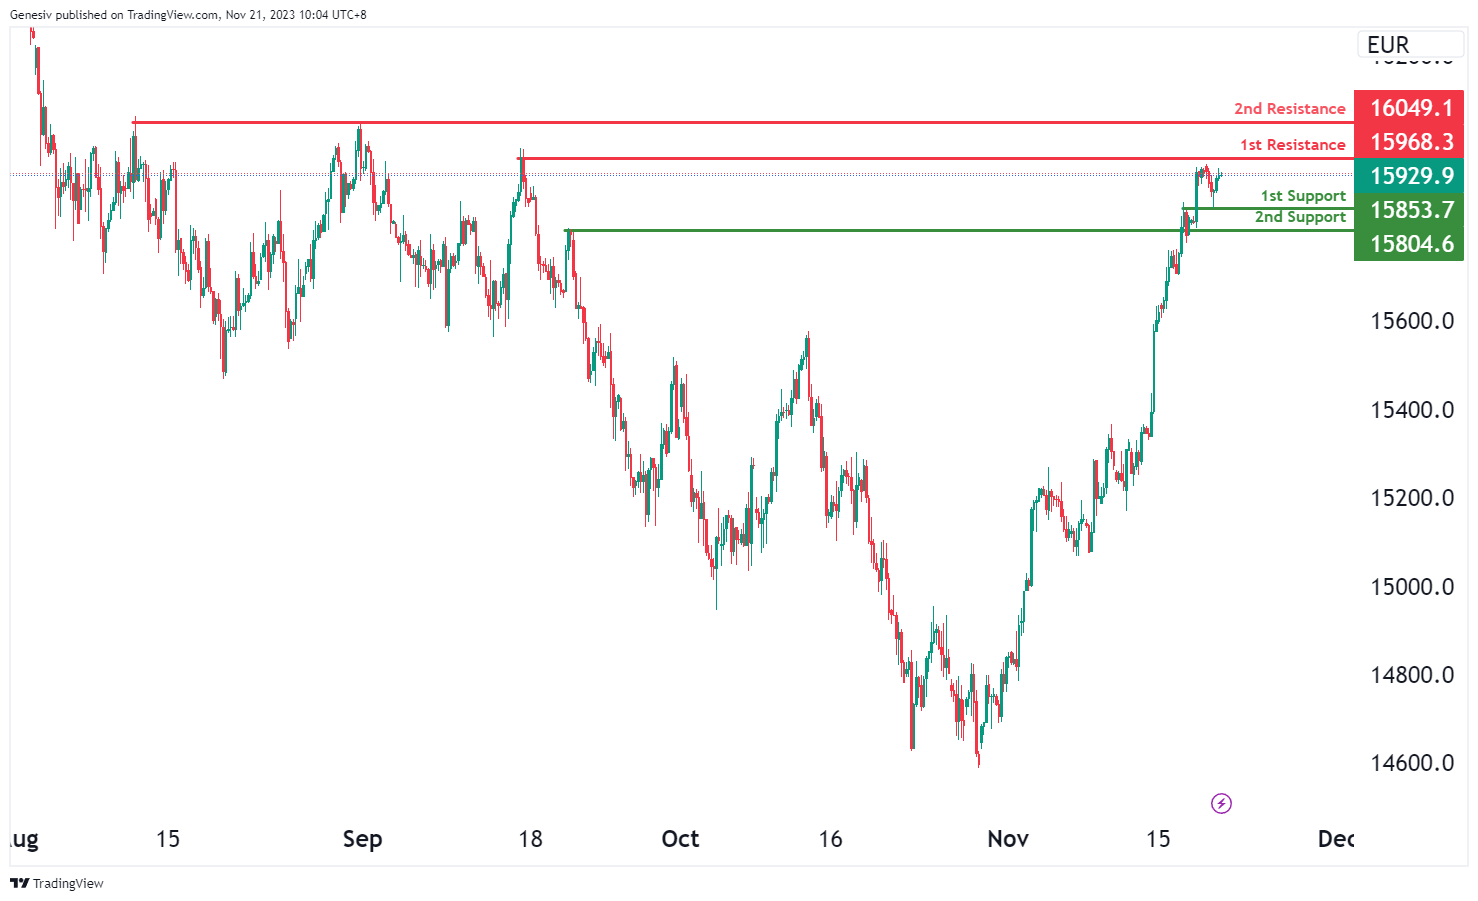
GER40:
The GER40 chart currently indicates a bullish momentum, suggesting a potential bullish continuation towards the first resistance at 15968.3.
The first support at 15853.7 is identified as an overlap support, indicating a level where the price might find buying interest. Additionally, the second support at 15804.6 is recognized as another overlap support, reinforcing the potential strength of the support zone.
On the resistance side, the first resistance at 15968.3 is significant due to its swing high resistance, marking a crucial level where the price might face selling pressure or potential reversals within its upward movement. Furthermore, the second resistance at 16049.1 is identified as a multi-swing high resistance, emphasizing its importance as a potential hurdle for the price and a point where it might encounter obstacles in its bullish continuation.
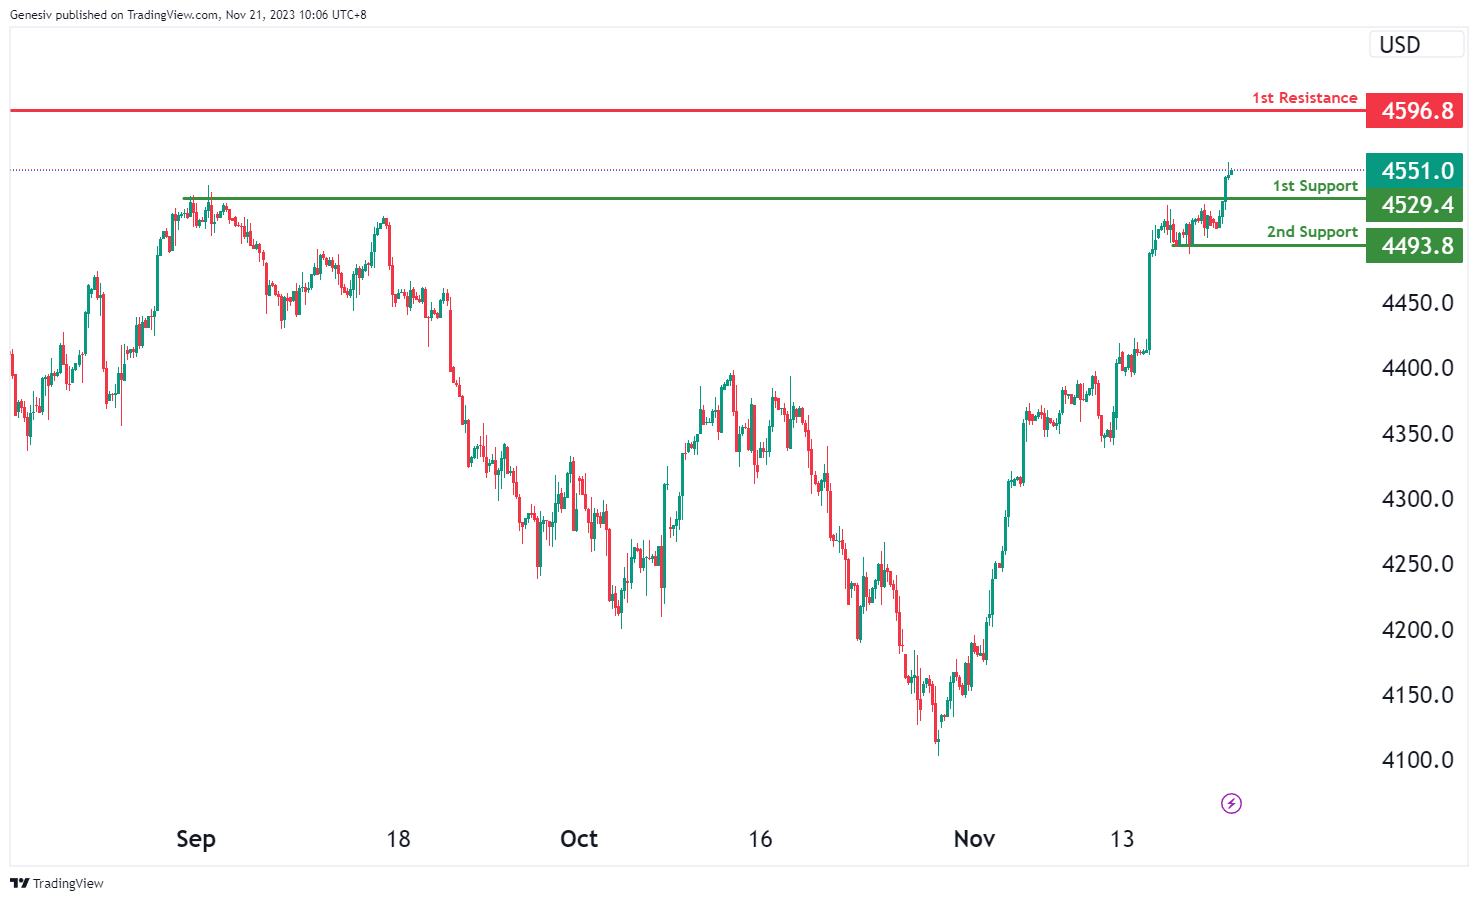
US500
The US500 chart currently indicates a bullish momentum, suggesting a potential bullish continuation towards the first resistance at 4596.8.
The first support at 4529.4 is identified as a pullback support, indicating a level where the price might find buying interest. Additionally, the second support at 4493.8 is recognized as a multi-swing low support, reinforcing the potential strength of the support zone.
On the resistance side, the first resistance at 4596.8 is significant due to its swing high resistance, marking a crucial level where the price might face selling pressure or potential reversals within its upward movement.
BTC/USD:
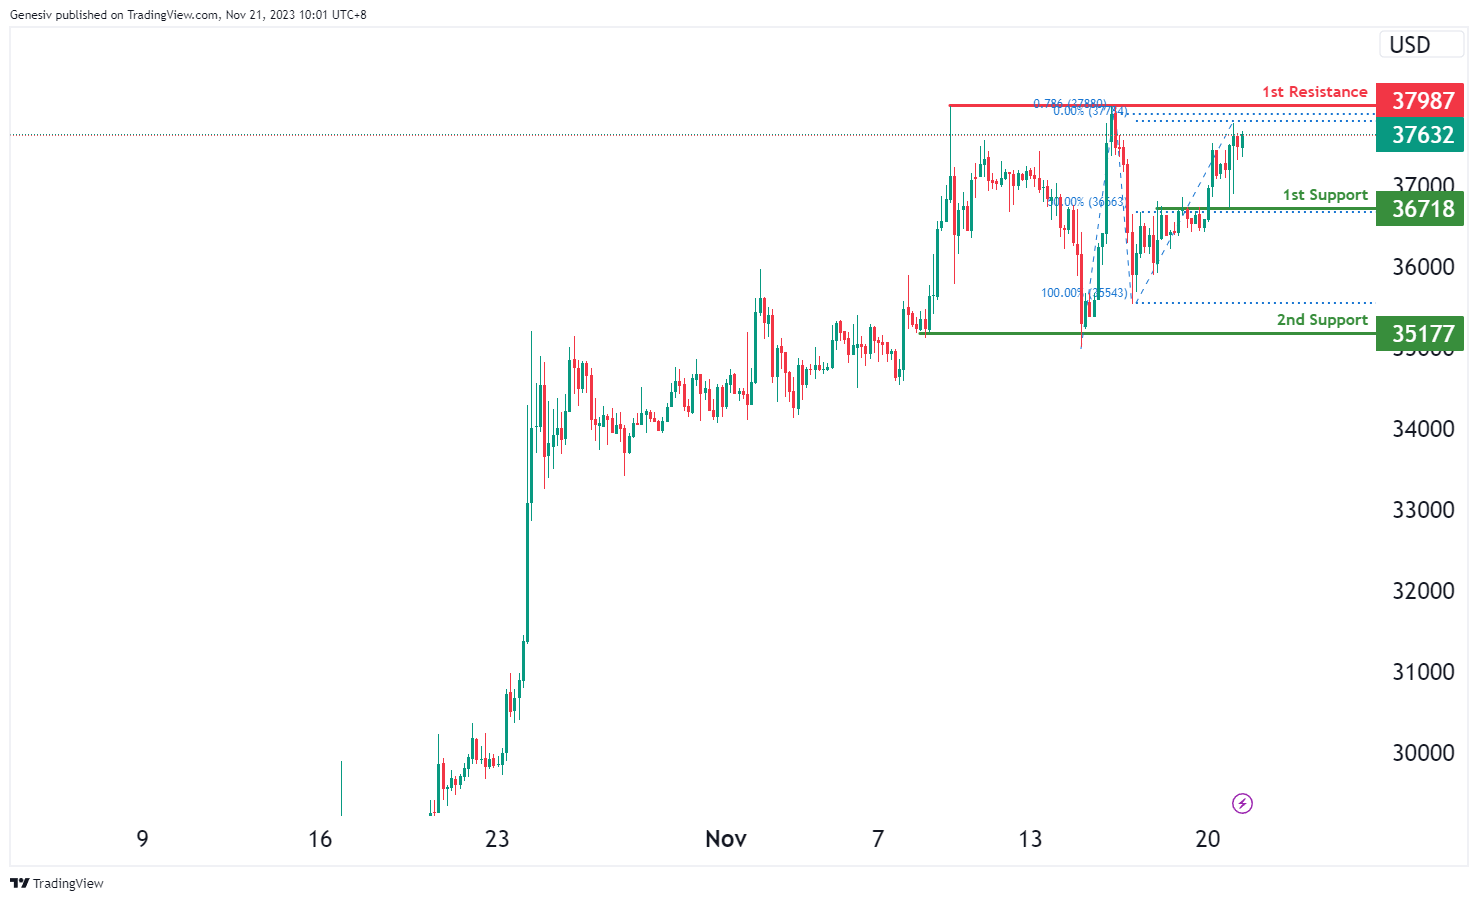
The BTC/USD chart currently exhibits a bullish momentum, indicating a potential bullish continuation towards the first resistance at 37987.
The first support at 36718 is identified as an overlap support, coinciding with the 50% Fibonacci Retracement. This suggests a strong level of potential support, indicating an area where the price might find buying interest.
Additionally, the second support at 35177 is recognized as a multi-swing low support, further reinforcing the potential strength of the support zone.
On the resistance side, the first resistance at 37987 is significant due to its multi-swing high resistance, and it aligns with the 78.60% Fibonacci Projection. This indicates a crucial level where the price might face selling pressure or potential reversals within its upward movement.
ETH/USD:
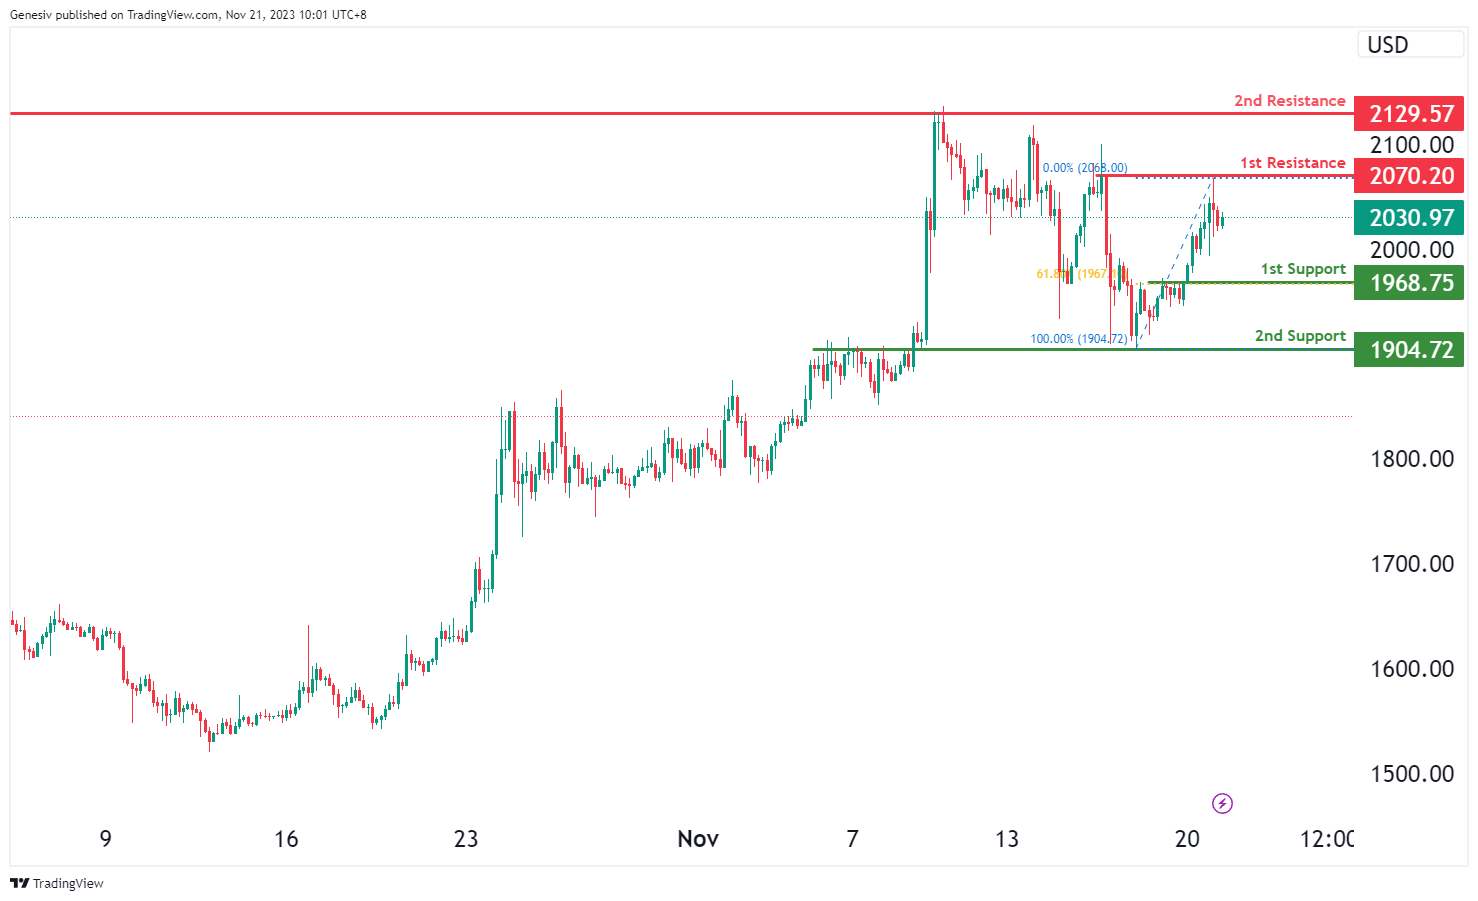
The ETH/USD chart currently indicates a bullish momentum, suggesting a potential bullish continuation towards the first resistance at 2070.20.
The first support at 1968.75 is identified as a pullback support, coinciding with the 61.80% Fibonacci Retracement. This suggests a strong level of potential support, indicating an area where the price might find buying interest.
Additionally, the second support at 1904.72 is recognized as an overlap support, further reinforcing the potential strength of the support zone.
On the resistance side, the first resistance at 2070.20 is significant due to its multi-swing high resistance, marking a crucial level where the price might face selling pressure or potential reversals within its upward movement. Furthermore, the second resistance at 2129.57 is identified as another multi-swing high resistance, emphasizing its importance as a potential hurdle for the price and a point where it might encounter obstacles in its bullish continuation.
WTI/USD:
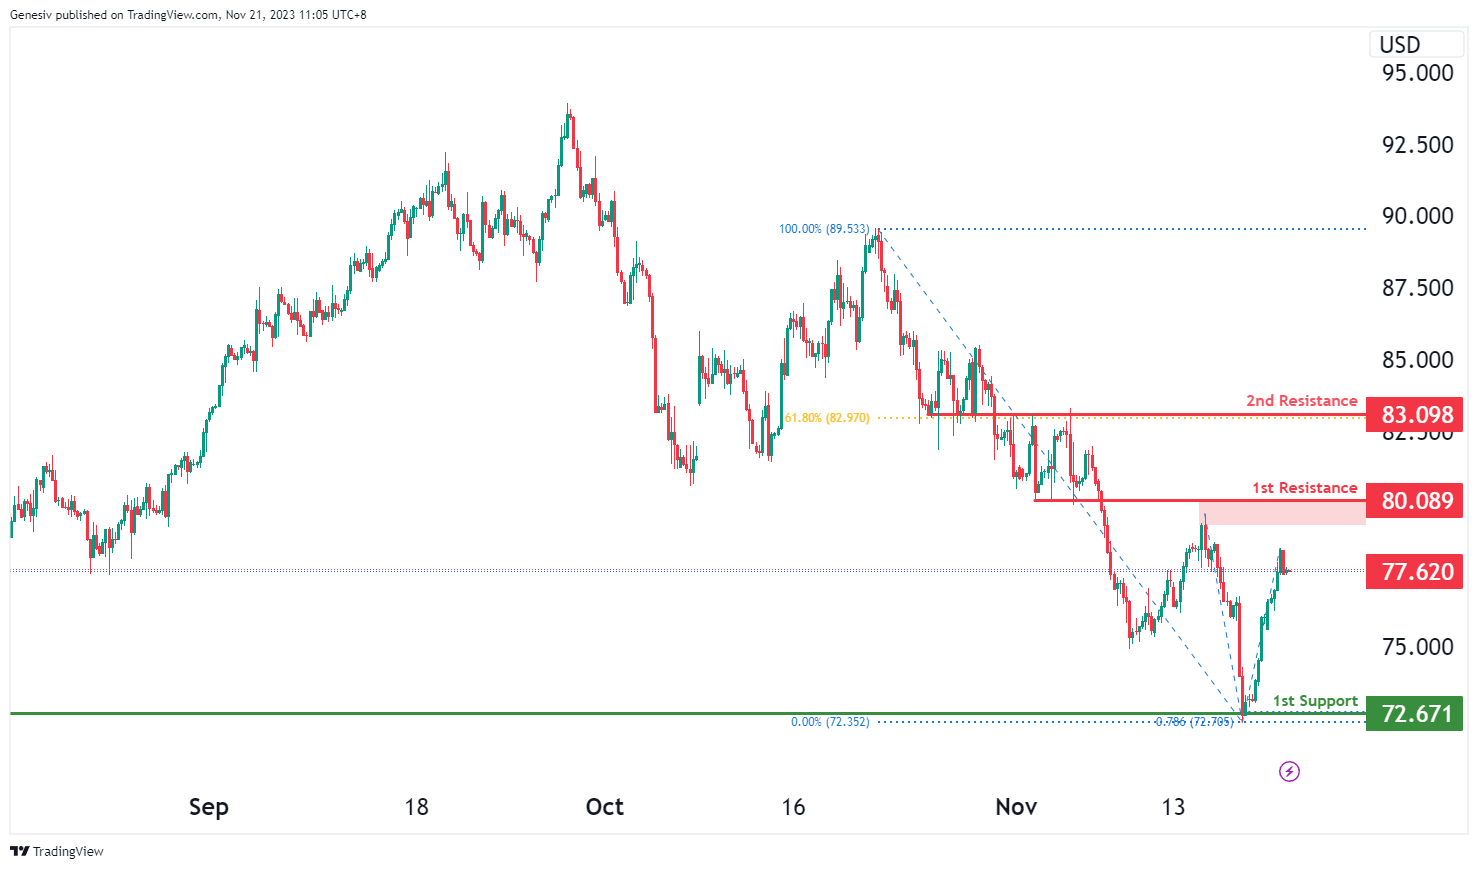
The WTI chart currently has a weak bullish momentum, suggesting a potential for a bullish continuation towards the 1st resistance.
The 1st resistance level at 80.09 is categorized as an overlap resistance.Higher up, the 2nd resistance level at 83.09 is also noted as an overlap resistance that aligns with the 61.80% Fibonacci retracement level, suggesting a strong barrier against further bullish momentum..
To the downside, the 1st support level at 72.67 is identified as an overlap support that aligns with the 78.60% Fibonacci projection level, indicating a potentially strong support zone.
XAU/USD (GOLD):
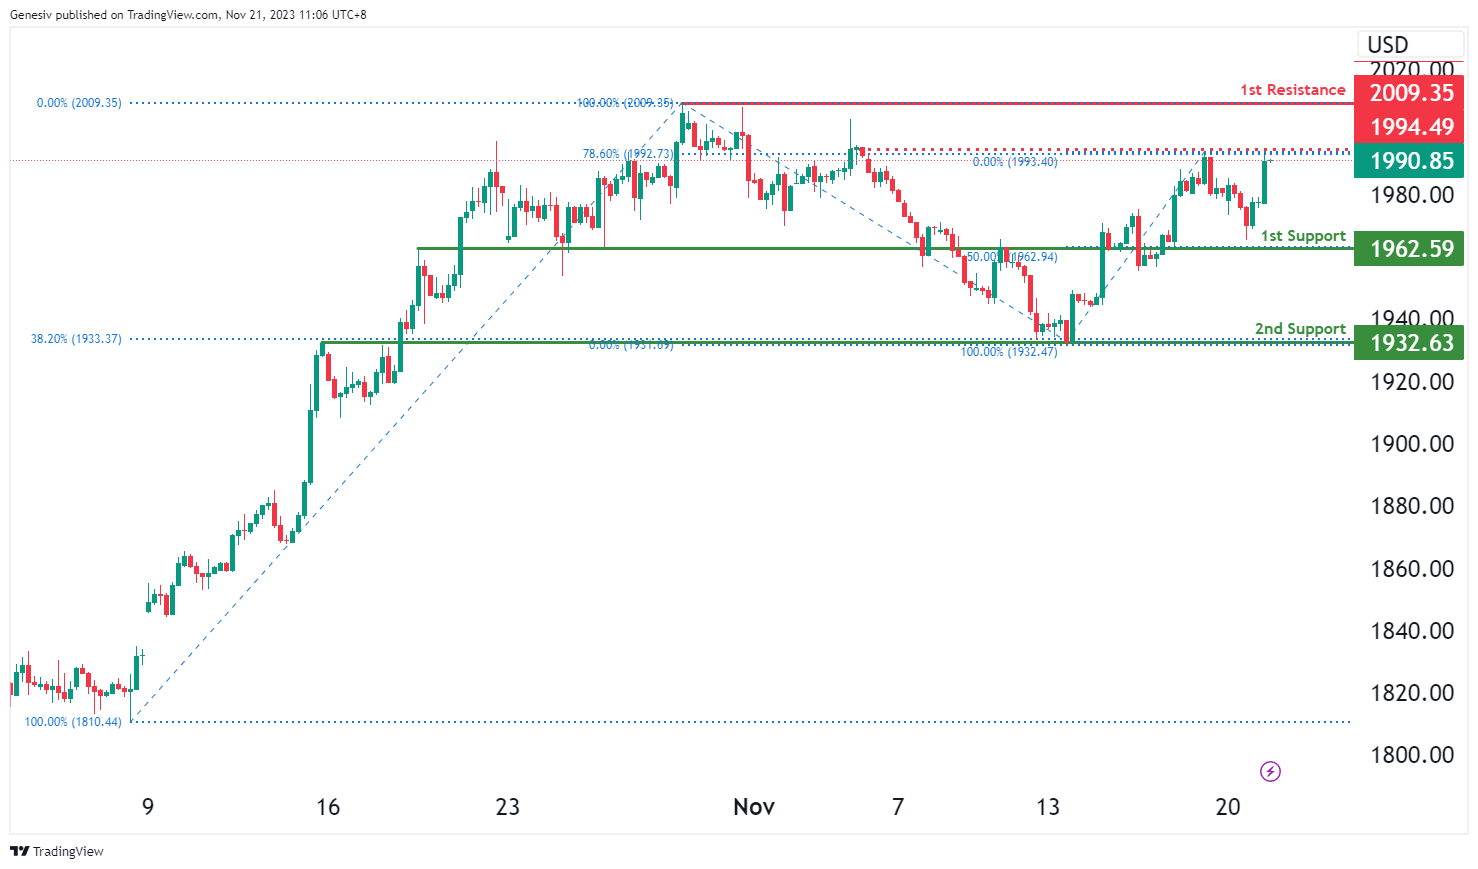
The XAU/USD chart currently has an overall bullish momentum, suggesting the potential for a bullish continuation towards the 1st resistance should price break above the intermediate resistance.
The intermediate resistance level at 1994.49 is categorized as a pullback resistance that aligns with the 78.60% Fibonacci retracement level. Higher up, the 1st resistance level at 2009.35 is categorized as a pullback resistance, potentially leading to a halt in the bullish momentum.
To the downside, the 1st support level at 1962.59 is identified as an overlap support that aligns with the 50.00% Fibonacci retracement level. Further below, the 2nd support level at 1932.63 is also noted as an overlap support that aligns with the 38.20% Fibonacci retracement level, indicating a potentially strong support area.
AUD/USD Daily Report
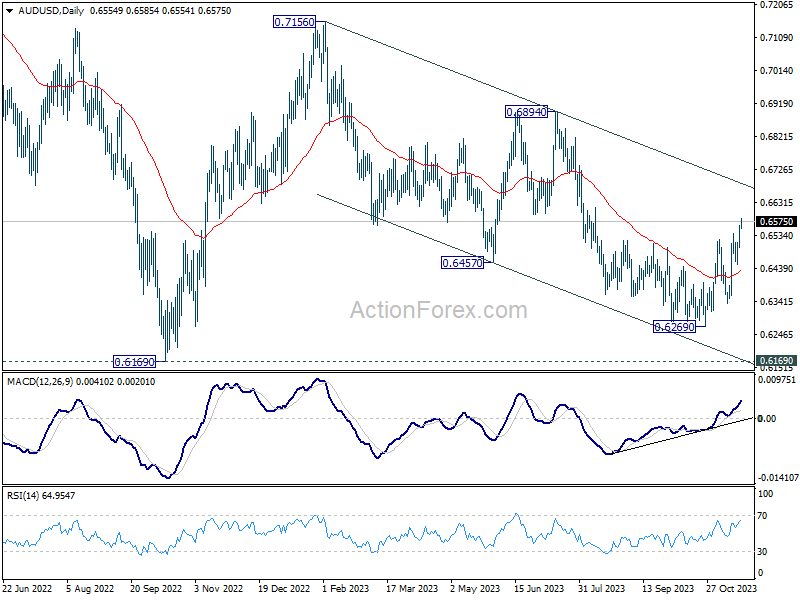
Daily Pivots: (S1) 0.6517; (P) 0.6541; (R1) 0.6581; More...
AUD/USD rises further to 0.6585 so far as rally from 0.6269 continues today. Intraday bias stays on the upside at this point. Current development argues that whole decline from 0.7156 has completed with three waves down to 0.6269. Further rally should be seen to falling channel resistance (now at 0.6676) next. On the downside, below 0.6533 minor support will turn intraday bias neutral first. But risk will stay on the upside as long as 0.6451 support holds.
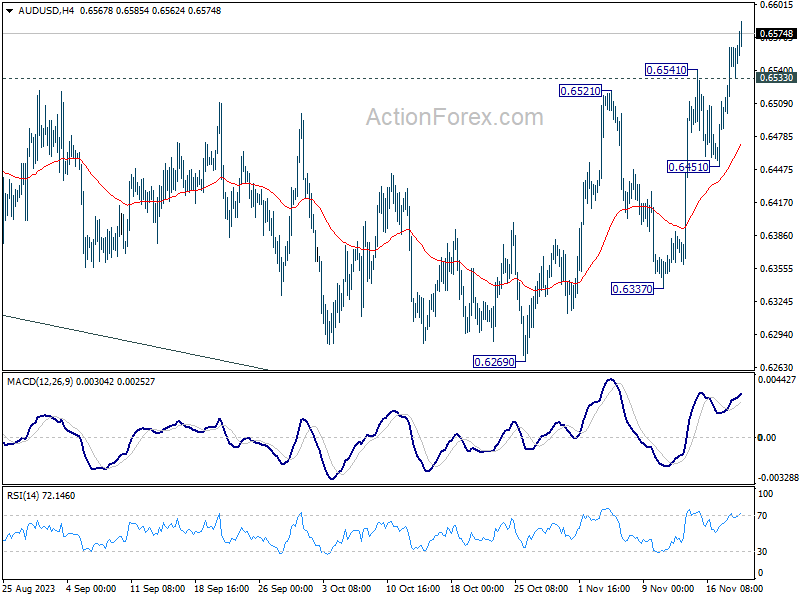
In the bigger picture, there is no confirmation that down trend from 0.8006 (2021 high) has completed. While current rebound from 0.6269 might extend higher, it could be the third leg of the corrective pattern from 0.6169 (2022 low) only. For now, medium term bearishness will remain as long as 0.6894 resistance holds.
Surging Yen and Yuan in Spotlight ahead of FOMC Minutes and Canada’s CPI
Japanese Yen's rally continued in today's Asian session, breaking through 148 mark against Dollar. This rise raises questions about the reaction of Japanese Finance Minister Shunichi Suzuki, particularly in light of his previous comments during Yen's decline this year. Suzuki had described the decline as "one-sided" and driven by "speculations." The current volatility, contrasting the steady depreciation since August, could be seen as "excessive," but it remains to be seen if Suzuki will comment similarly on this rapid ascent.
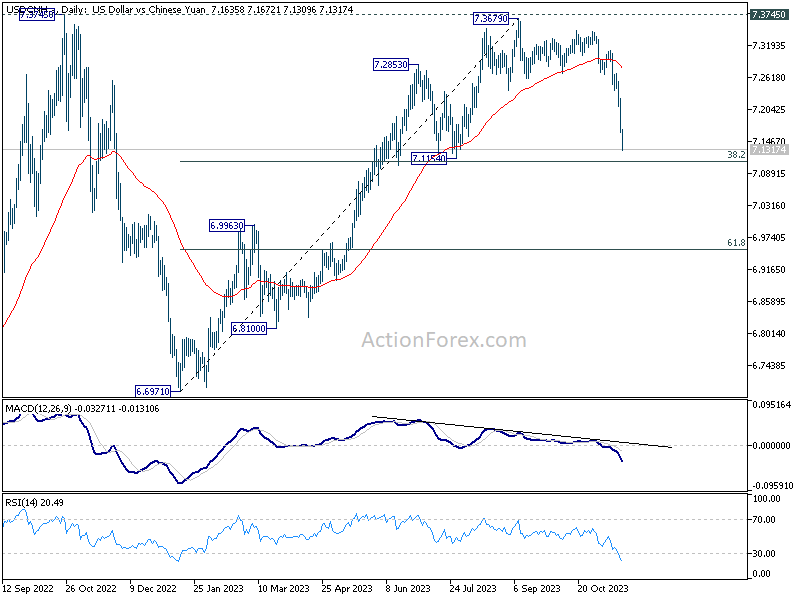
A key question for market analysts is the extent and nature of the Yen's rise. It's unclear whether this represents a mere correction to the year's downtrend or signals a more fundamental reversal. Chinese Yuan's movements could provide clues here, as USD/JPY and USD/CNH have mirrored each other for two years. With USD/CNH falling to its lowest level since July and approaching key 7.154 cluster support level, a decisive break could indicate a bearish trend reversal, potentially serving as a leading indicator for USD/JPY.
In the broader currency markets, New Zealand and Australian Dollars emerged as strong performers, followed Yen. Australian Dollar, in particular, is finding support from hawkish minutes released by RBA. These minutes highlighted the central bank's prioritization of inflation control, aligning with its latest rate hike decision. The emphasis on fighting inflation keeps the odds of another hike in Q1 alive.
Dollar, on the other hand, is currently the weakest performer as the market shifts its focus to the upcoming FOMC minutes. Substantial hints about future moves might not be forthcoming. Fed is expected to maintain its narrative of keeping rates high for as long as necessary. The December FOMC meeting, featuring new economic forecasts and dot plots, is anticipated to be more impactful in shaping expectations.
Canadian Dollar trails as the second weakest, with markets awaiting Canada's CPI data. This report is crucial as it is the last before BoC decision on December 6. Expectations are for further progress in disinflation, with core measures slowing. Any downside surprises in today's CPI data could solidify expectations of a BoC rate hold in the upcoming meeting.
In Asia, at the time of writing, Nikkei is down -0.02%. Hong Kong HSI is up 1.00%. China Shanghai SSE is up 0.46%. Singapore Strait Times is down -0.28%. Japan 10-year JGB yield is down -0.0415 at 0.702. Overnight DOW rose 0.58%. S&P 500 rose 0.74%. NASDAQ rose 1.13%. 10-year yield dropped -0.019 to 4.422.
Fed's Barkin: Inflation settling but job not done
Richmond Fed President Thomas Barkin, in an interview with Fox Business overnight, noted the positive aspects of the current economic situation, stating, the economy is "still growing" while unemployment is "still 3.9%", and "inflation does to be settling". "he added, "all that's good".
Despite these encouraging signs, Barkin emphasized that Fed's work on bringing inflation down is far from complete. "But the job's not done, and so you have to keep on until you get the job done, and we'll see where we land," he remarked.
Central to Barkin's focus, and by extension, Fed's, is the objective of returning inflation to the central bank's target. "Inflation convincingly coming back to target — that's my marker. And you can get there a lot of different ways," Barkin elaborated.
He also expressed a desire to see a return to the pre-pandemic economic environment, where excessive price increases were not commonly used as a management strategy. "But I'm still looking to be convinced that price-setters in this economy have gotten back to where they were three or four years ago, which was an understanding that above-normal price increases just weren't a management lever."
BoE's Bailey cautions against premature rate cut expectations
BoE Governor Andrew Bailey, in his remarks at an event overnight, has strongly indicated that the central bank is not yet in a position to consider reducing interest rates, stating it was "far too early to be thinking about rate cuts".
He warned about the persistently high services inflation and noted that wage growth remains "elevated." He added, when inflation is high, we take no chances."
In his remarks, Bailey pointed out that the Monetary Policy Committee's latest projections suggest that restrictive monetary policy stance will likely be necessary for "quite some time yet".
Bailey also stressed the need for vigilance regarding inflation trends, indicating that BoE remains open to further interest rate increases if necessary. "We must watch for further signs of inflation persistence that may require interest rates to rise again," he cautioned.
RBA's Bullock: Australian economy faces prolonged inflation challenge
RBA Governor Michele Bullock, speaking at the Australian Securities and Investments Commission Annual Forum, emphasized the persistent challenge of inflation for the Australian economy. Bullock forecasted that inflation would remain a "crucial challenge" for the next "one or two years," highlighting the complexity and longevity of the problem.
Bullock addressed a common misconception about the current inflationary environment, stating, "There is a bit of a perception around that the inflation at the moment really is all a supply driven thing – petrol prices, rents, these sorts of things, energy." However, she clarified that there is also a significant "demand component" contributing to inflation, which central banks globally are striving to manage.
Governor Bullock also touched upon global issues, noting, "In a world of fragmentation and conflicts … We're going to see more potential for supply shocks." She explained the dilemma central banks face regarding such shocks: while the typical approach is to look through temporary supply shocks, a continuous stream of them can lead to entrenched inflation expectations. Bullock warned, "If inflation expectations adjust, then that's a problem."
RBA minutes indicate inflation control at forefront
RBA meeting minutes from November 7 reveal a decisive step in monetary policy adjustment, with a 25bps increase in cash rate to 4.35%. This move reflects the RBA's heightened focus on managing inflationary pressures and aligning with its long-term targets.
The members' discussion was centered around two options: raising the cash rate or maintaining it at its current level. The decision to increase the rate was influenced by the consensus that this was the "stronger" course of action.
Achieving inflation targets by the end of 2025 played a significant role in the decision-making process. RBA members acknowledged an increased risk of not meeting these targets, suggesting the necessity of a prompt policy response.
The minutes also reveal a strategic consideration of future scenarios. Delaying the rate adjustment was seen as potentially necessitating a "larger" policy response in the future, especially if inflation pressures intensify.
Preventing a significant rise in inflation expectations was another critical concern. The RBA aimed to avoid any shift in market sentiment that could destabilize inflationary trends. This is particularly relevant given the Board's emphasis on "low tolerance" for delayed inflation target achievement.
Also, staff's inflation forecasts, which anticipated one or two rate rises, further underscored the necessity of the rate hike.
New Zealand's trade deficit narrows, led by reduced exports and imports to China
New Zealand's trade figures for October have shown significant decrease in both goods exports and imports, leading to a narrowed monthly trade deficit. Exports fell by NZD -552m, or 9.3% yoy decline, totaling NZD 5.4B. Imports also saw a substantial drop of NZD -1.2B, or -14% yoy, to NZD 7.1B. Trade deficit consequently narrowed from NZD -2425m to NZD -1709m, which is larger than expected deficit of NZD -1150m.
A significant aspect of these shifts was the marked decrease in both exports and imports to and from China. China, being New Zealand's top trading partner, saw the highest monthly fall in exports with a decrease of NZD -308m, amounting to - 19% reduction. This decline was echoed in imports from China, which fell by NZD -353m, a decrease of -18%.
Other key trading partners also showed varied trends. Exports to Australia decreased by NZD -128m (-15%), and to EU by NZD -84m (-24%). In contrast, exports to US slightly increased by NZD 2.9m (0.5%), and to Japan by NZD 25m (9.3%).
In terms of imports, apart from China, EU and US also registered significant drops, with decreases of NZD -138m (-11%) and NZD -146m (-20%), respectively. Imports from Australia and South Korea saw reductions of NZD -35m (-4.4%) and NZD -133m (-23%), respectively.
Looking ahead
Swiss trade balance and UK public sector borrowing will be released in European session. Later in the day, Canada CPI and FOMC minutes are the main focuses.
AUD/USD Daily Report
Daily Pivots: (S1) 0.6517; (P) 0.6541; (R1) 0.6581; More...
AUD/USD rises further to 0.6585 so far as rally from 0.6269 continues today. Intraday bias stays on the upside at this point. Current development argues that whole decline from 0.7156 has completed with three waves down to 0.6269. Further rally should be seen to falling channel resistance (now at 0.6676) next. On the downside, below 0.6533 minor support will turn intraday bias neutral first. But risk will stay on the upside as long as 0.6451 support holds.
In the bigger picture, there is no confirmation that down trend from 0.8006 (2021 high) has completed. While current rebound from 0.6269 might extend higher, it could be the third leg of the corrective pattern from 0.6169 (2022 low) only. For now, medium term bearishness will remain as long as 0.6894 resistance holds.
Economic Indicators Update
| GMT | Ccy | Events | Actual | Forecast | Previous | Revised |
|---|---|---|---|---|---|---|
| 21:45 | NZD | Trade Balance (NZD) Oct | -1709M | -1150M | -2329M | -2425M |
| 00:30 | AUD | RBA Meeting Minutes | ||||
| 07:00 | CHF | Trade Balance (CHF) Oct | 5.87B | 6.32B | ||
| 07:00 | GBP | Public Sector Net Borrowing (GBP) Oct | 21.0B | 13.5B | ||
| 13:30 | CAD | New Housing Price Index M/M Oct | 0.00% | -0.20% | ||
| 13:30 | CAD | CPI M/M Oct | 0.20% | -0.10% | ||
| 13:30 | CAD | CPI Y/Y Oct | 3.20% | 3.80% | ||
| 13:30 | CAD | CPI Core M/M Oct | -0.10% | |||
| 13:30 | CAD | CPI Median Y/Y Oct | 3.60% | 3.80% | ||
| 13:30 | CAD | CPI Trimmed Y/Y Oct | 3.60% | 3.70% | ||
| 13:30 | CAD | CPI Common Y/Y Oct | 4.30% | 4.40% | ||
| 15:00 | USD | Existing Home Sales Oct | 3.91M | 3.96M | ||
| 19:00 | USD | FOMC Minutes |
EUR/USD Regains Strength As Dollar Starts Downside Correction
Key Highlights
- EUR/USD rallied above the 1.0880 and 1.0920 levels.
- A connecting bullish trend line is forming with support near 1.0810 on the 4-hour chart.
- GBP/USD also climbed higher above the 1.2450 resistance.
- USD/JPY declined heavily below the 150.00 support.
EUR/USD Technical Analysis
The Euro started a strong increase above the 1.0800 level against the US dollar. EUR/USD broke many hurdles near 1.0850 to move into a positive zone.
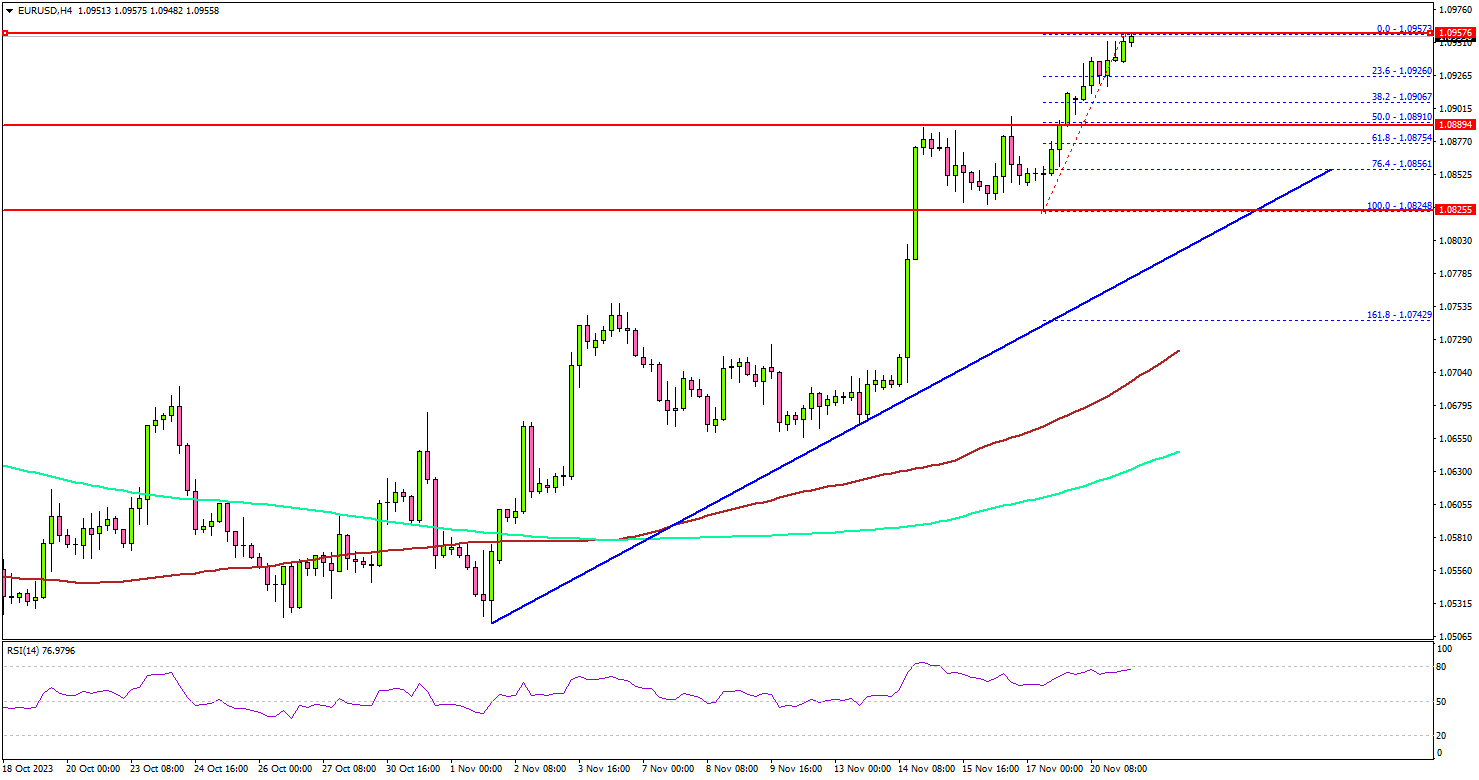
Looking at the 4-hour chart, the pair settled above the 1.0850 level, the 100 simple moving average (red, 4 hours), and the 200 simple moving average (green, 4 hours). The upward move was such that the pair surged above the 1.0920 level.
A new multi-week high was formed near 1.0957 and the pair is now consolidating gains. On the upside, the pair is facing resistance near the 1.0940 level.
If there is a fresh increase, the pair could surpass the 1.0940 level. The next key resistance is near the 1.0980 level. The main resistance is now near the 1.1000 level. A close above the 1.1000 zone could open the doors for more upsides. The next stop for the bulls might be 1.1075.
If not, the pair might start a downside correction below the 1.0900 support. The first major support is now forming near the 1.0865 level. The next key support sits at 1.0820.
There is also a major bullish trend line forming with support near 1.0810 on the same chart, below which the pair could test the 1.0750 pivot level in the near term. Any more losses may perhaps open the doors for a move toward the 100 simple moving average (red, 4 hours) at 1.0700.
Looking at GBP/USD, the pair gained pace above the 1.2450 resistance and might continue to rise toward 1.2550 in the near term.
Economic Releases
- Canadian Consumer Price Index for Oct 2023 (MoM) – Forecast +0.1%, versus -0.1% previous.
- Canadian Consumer Price Index for Oct 2023 (YoY) – Forecast +3.2%, versus +3.8% previous.