Sample Category Title
BoE’s Bailey highlights market misjudgment on inflation persistence
During today's Treasury Committee hearing, BoE Governor Andrew Bailey expressed concern that the markets might be overly focused on recent data releases, including the recent decrease in inflation for October. He highlighted that the market is perhaps "putting too much weight" on these short-term data points, potentially overlooking the broader challenge of persistent inflation.
BoE Governor stressed the significance of not becoming complacent with current data trends, emphasizing the potential "persistence" of inflation. "I think the market is underestimating that," he said, pointing towards the complexity of the inflationary environment.
Addressing the debate around inflation targets, Bailey firmly rejected the notion that the target should be adjusted to 3%. He said that it's a "very bad argument," underscoring the difficulties in bringing inflation down from 3% to 2%.
Regarding the 2% target, Bailey explained that while there isn't an "objective magic" to this figure, it is widely recognized as the operational definition of price stability.
The Crypto Market Attracts Capital
Market picture
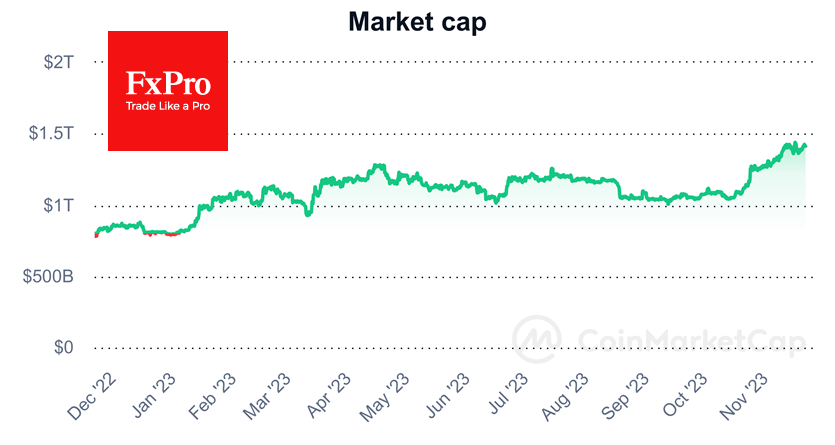
Crypto market cap retreated some 0.2% in 24 hours to $1.41 trillion. Bitcoin is up 0.7%, and BNB is up 5.3%, but most altcoins are down.
According to CoinShares, investment in crypto funds rose by $176 million last week; inflows are on track for an eighth consecutive week, having accelerated over the past four weeks. Bitcoin investment increased by $155 million, Ethereum by $3 million and Solana by $14 million.
Bitcoin continues to dominate, with inflows accounting for 3.4% of total assets under management over the past eight weeks. Total inflows into the digital asset since the beginning of the year are $1.32 billion, with inflows still well behind the 2021 and 2020 figures ($10.7 billion and $6.6 billion respectively), CoinShares noted.
70% of the available Bitcoin supply did not move from one wallet to another last year. That’s an all-time high.
News background
According to Bloomberg Intelligence, the spot bitcoin ETF market could attract as much as $100 billion from large mutual funds such as BlackRock, Fidelity and Invesco. Investment funds are already receiving hundreds of requests from clients looking to invest in digital assets.
Spanish bank Santander has enabled 210,000 wealthy clients in Switzerland to trade and store Bitcoin and Ethereum. The list of available instruments will be expanded in the coming months.
Bitcoin advocate Javier Milei has been elected president of Argentina. In the past, the libertarian MP has stated his intention to “burn” the central bank and abandon the peso in favour of the dollar to combat inflation. The Bitcoin price has since set a record high in Argentine peso.
According to Bloomberg, the US Department of Justice is seeking more than $4 billion from the Binance exchange as part of a settlement agreement in an investigation into alleged money laundering, bank fraud and sanctions violations.
JP225 Cash Index Bears Show Signs of Life
- JP225 cash index dips lower after strong upmove
- Bulls still focused οn testing the June 16, 2023 high
- Momentum indicators show some early signs of trend reversal
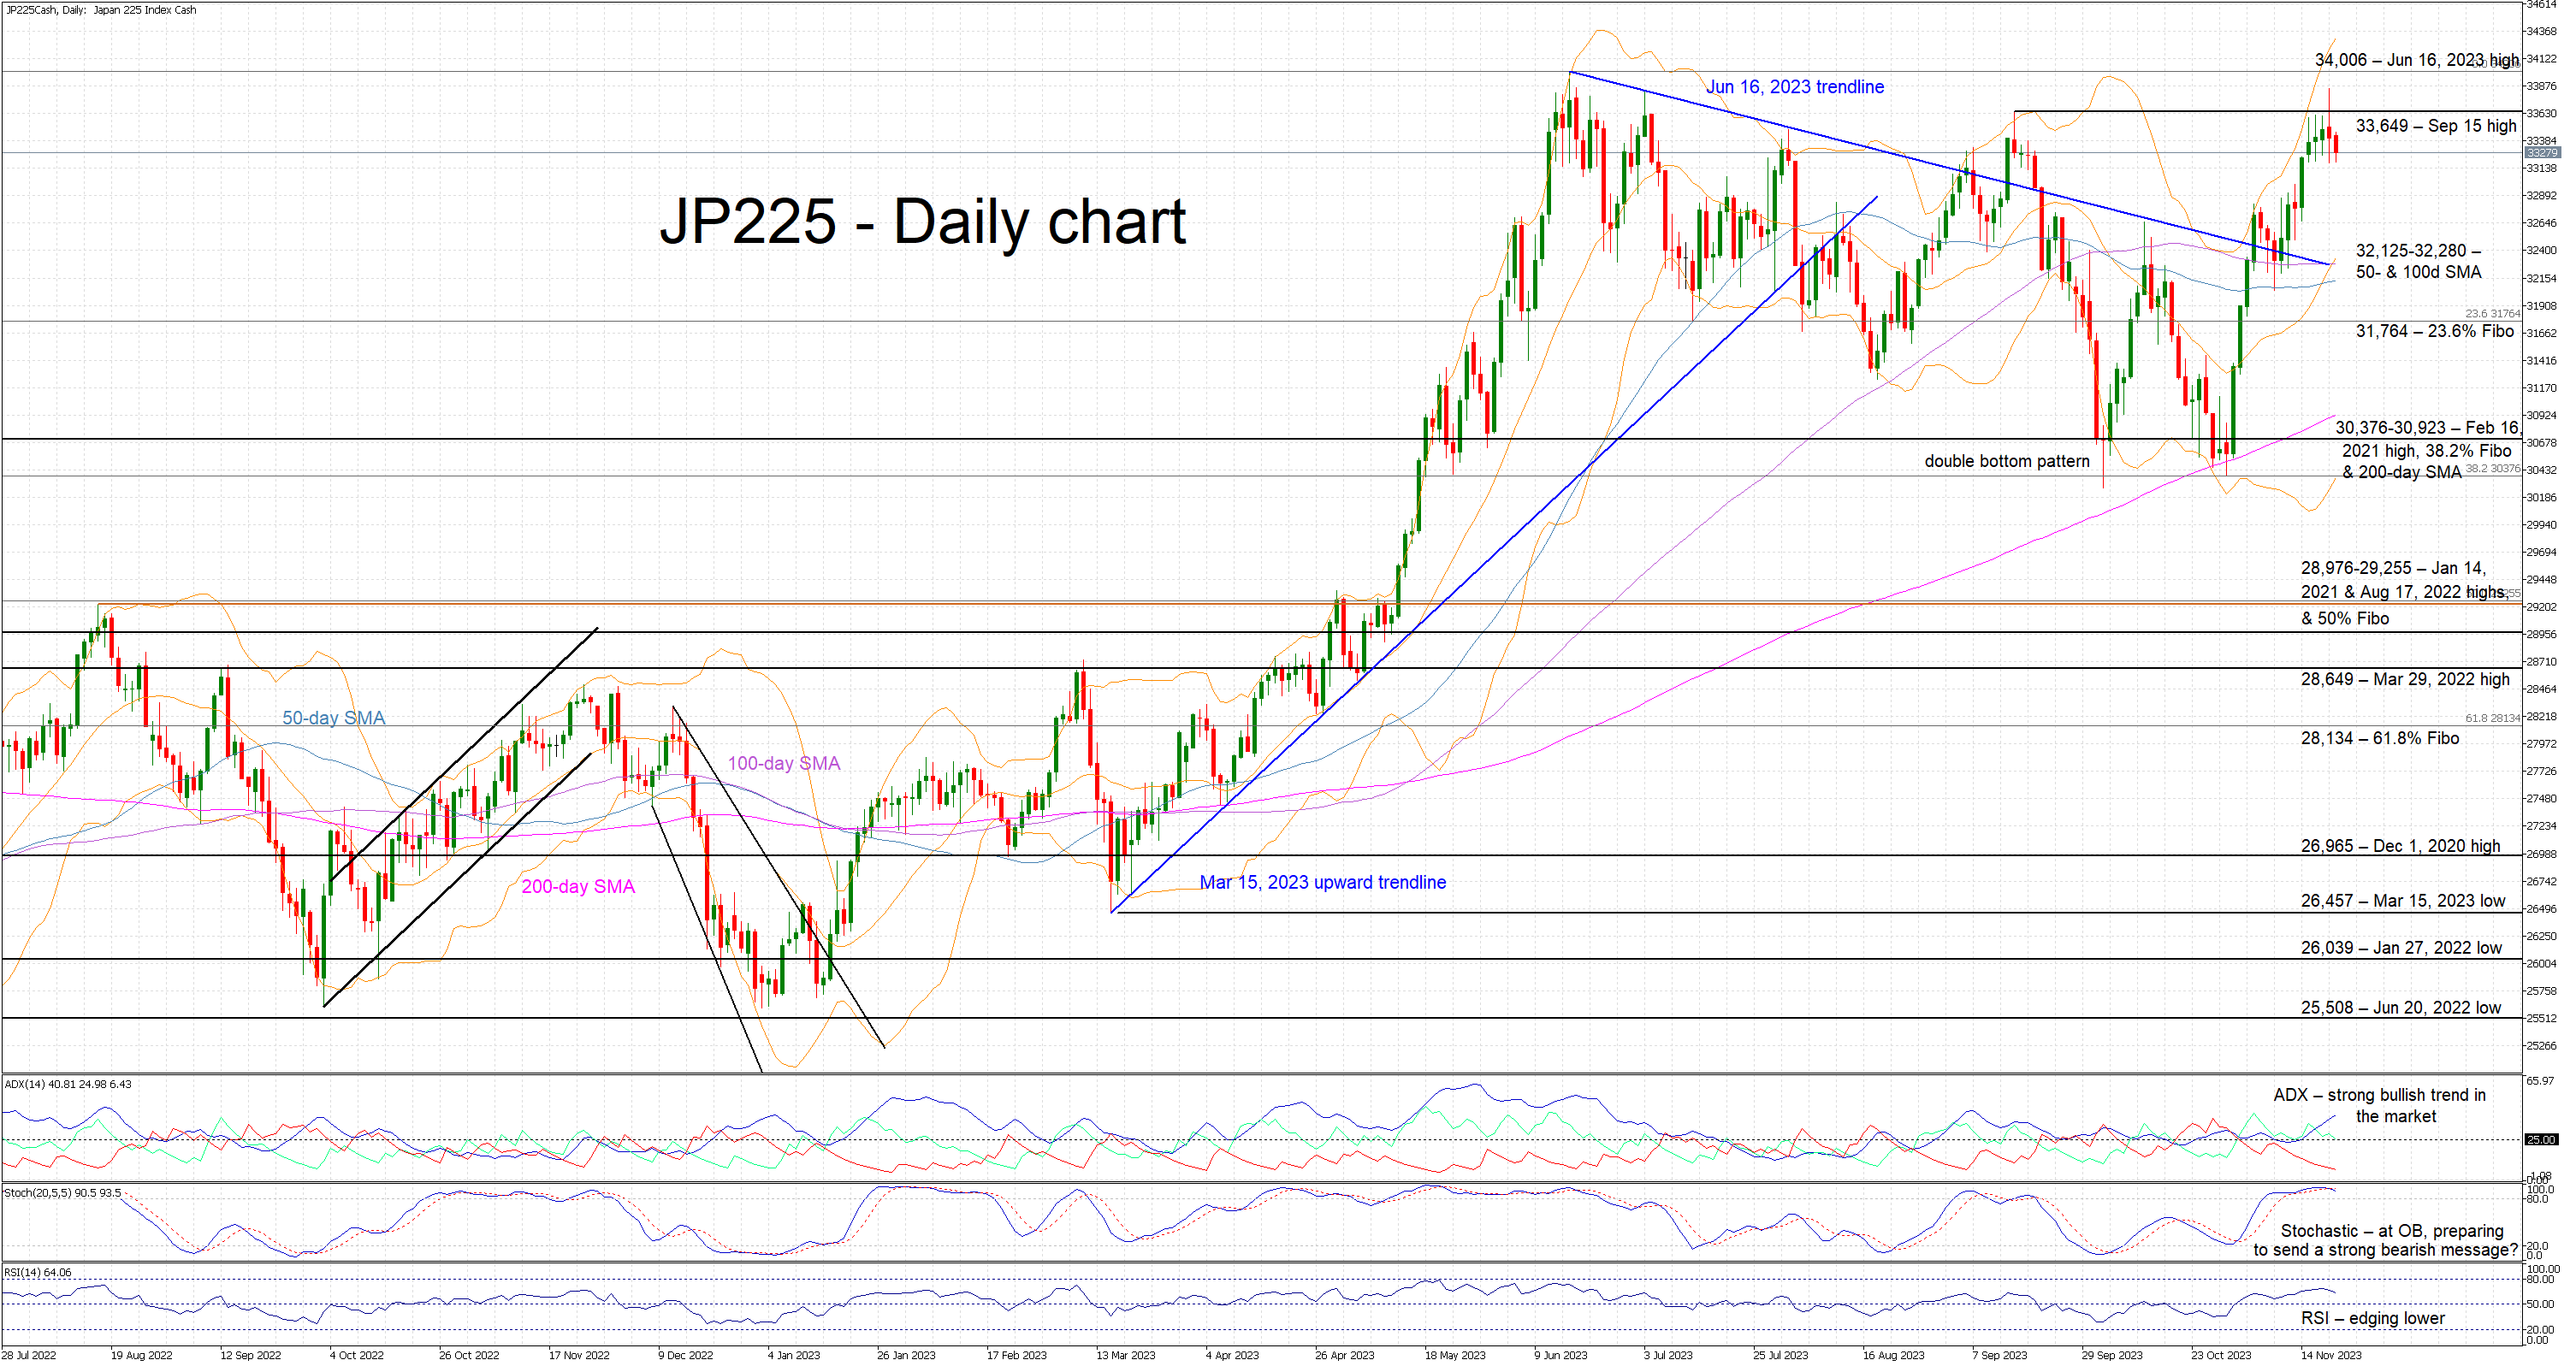
The JP225 cash index is trading lower again today as the bulls appear to be taking a breather from the recent strong rally. The JP225 is still around 10% higher than the end-of-October low of 30,380 and not far from the all-time high of 34,006.
In the meantime, the momentum indicators are probably showing some early signs of a possible trend reversal in the JP225 index. In more detail, the RSI has probably peaked, and it is edging lower, towards its midpoint. Interestingly, the stochastic oscillator has moved below its moving average and appears ready to cross below its overbought territory. Should this take place, it would be seen as a strong bearish signal. Only the Average Directional Movement Index (ADX) is trying to make a higher high and it is thus supporting the current uptrend.
Should the bulls remain confident, they would try to push JP 225 index back above the September 15, 2023 high at 33,649 level, and then plot their course towards the June 16, 2023 high at 34,006. If successful, they could then have the chance of recording a new all-time high.
On the other hand, the bears are keen on continuing the current correction. Their primary target appears to be the 32,125-32,280 area defined by the 50- and 100-day simple moving averages (SMAs). Even lower, the 23.6% Fibonacci retracement level of the March 8, 2022 – June 16, 2023 uptrend at 31,764 could prove easier to overcome than currently foreseen, with the next key support expected at the 30,376-30,923 region.
To sum up, the JP225 index bulls appear relaxed with today’s red candle but they will probably reevaluate their stance if the correction picks up speed.
Silver XAGUSD Found Intraday Buyers At The Equal Legs Area
Hello fellow traders. In this article we’re going to take a quick look at the Elliott Wave charts of Silver, published in members area of the website. As our members know Silver has recently made a short term 3 waves pull back that has reached its target area and found buyers. In the further text we are going to explain the Elliott Wave Forecast.
Silver 1 Hour Elliott Wave Analysis 11.20.2019
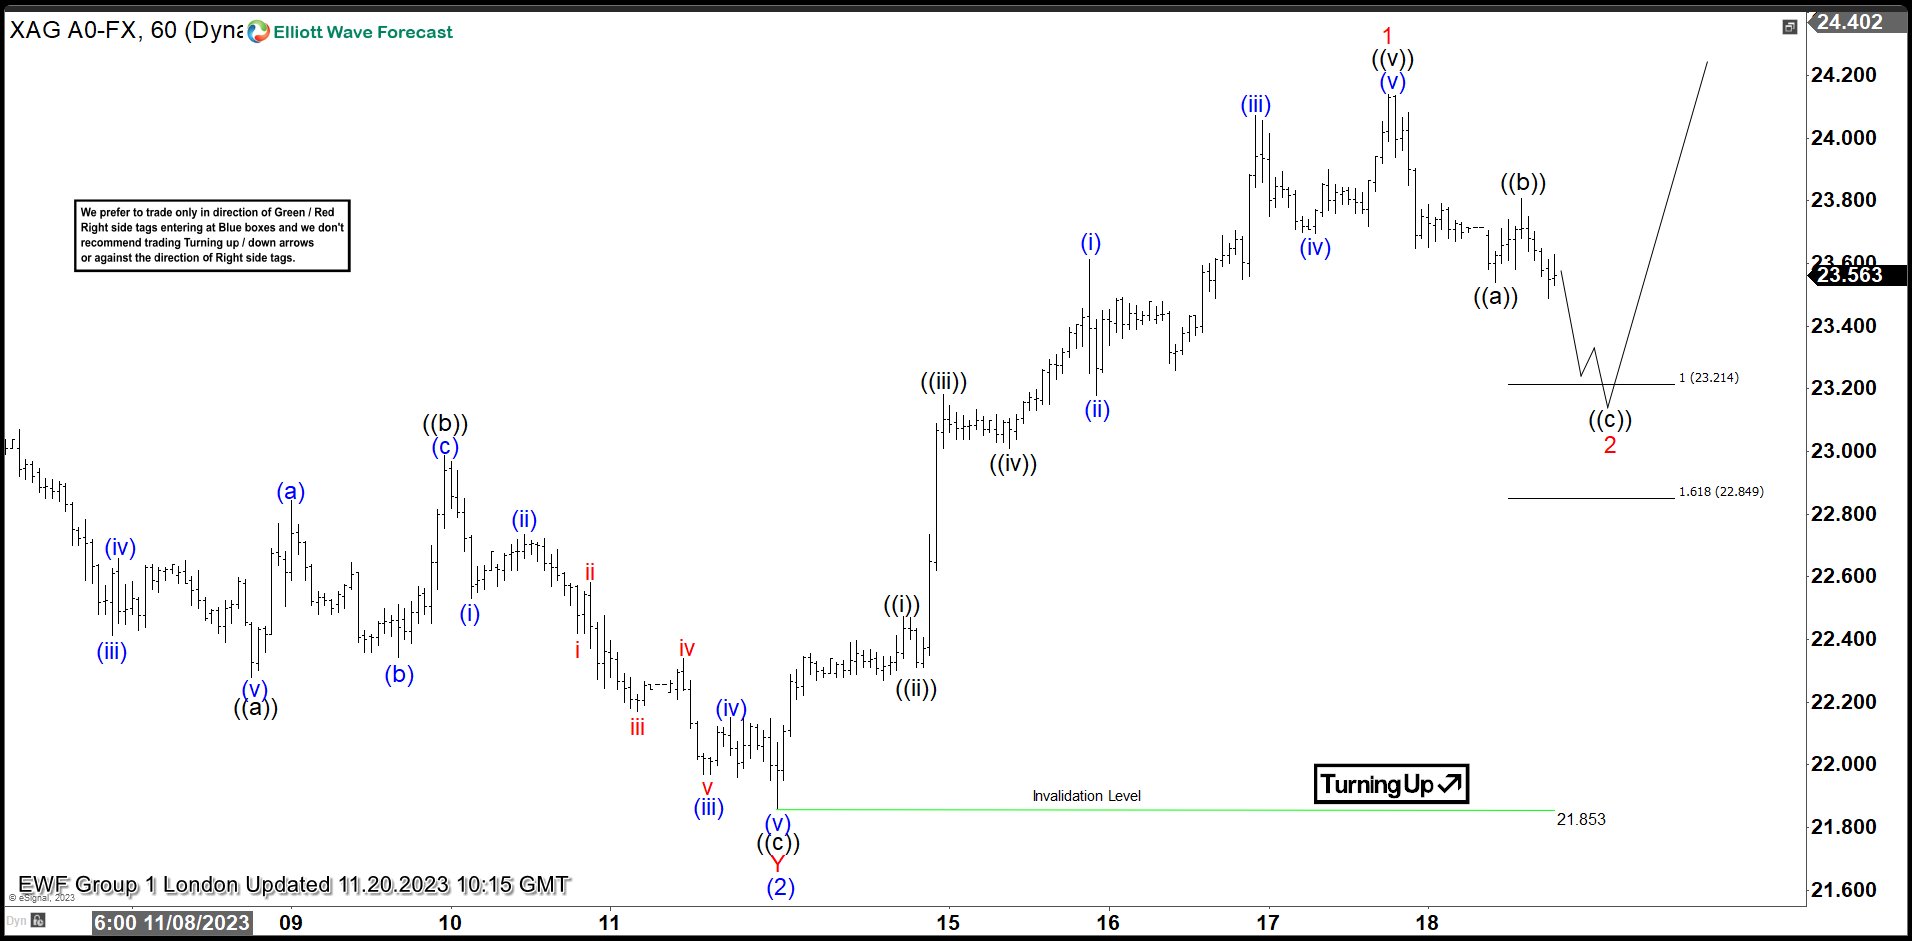
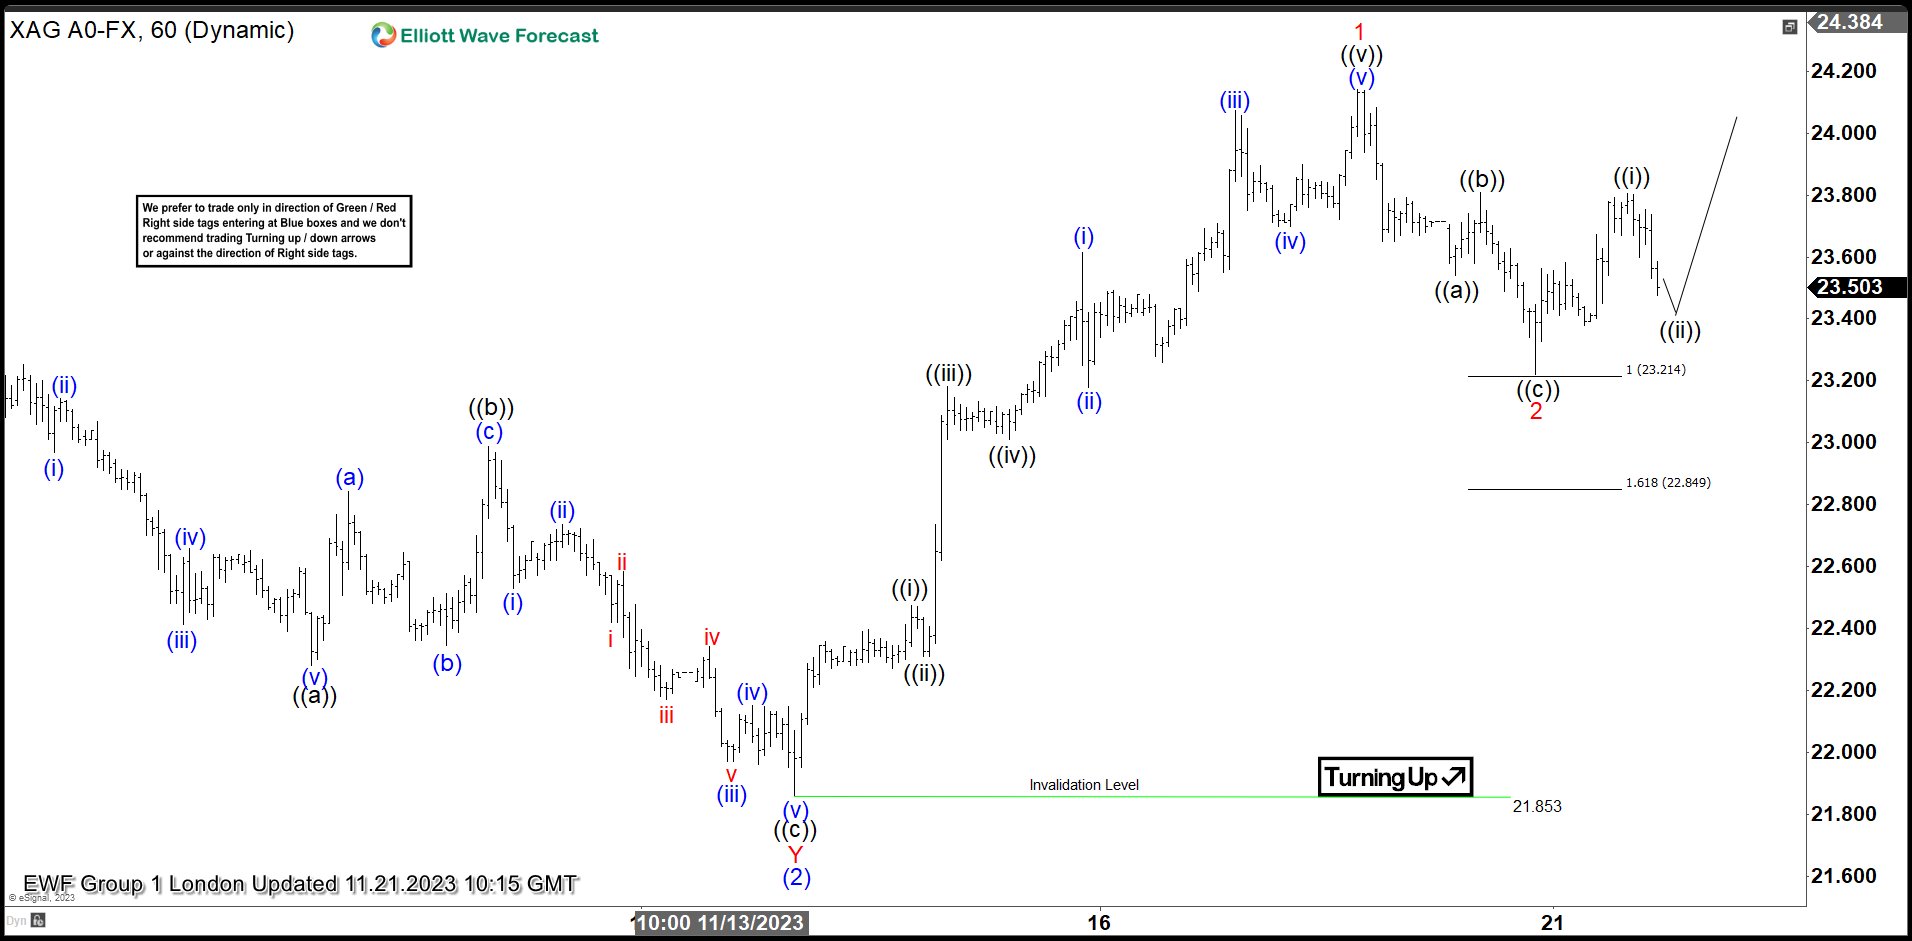
Silver ended cycle from the 21.85 low as 5 waves structure, labeled as wave 1 red. Currently doing wave 2 red pull back which is showing incomplete structure. Lower low sequences from the peak suggests we are still in ((c)) leg which should ideally give us more weakness toward 23.21-22.84 area. At that area we expect buyers to appear for proposed rally or 3 wave bounce alternatively. Although we expect to see another marginal push down, we advise members to avoid selling against the main bullish trend. We favor the long side from the marked equal legs area. As our members know, Equal Legs are no enemy areas , giving us 85% chance to get a bounce.
Silver 1 Hour Elliott Wave Analysis 11.21.2019
Pull back completed right at equal legs zone at 23.21-22.84 . Silver found buyers at the marked zone and we are getting good reaction from there. Rally from the buyers zone reached 50fibs against the ((b)) high, so any longs should be risk free by now. We count Wave 2 red pull back completed at the 23.25 low. Alternatively if that level gets broken, Silver can make deeper pull back toward 22.92-22.71 area.
UK PMIs on the Menu But Political Difficulties Reemerge
- PMI survey prints will be released on Thursday amidst volatile political environment
- Wednesday’s Autumn statement is key as another government crisis could unfold soon
- Pound does not enjoy the increased domestic risks, especially as BoE remains dovish
Inflation dropping but so is growth
Bank of England Governor Bailey got his wish in last week’s inflation report for October. The annual inflation growth rate dropped to a respectable 4.6% from 6.7% in the previous month, and miles away from the November 2022 high of 11.1%. The inflation rate remains elevated, but it is now much closer to levels seen in other developed nations, thus reducing the pressure on the BoE to raise rates again.
The main reason for this inflation slowdown is the considerably lower energy prices recorded this year compared to 2022. However, there is also an element of lower growth seen across the board. Despite GDP growth remaining positive in the third quarter of 2023, industrial and manufacturing data have been mixed and the PMI surveys are stuck in contraction territory.
November PMIs on Thursday
More specifically, the manufacturing PMI survey has remained below the 50-threshold since July 2022, which indicates a significant momentum loss in the sector. In the meantime, the much-talked about Services PMI has recently dipped into contraction territory. On Thursday, the preliminary prints of these two PMI surveys for November will be released. The market expects marginal changes in both sub-indices.
This will probably be music to the ears of certain BoE members as domestically driven services price inflation continues to haunt their dreams. To be fair, the BoE has always been trying to engineer a slowdown in the economy to regain control of the runaway inflation, and they now seem to be achieving their target. However, inflation clearly remains above their price stability remit, making it the main topic of discussion at Tuesday’s parliamentary appearance.
Political developments and the Autumn Statement
The government though does not seem to share the same feeling regarding the growth outlook. Wednesday’s Autumn Statement is expected to include a series of tax breaks with Chancellor Hunt possibly announcing lower income taxes and/or an inheritance tax cut. In addition, stronger tax receipts and new rules for pension funds could allow the incumbent government to spur public investments, especially in underdeveloped areas.
The Autumn Statement comes at a period when the government under PM Sunak appears to be under pressure. The recent cabinet reshuffle and particularly the removal of the Interior Minister have caused unrest in the Conservative Party. It is worth noting that the next general elections are scheduled to be held before January 28, 2025 which means that, most likely, during the fourth quarter of 2024 we will have elections in both the UK and US.
The UK has already experienced three different PMs since the 2019 elections. With the polls showing the Labour Party clearly in the lead, we cannot exclude the possibility of a fourth PM selected from the current legislature to lead the Conservative Party in the next election battle. Obviously, this unrest is not instilling much confidence both domestically and internationally, especially in a period when the UK has been trying to attract foreign investment -hence, the clear pro-growth direction expected by the Autumn statement.
Pound trying to react to the euro rally
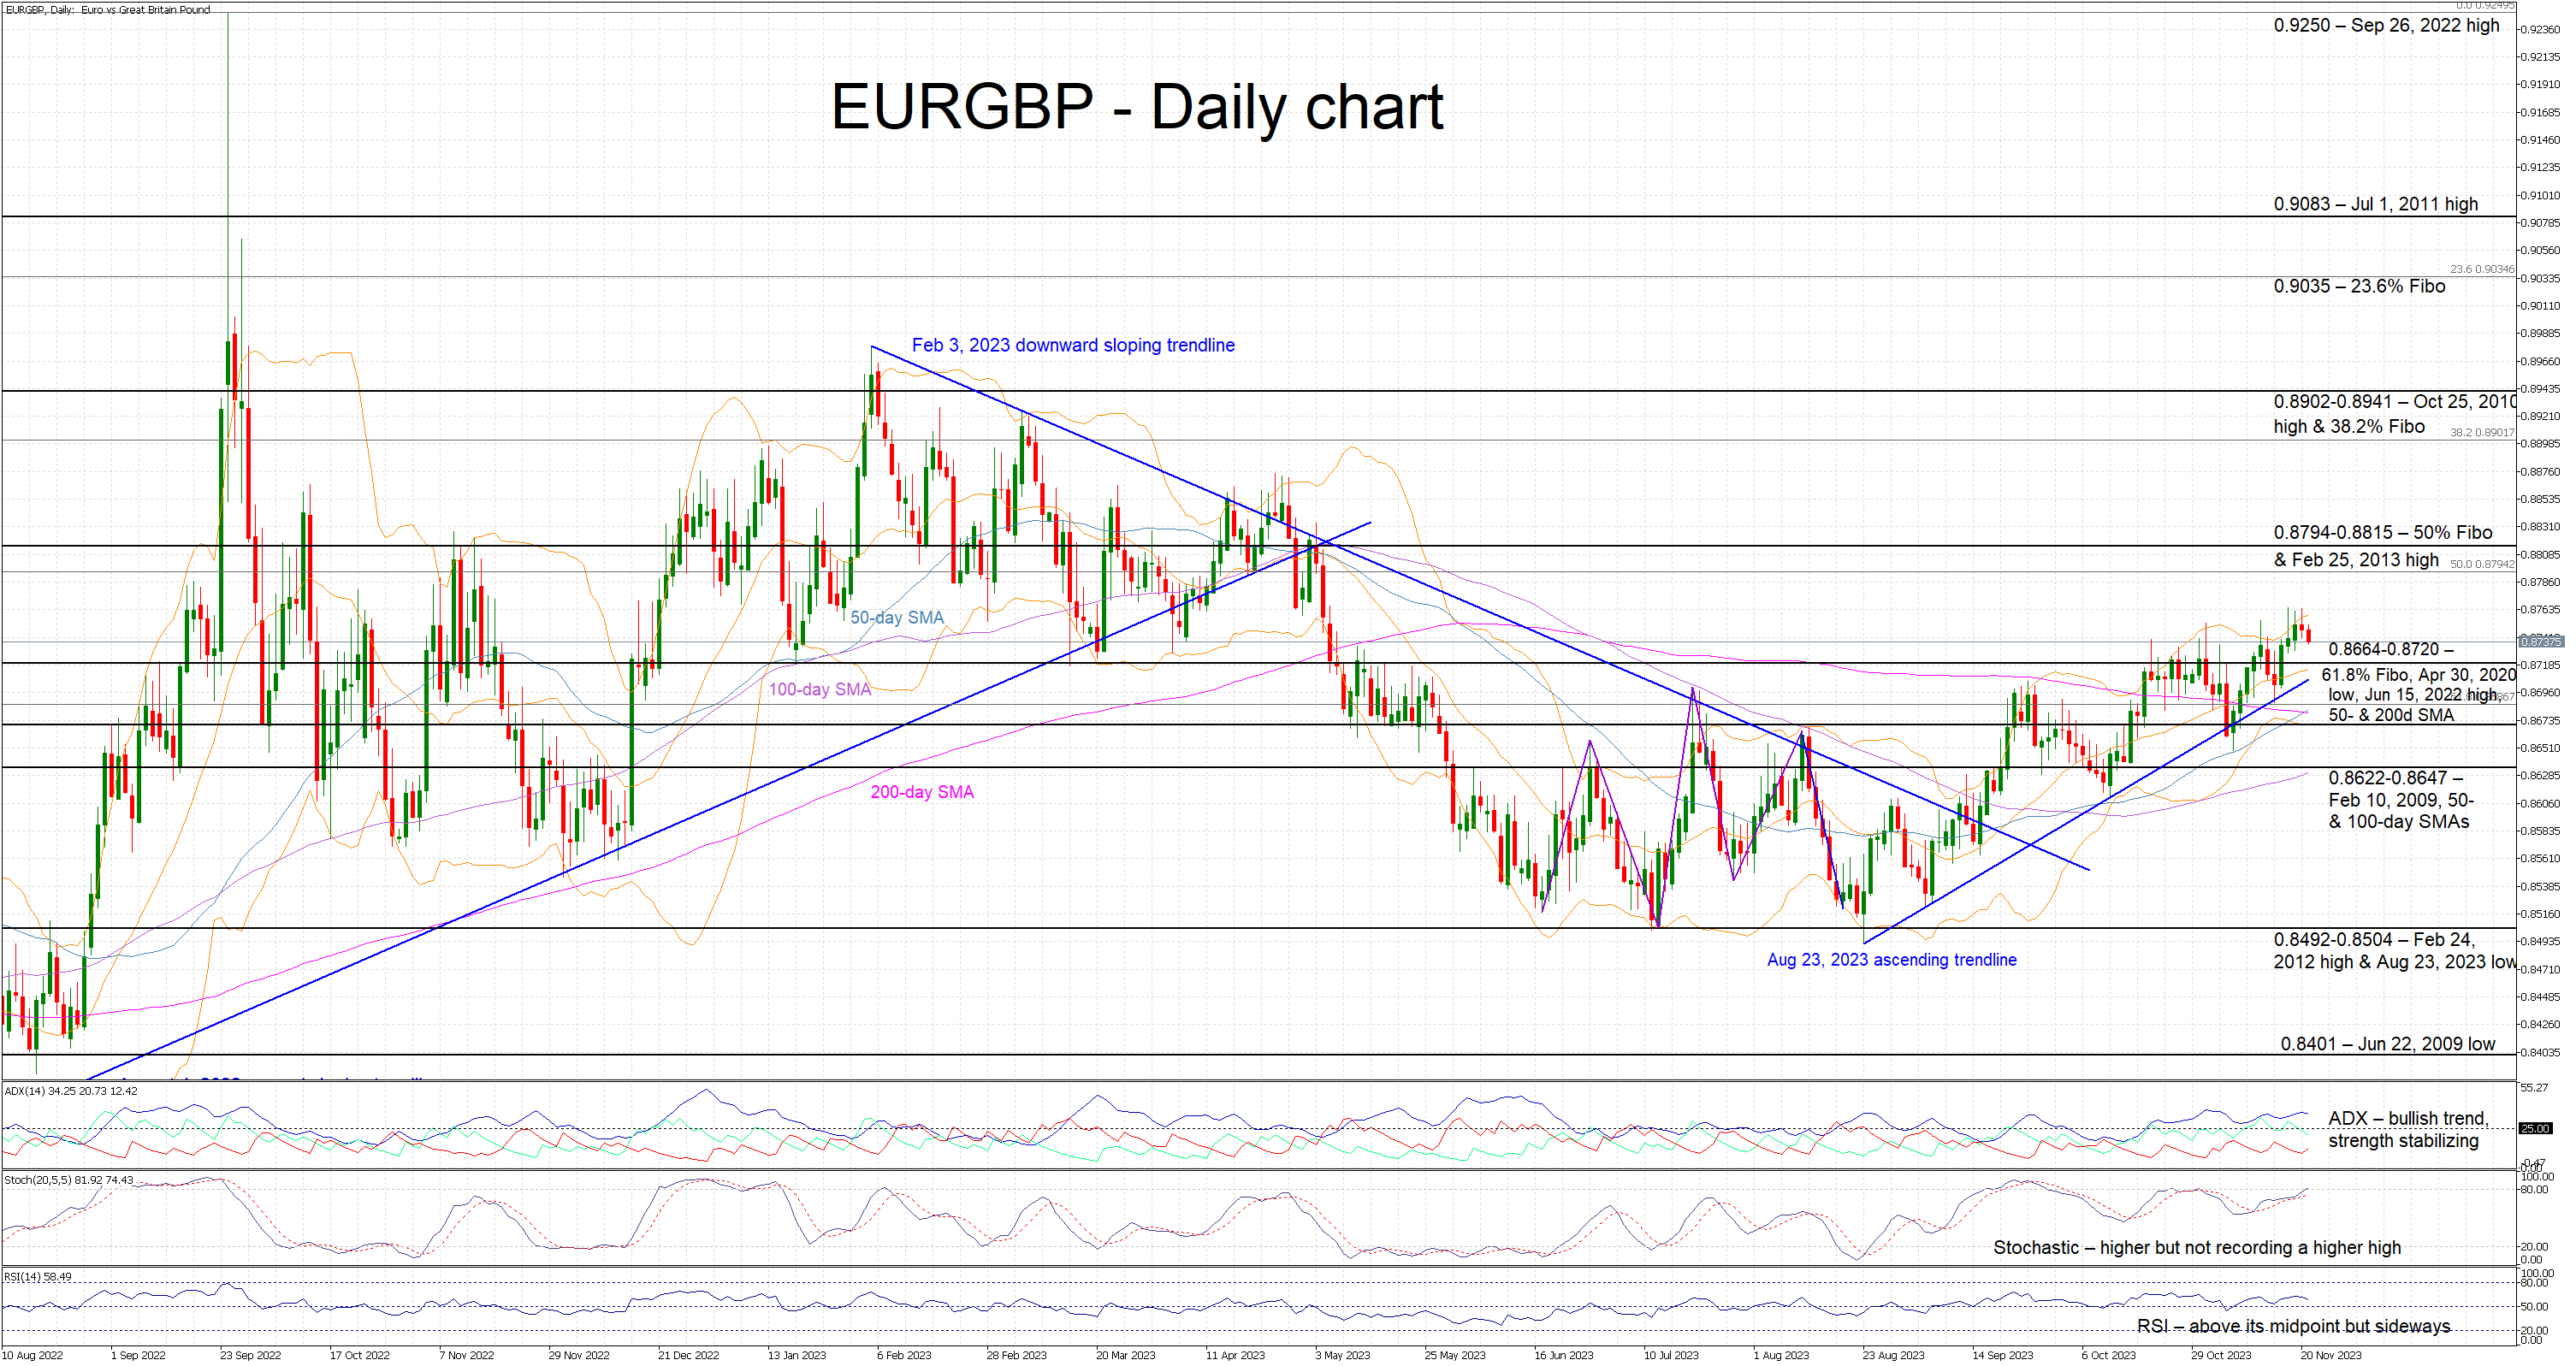
The pound has been under pressure against the euro since the August low. Despite the negative newsflow from the euro area, the market has turned against the pound due to the weakening growth prospects of the UK economy and the recent political shenanigans, especially as the next elections could bring the less market-friendly Labour Party in power.
This week’s events and data calendar could cause an increase in volatility for the euro-pound pair especially if PMI survey figures surprise on the upside, the Autumn statement is more pro-growth than currently foreseen, and the BoE's rhetoric becomes a tad more hawkish. The combination of these three outcomes could allow pound bulls to break the August 23, 2023 ascending trendline and open the door for a more protracted move below the 0.8622 area.
On the flip side, a plethora of growth negative prints and dovish BoE commentary could result in another upleg in euro-pound with the 0.8794-0.8815 area potentially being the primary target for euro bulls.
Nasdaq 100 Technical: Relentless Bullish Move
- The current bullish movement seen in the US Nasdaq 100 is primarily driven by an ongoing multi-week slide in the US 10-year Treasury yield.
- Market breadth has improved remarkably where the number of component stocks in the Nasdaq 100 that are trading above their 200-day moving averages jumped to 67%.
- Watch the key short-term support at 15,765/15,690.
A major shift in calculus has taken form in the dynamics of the US stock market where long-duration growth US equities have outperformed in the past two weeks with risk-on-herding behaviour.
The primary driver of this abrupt bullish sentiment has been the recent softness in the long-term cost of funding depicted by the benchmark US 10-year Treasury yield. It has declined by 61 basis points from its 5.02% high printed on 23 October 2023 to yesterday, 20 November low of 4.41%; also its steepest decline since the period of 2 March 2023 to 4 May 2023.
The current bout of weakness seen in the US 10-year Treasury yield ex-post release of the softer US CPI print for October implies that the US Federal Reserve’s current interest rate hike cycle on the Fed funds rate may have reached a terminal level of 5.25%-5.50% with low odds of an interest rate hike in next month, December FOMC meeting and even the entire months of 2024 based on the current pricing calculated by the CME FedWatch tool.
These latest implications suggest that the next potential scenario in US monetary policy is likely to be less restrictive with a chance of 29.5% for the first interest rate cut to be enacted as early as in the March 2024 FOMC meeting which in turn supports the current bullish outperformance seen in Nasdaq 100 that is heavily weighted in long-duration growth equities such as the seven mega-cap cohort (Apple, Amazon, Alphabet, Meta, Microsoft, Tesla & Nvidia).
14% rally after a retest on its 200-day moving average
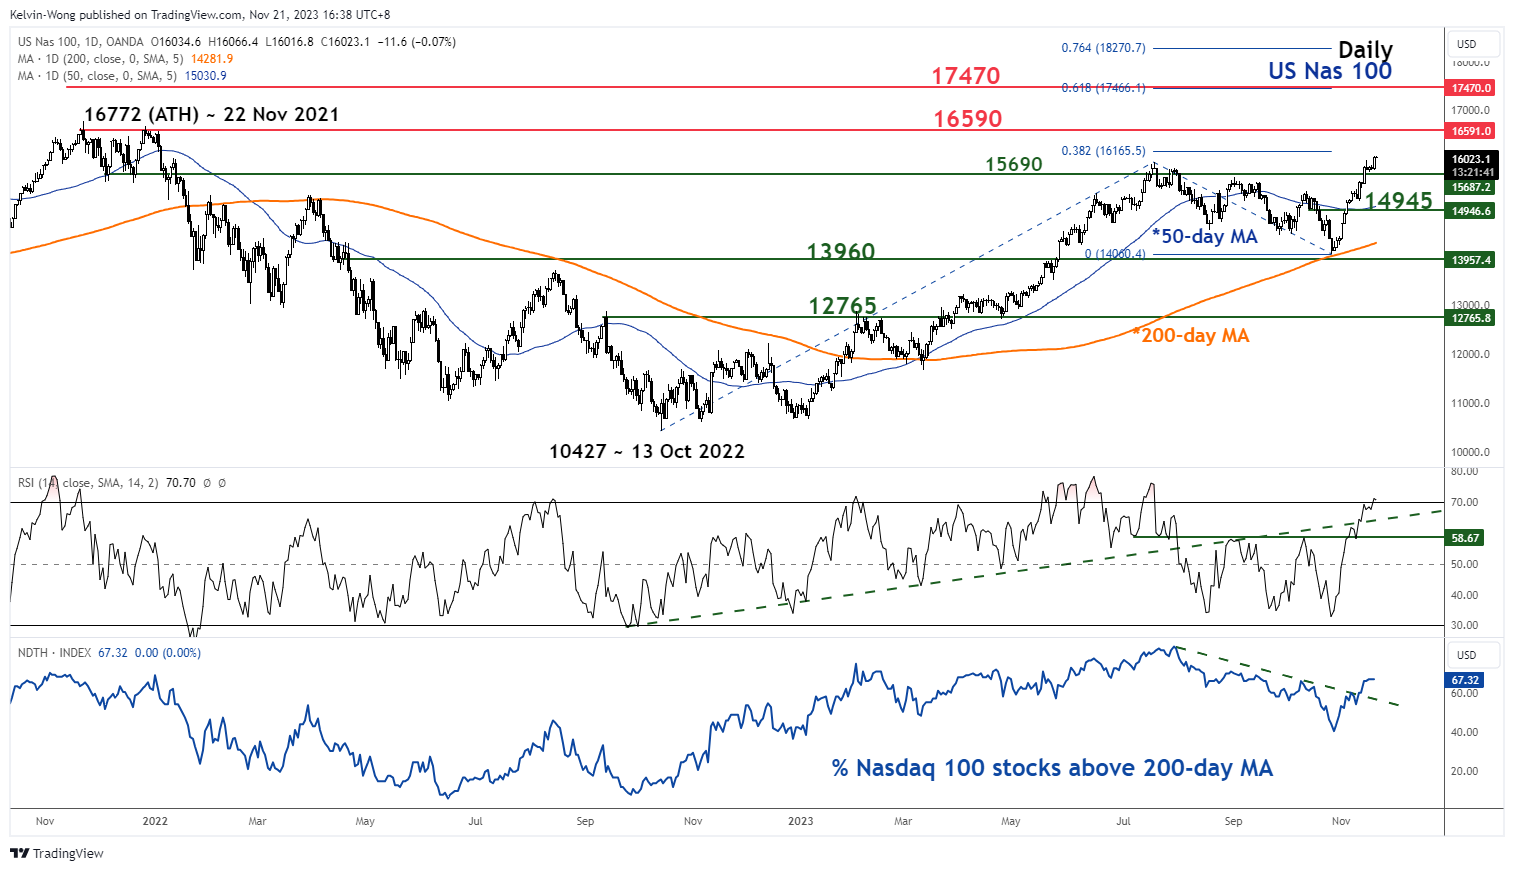
Fig 1: US Nas 100 medium-term trend as of 21 Nov 2023 (Source: TradingView, click to enlarge chart)
The US Nas 100 Index (a proxy for the Nasdaq 100 futures) has staged a significant accumulated return of 14% since the retest of its 200-day moving average on 26 October 2023.
It has surpassed its 50-day moving average and erased the entire ex-post-summer losses inflicted from mid-July 2023 to the end of October 2023.
In addition, market breadth has improved remarkably as well where the percentage of Nasdaq 100 component stocks that are trading above their respective 200-day moving average has increased to 67% as of yesterday, 20 November.
Short-term uptrend phase remains intact
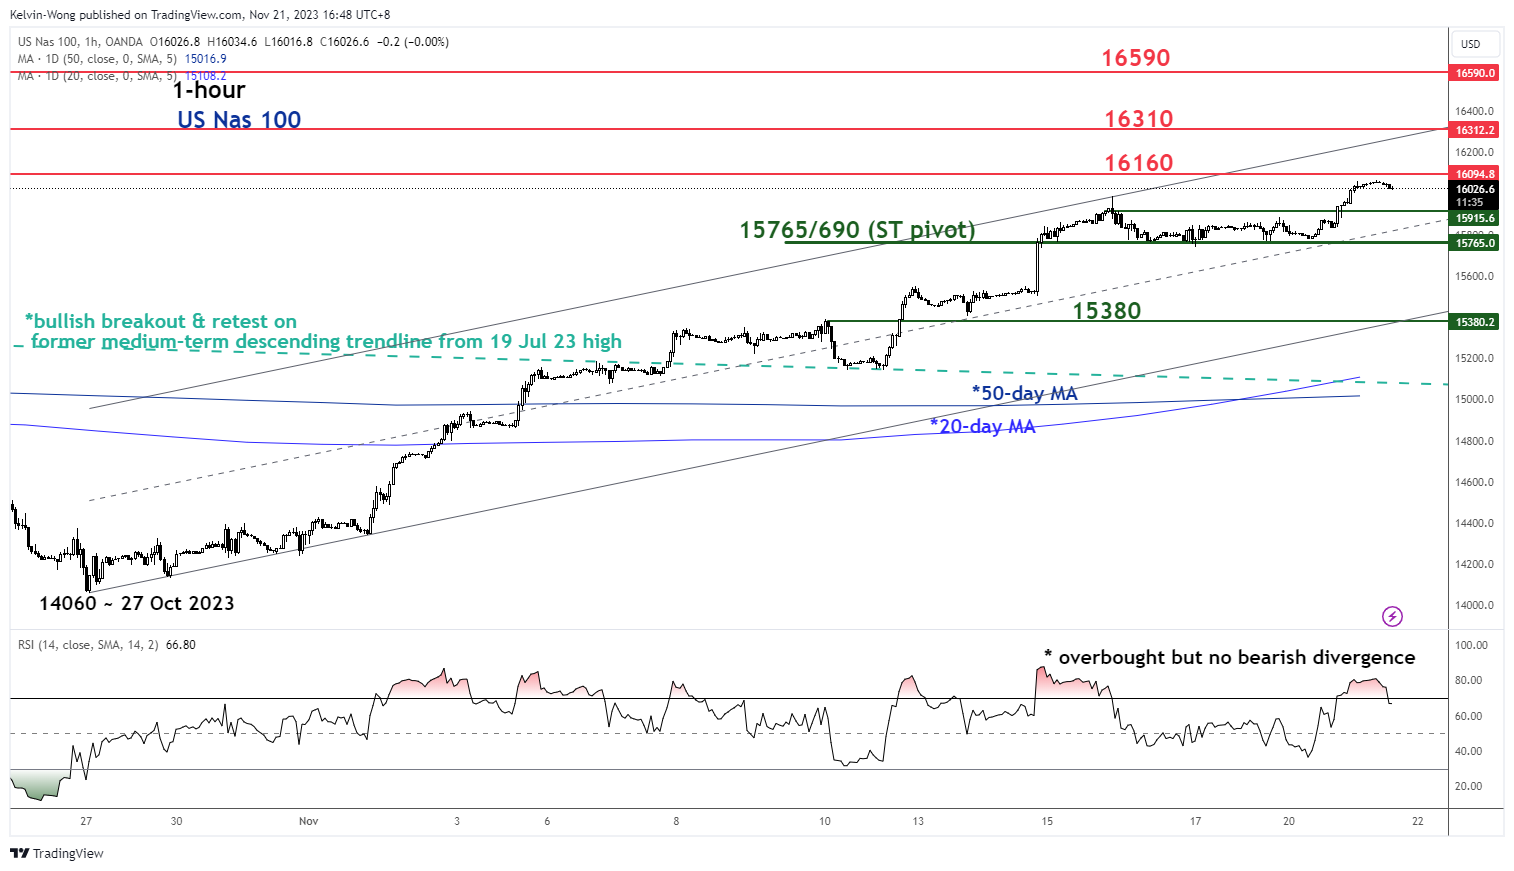
Fig 2: US Nas 100 minor short-term trend as of 21 Nov 2023 (Source: TradingView, click to enlarge chart)
Price actions of the US Nas 100 Index have continued to oscillate within a minor short-term ascending channel in place since the 27 October 2023 low of 14,060.
The hourly RSI momentum indicator has just exited from its overbought region but without any bearish divergence condition. This observation suggests that price actions of the Index may shape a minor pull-back within the short-term ascending channel rather than a deeper bearish reversal scenario.
Watch the 15,765/15,690 key short-term pivotal support (the minor swing low areas of 16/17 November 2023 & median line of the short-term ascending channel) to maintain the current impulsive upmove sequence. A clearance above the near-term resistance of 16,160 sees the next intermediate resistance coming in at 16,310 (upper boundary of the short-term ascending channel) in the first step.
On the flip side, a break below 15,690 negates the bullish tone to expose the next intermediate support at 15,380 (also the lower boundary of the short-term ascending channel).
Aussie Extends Gains on Hawkish RBA Minutes
- RBA says rate hike was needed to avoid larger increases
- Fed releases meeting minutes later today
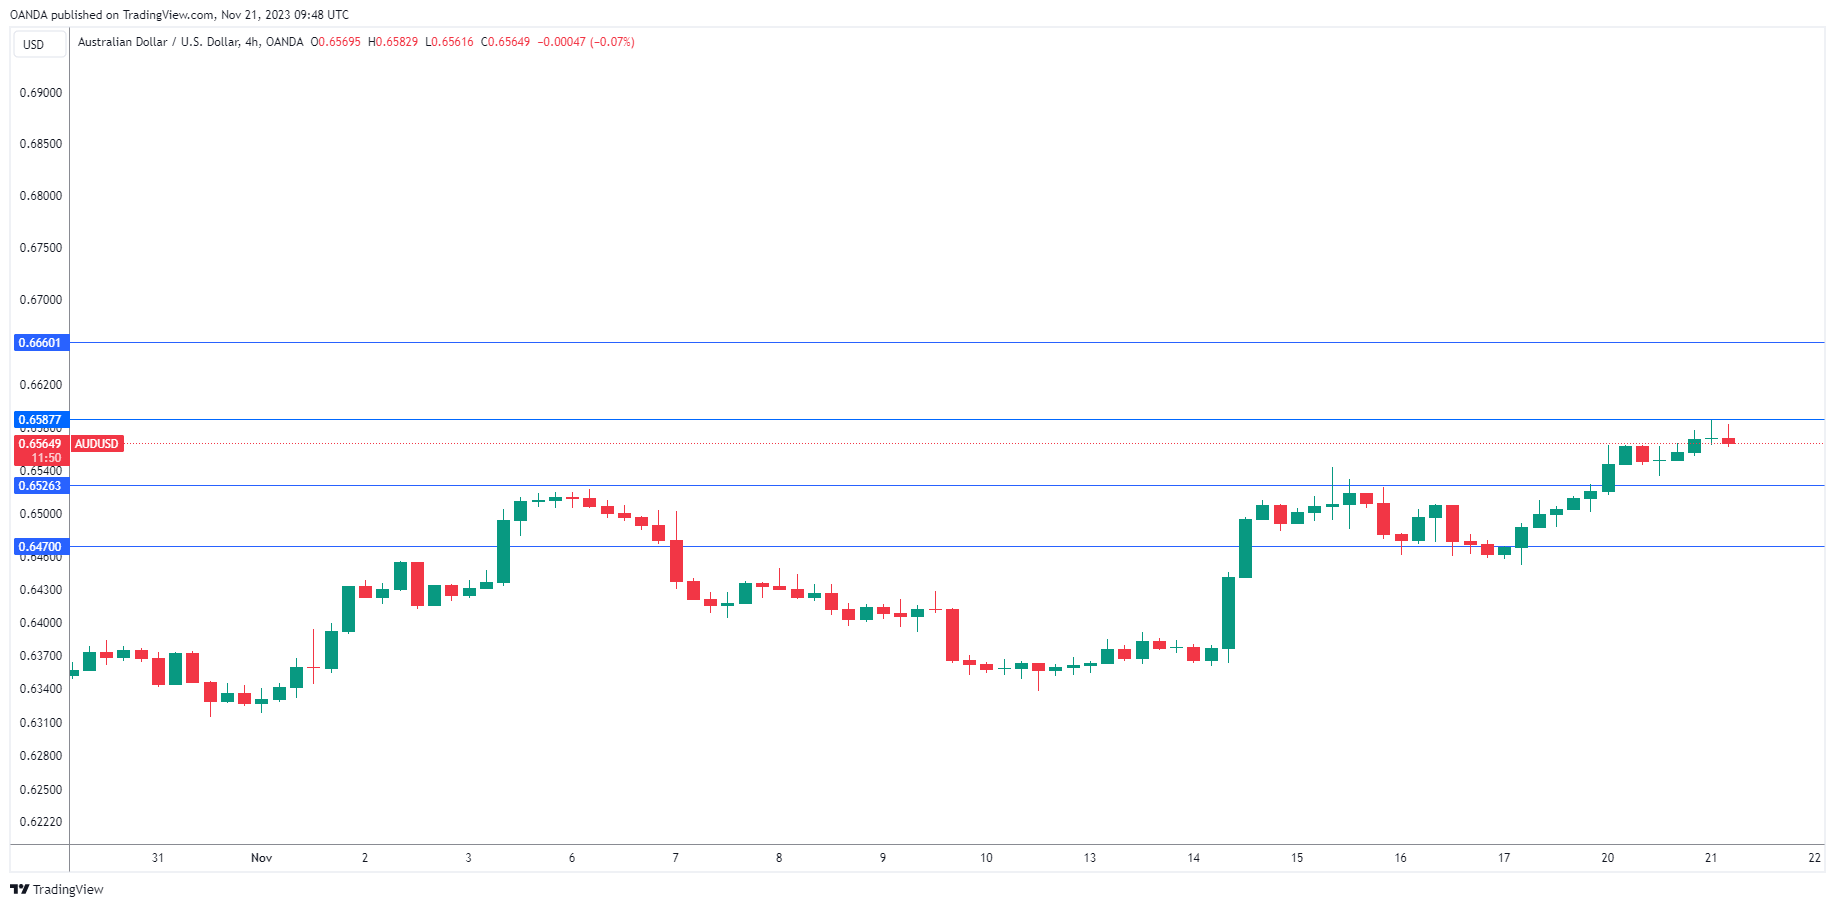
The Australian dollar continues to rally. In the European session, AUD/USD is trading at 0.6567, up 0.15%. The Aussie has looked sharp, rising over 3% since November 14th.
RBA minutes detail rate hike
The Reserve Bank of Australia minutes, released earlier today, provided insights into the rate hike at the November meeting. The markets perceived the increase as a ‘dovish hike’ and the Australian dollar fell sharply in the aftermath of the decision. However, the minutes paint a different view of the hike, stating that it was intended to lower the risk of a “larger monetary policy response”, given stubbornly high inflation and a strong economy.
The minutes noted that inflation risks remain tilted to the upside and that the RBA’s forecast of inflation falling within the 2%-3% target range was based on one or two rate hikes. The RBA statement at the November meeting also warned that inflation remained too high but the markets didn’t pay much attention. Instead, investors focused on language that hinted that the bar had been raised for further rate hikes. The markets have priced in a pause in December at 95% but the minutes could serve as a strong reminder that the RBA is serious when it says further rate hikes are possible.
The Federal Reserve releases the minutes of its November meeting later today. At the meeting, the Fed held rates at 5.25-5.50% for a second straight time. Fed Chair Powell struck a hawkish note after the meeting, saying that inflation remained too high and left the door open to further rate hikes. I expect the minutes will contain a similar message but it’s questionable whether the markets will change expectations of a rate cut in mid-2024, even if the minutes are hawkish..
AUD/USD Technical
- AUD/USD is putting pressure on resistance at 0.6587. Above, there is resistance at 0.6660
- 0.6526 and 0.6470 are providing support
Gold Approaching 2,000 as FOMC Minutes Expected to be Dovish
On Monday, gold (XAU) price dropped to 1,965 but later recovered sharply on the back of falling U.S. Treasury yields.
Possible effects for traders
XAUUSD has gained more than 2% over the past six trading sessions as easing U.S. inflation fuelled investors' expectations that the Federal Reserve (Fed) may begin cutting interest rates in early 2024. According to the CME FedWatch Tool, the market is currently pricing in a 30% chance of a rate cut in March and a 50% probability of a 25-basis-point cut by May. At the same time, investors may be getting overly optimistic about the end of the U.S. monetary policy tightening, while the Fed may remain hawkish longer than the market expects. Thomas Barkin, Richmond Fed President, recently stated that inflation is expected to persist, encouraging the Fed to maintain high interest rates.
XAUUSD rose sharply during the Asian and early European trading sessions as the U.S. Dollar Index (DXY) and U.S. Treasury yields continued declining. Today, traders should focus on the Federal Open Market Committee (FOMC) minutes from the November meeting at 7:00 p.m. UTC. The release of the protocols is usually associated with increased volatility, but some analysts expect the market to be quiet. 'I think the minutes will be a non-event. <...> There was not going to be any mention of cuts, Jerome Powell made that very clear in his news conference. It's just the market that's expecting cuts from the Fed,' said Edward Meir, a metals analyst at Marex. 'Spot gold may revisit its 27 October high of $2,009.29 per ounce, as it has pierced above a resistance at 1,991,' said Reuters analyst Wang Tao.
AUD at Four-Month High after Hawkish RBA Minutes
On Monday, the Australian dollar (AUD) surged by 0.74% and settled above the critical 0.65500 level as investors continued to close their bullish bets on the U.S. dollar, believing the Federal Reserve (Fed) has finished raising its base rate.
Possible effects for traders
AUDUSD has risen by 3% over the past six trading sessions as the combination of positive factors pushed the currency toward a four-month high. Firstly, the market doesn't expect more rate hikes from the Fed as recent U.S. economic data showed the economy and inflation are slowing. Secondly, there are reports that China's central bank is considering launching a stimulus program to support the economy. Bloomberg reported that Chinese regulators were drafting a list of 50 real estate developers eligible for a range of funding. China is a key importer of Australian goods, and any upbeat economic news tends to positively impact the AUD exchange rate. Finally, the Reserve Bank of Australia (RBA) has recently published the minutes from its previous meeting, which clearly showed that the officials' sentiment remains rather hawkish. The protocols stated that 'the members agreed there was a risk of inflation expectations increasing if the Board left the cash rate unchanged at this meeting.'
AUDUSD continued to rise strongly in the Asian and early European trading sessions after hawkish RBA minutes. AUDUSD may experience extra volatility today due to the FOMC minutes at 7 p.m. UTC. Now, the market seems to believe that the U.S. inflation has been beaten, and the regulator may turn dovish. Therefore, AUUDSD may fall sharply if the minutes show that the Fed is still considering more rate hikes.
GBPUSD Accelerates to Fresh 2-Month High
- GBPUSD overcomes 1.2500 key barrier
- RSI and MACD continue bullish bias
- The 20- and 50-day SMAs posted positive cross
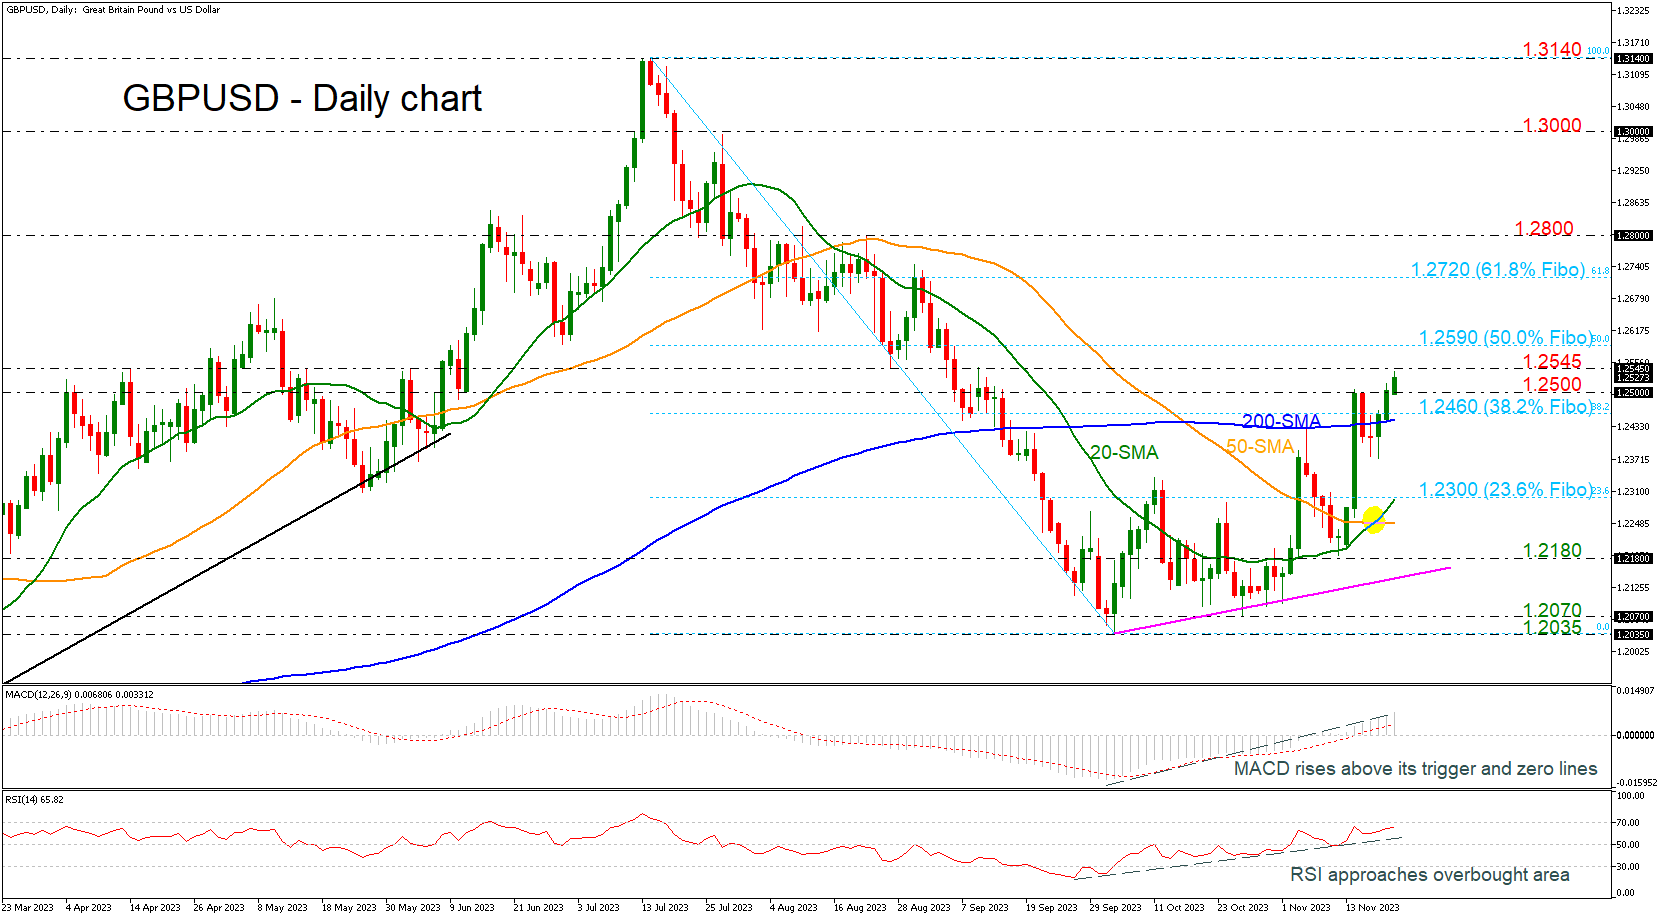
GBPUSD is looking to resume its bullish trend as the price is creating the third consecutive green day, surpassing the 200-day simple moving average (SMA) and the 1.2500 psychological mark. Also, the pair rose to its highest level of the last two months, with the technical oscillators suggesting strengthening upside momentum.
The RSI is above its 50 neutral mark and is approaching the overbought region, continuing the uptrend after it bottomed on September 27, while the MACD is keeping its footing above its trigger line within the positive area, both reflecting that buyers are still active.
If buyers stay in control, the door will open for the 1.2545 resistance level and the 50.0% Fibonacci retracement of the down leg from 1.3140 to 1.2035 at 1.2590. Running higher, the pair will have to face the 61.8% Fibonacci at 1.2720.
Should the bears press the price below the 38.2% Fibonacci of 1.2460 and the 200-day SMA, this may result in an aggressive downfall towards the 23.6% Fibonacci of 1.2300. If the latter gives away too, the decline could continue towards the bullish crossover between the 20- and the 50-day SMAs at 1.2250.
In a nutshell, despite the latest exciting rally in GBPUSD, there are some obstacles to consider before a real bullish trend reversal takes place with regards to the medium-term outlook.