
Sample Category Title
EU Push for Tighter Fiscal Policies in 2024
Market movers today
US durable goods orders for October will provide more clues to US investment spending. Due to Thanksgiving tomorrow, weekly initial jobless claims are also released today, a day earlier than usual.
In the euro zone consumer confidence for November is due out in the afternoon.
The Netherlands holds general elections to choose a new parliament. Recent polls suggest that the election will be very close with none of the big parties polling over 20 percent leading to a fragmented parliament. Hence, a new coalition is therefore prone to consist of at least three and maybe even more parties with prolonged coalition talks. Thus, significant policy changes are unlikely, and the election will probably result in another moderate government with focus on immigration, housing, climate issues, and a constructive engagement with the EU. We receive the first exit polls from Ipsos at 21:00 CET and expect a prediction from the largest news agency around midnight.
Today, UK chancellor Jeremy Hunt will present the Autumn Statement. There has been speculation of whether tax cuts will be announced amongst other changes to income taxes, inheritance tax and/or national insurance. The measures presented will try to help the Conservative party following poor performance in the polls with election year coming up. According to the latest Politico poll of voting intention from 17 November the Conservatives stand at 27% while the Labour party has pulled ahead at 45%. However, with the "mini"-budget scandal still fresh in mind, the chancellor will be wary to incorporate anything which will not ensure and signal debt sustainability over the forecast horizon. Overall, we do not expect this to be a market mover event and by extension for GBP.
The 60 second overview
Fed: Minutes from the FOMC's November meeting provided markets with little new information last night. With regards to financial conditions, participants noted that moves in Treasury yields 'could be volatile', and that any tightening in financial conditions would have to be persistent to have an impact on monetary policy. While most of the recent Fed commentators have called for patience with rate changes, some participants flagged that it was 'critical' that monetary policy remained sufficiently restrictive. In terms of risk outlook, 'most participants continue to see upside risks to inflation'. As such, the Fed's focus remains on incoming data with the next key release being the Flash PMIs on Friday. So far, early November data has been mixed; yesterday Philly Fed non-manufacturing business activity index rose modestly from October, contrasting weaker signals from jobless claims and consumer sentiment released earlier. Overall, we still think the Fed is likely done with rate hikes for now.
Fiscal policy: The EU Commission has presented its opinion on the 2024 draft budgets for the euro area member states in its European Semester Autumn Package. The main conclusion is that The Draft Budgetary Plans of Belgium, Finland, France, and Croatia risk not being in line with the Council Recommendations. German budget plans are not fully in line with the recommendations and Germany should wind down energy support measures as soon as possible. The fiscal rules of the EU have not functioned well, and no country had ever received a fine for breaching the rules. Hence, the impact on the opinion from the Commission might not mean much. Yet, with new fiscal rules being currently negotiated the possibility of stronger enforcement next year increased the risk that countries such as France and Belgium have to adjust to more austere fiscal policy in 2024.
Rate cut: The Hungarian central bank cut its base rate by 75bps to 11.5% yesterday. Hungary has the highest inflation rate in the EU but inflation has declined from 25% in Q1 to 9.9% in October.
Equities: Global equities were lower yesterday after a long winning streak. The drop was in no way dramatic and it is hard to pinpoint one single factor or data point leading to the slight drop in risk appetite. Defensives outperformed cyclicals and small caps sold off. However, if we take a look at the VIX index, it came slightly lower again yesterday despite equities losing a bit of steam. It has been remarkable to see how quick VIX has been coming down from 22 to 13. No doubt it has led to substantial buying from CTA funds, and they have played a big role in the strong run of equites during the last month. The tailwind to equities from CTA funds and in general positioning will be a lot lower going forward. US equities yesterday: Dow -0.2%, S&P 500 -0.2%, Nasdaq -0.6% and Russell 2000 -1.3%. Small gains in Asia this morning while futures in Europe and US are roughly unchanged.
FI: The bund curve bull flattened a couple of basis points from the long end of the curve in a relatively calm session yesterday. The German ASW spreads widened a bit following the significant tightening seen recently. The market reaction following the FOMC minutes was muted as policy signals were generally in line with what has recently been communicated by members. 10Y UST yields ended the day close to unchanged, while the short end of the curve was down 2-3bp.
FX: EUR/USD declined modestly during yesterday's session with the release of FOMC's November meeting minutes last night offering little news. NOK FX has been this week's winner in a move fully attributable to the external investment environment and not least the rise in EM- and commodity FX vs the USD. GBP was one of yesterday's winners following hawkish remarks from BoE Governor Bailey but we expect today's Autumn Statement to offer muted market reactions. In line with our expectation, EUR/DKK has dropped back below the central rate again to a level around 7.4550.
Credit: Credit spreads were slightly wider yesterday as iTraxx Main closed at 69bp (+1bp) and Xover at 383bp (+2bp). Primary market activity remained vibrant with many deals priced across the corporate and financial segments. Within the latter, Caixabank drew solid demand for its 10y EUR1bn senior preferred deal, while in covered bonds Wuestenrot Bausparkasse struggled to generate sufficient demand for its 5y EUR500m green bond, thus becoming the latest example to show that the market remains challenging particularly for smaller issuers.
USD/JPY Daily Outlook
Daily Pivots: (S1) 147.51; (P) 148.05; (R1) 148.94; More...
Intraday bias in USD/JPY is turned neutral first with current recovery. Some consolidations would be seen above 147.14 temporary low first. But risk will stay on the downside as long as 55 4H EMA (now at 149.73) holds. Below 147.14 will target medium term channel support at 146.00 next. Nevertheless, sustained break of 55 4H EMA will revive near term bullishness, and target a retest on 151.89/93 resistance zone.
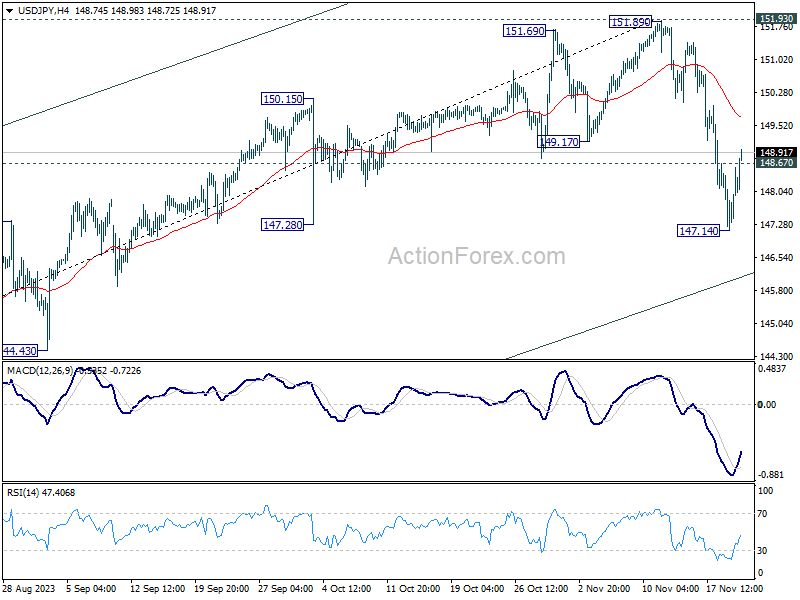
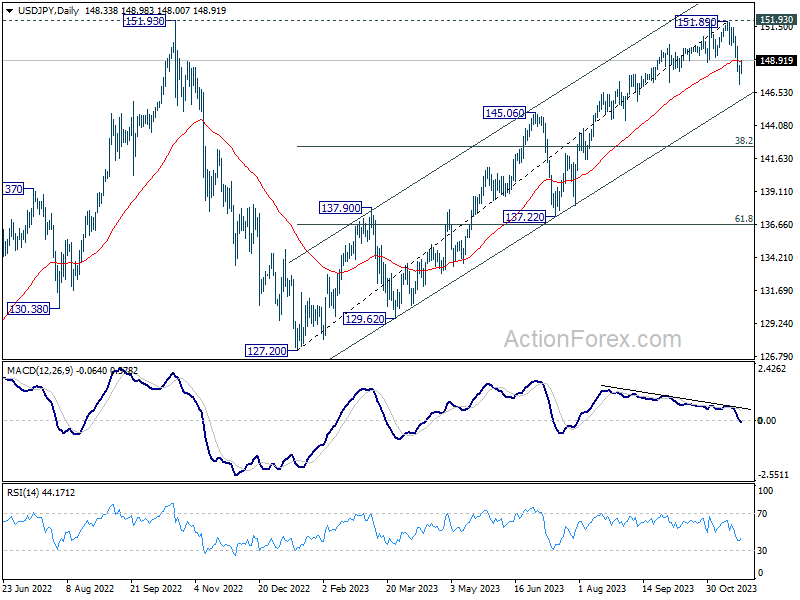
In the bigger picture, rise from 127.20 (2023 low) is seen as the second leg of the pattern from 151.93 resistance (2022 high). Decisive break of 145.06 resistance turned support will confirm that this second leg has completed, after rejection by 151.93. Deeper fall would be seen through 38.2% retracement of 127.20 to 151.89 at 142.45 to 61.8% retracement at 136.63. Nevertheless strong bounce from 145.06 will retain medium term bullishness for another test on 151.93 at a later stage.
Dollar Stabilizes, Yen Retreats, Euro Loses Momentum
As Thanksgiving long weekend approaches, a noticeable tranquility has enveloped the financial markets. The aftermath of FOMC minutes, which revealed a slightly toned-down hawkish stance, has resulted in rather subdued market reactions. Major stock indices have slightly retreated from their recent advances, reflecting a cautious sentiment among investors. Correspondingly, 10-year Treasury yield also concluded yesterday's session almost unchanged. At the same time, Dollar is showing signs of steadying after a period of selloffs. This stabilization suggests the possibility Dollar entering a phase of near-term recovery, although the extent and sustainability of this trend remain to be seen.
Japanese Yen, on the other hand, is pulling back from its recent strong bounce. This retracement comes on the heels of Japan's government downgrading its economic assessment for the first time in a 10 months. While the market still anticipates BoJ to exit its negative interest rate policy in the upcoming year, investors may be looking for additional positive signals or confidence boosters to reignite momentum in Yen.
In terms of weekly performance among major currencies at this point, Euro is currently lagging, positioned as the weakest, closely followed by Dollar and Canadian. New Zealand Dollar stands out as the strongest, with Yen and Sterling also showing robustness. Australian Dollar and Swiss Franc, meanwhile, are mixed.
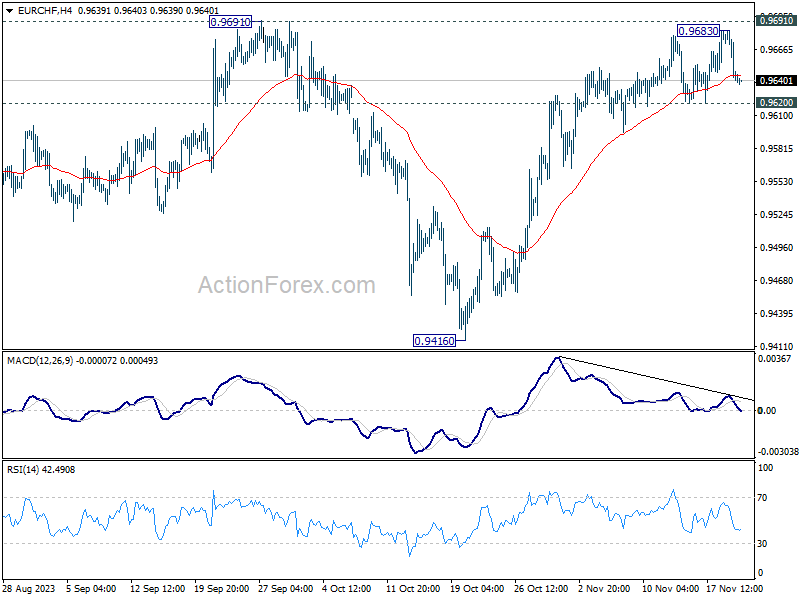
From a technical analysis perspective, as Euro is losing momentum, EUR/CHF is a pair that's worth some attention. Another rise is in favor as long as 0.9620 support holds. Decisive break of 0.9691 resistance will indicate larger bullish trend reversal. However, break of 0.9620 support will indicate short term topping, on bearish divergence condition in 4H MACD, after rejection by 0.9691 structural resistance. In this case, the bullish reversal scenario would be delayed at least, suggesting a near-term pullback in underway first.
In Asia, at the time of writing, Nikkei is up 0.20%. Hong Kong HSI is down -0.10%. China Shanghai SSE is down -0.37%. Singapore Strait Times is up 0.53%. Japan 10-year JGB yield is up 0.0305 at 0.730. Overnight, DOW dropped -0.18%. S&P 500 dropped -0.20%. NASDAQ dropped -0.59%. 10-year yield dropped -0.004 to 4.418.
FOMC minutes indicate cautious approach and possible softening in hawkish stance
A key takeaway from FOMC minutes from October 31-November 1 meeting is the consensus on proceeding with caution, as indicated by the unanimous agreement that "the Committee was in a position to proceed carefully."
The minutes also emphasized Fed's readiness to implement further tightening measures if the progress toward its inflation target is deemed insufficient. This stance is aligned with Fed's ongoing commitment to combatting inflation, as reflected in the sentiment that "further tightening of monetary policy would be appropriate if incoming information indicated that progress toward the Committee's inflation objective was insufficient."
The committee members were also unanimous in their view that restrictive policy stance should be maintained until inflation shows a sustainable decline towards Fed's target. This highlights Fed's focus on ensuring that inflationary pressures are adequately managed before considering any policy easing.
However, a notable shift in the committee's outlook was observed in the latest minutes. The previous stance, which suggested that "one more increase in the target federal funds rate at a future meeting would likely be appropriate," was conspicuously absent in the latest document. This omission may signal a slight softening in the FOMC's hawkish stance, indicating a potential pivot in future policy decisions.
ECB's Lagarde emphasizes vigilance in inflation battle, outlines wage dynamics and policy outlook
ECB President Christine Lagarde, in her speech overnight, cautioned against premature optimism on the ongoing fight against inflation in Eurozone, stating emphatically, "this is not the time to start declaring victory".
Lagarde highlighted the complex nature of inflation in the Eurozone, stressing the need for ongoing attentiveness to the risks of "persistent inflation". The dynamics of "wage-setting" in the region, which are often "multi-annual and staggered", play a significant role in this context.
She pointed out that "the high inflation rates that are now behind us are still having a significant influence on wage agreements today," indicating the lag effect of past inflation on current wage negotiations.
Addressing the current wage growth scenario, Lagarde opined that it primarily represents "catch-up" effects from past inflation, rather than being driven by expectations of future inflation. However, she noted the importance of monitoring wage developments to assess any potential risks to price stability. This involves closely observing how firms manage rising wages, whether there is an easing of labor market tightness, and ensuring that inflation expectations remain anchored.
Lagarde also reiterated ECB's commitment to maintaining policy rates at sufficiently restrictive levels for as long as necessary to achieve its inflation targets. She emphasized that future decisions will be data-dependent, allowing ECB the flexibility to act again if the risk of missing inflation target increases.
Japan's economic outlook downgraded amid domestic demand weakness
The Japanese government has revised its assessment of the nation's economy, marking the first downgrade in ten months. This change in outlook indicates pausing in part" in Japan's moderate recovery, primarily attributed to weakening domestic demand. This shift represents a departure from the previously consistent description of the economy as "recovering at a moderate pace" over the past six months.
A critical aspect of this revised assessment is the downgraded view on business investment, which has been adjusted for the first time in nearly two years. The government's monthly report cites the slowing of global growth, particularly in China, as a significant factor contributing to the "pausing" in pick-up in business investment.
Despite this downgrade, the Cabinet Office maintained its assessment of other economic components. Private consumption is described as "picking up," driven by a continued recovery in service demand. The report also highlights a positive trend in both industrial production and exports, which are showing signs of "picking up".
The government's report, however, underscores several downside risks to the Japanese economy. These include the impacts of aggressive interest rate hikes in other countries and the economic slowdown in China. Additionally, the government emphasizes the need for full attention to price increases, developments in the Middle East, and fluctuations in financial and capital markets.
Australia's Westpac leading index fell to -0.40%, indicates prolonged low growth
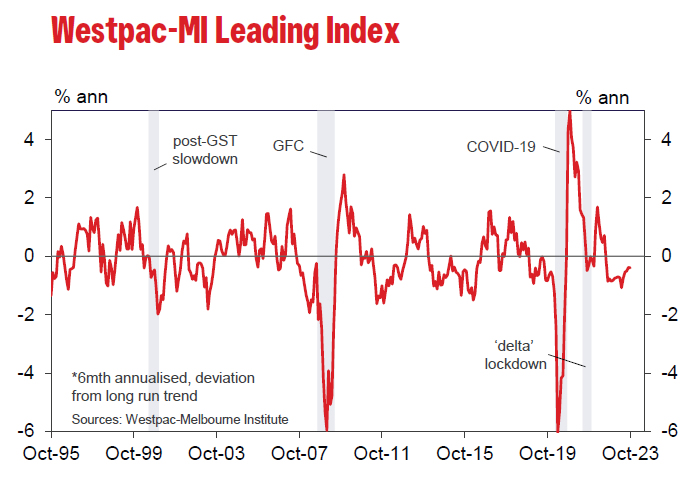
Westpac Leading Index in Australia has shown a marginal decline from -0.38% to -0.40% in October, underscoring the ongoing trend of subdued economic growth. This marks the fifteenth consecutive month where the index's growth rate has been below zero, signaling that the Australian economy is likely to continue experiencing limited growth into 2024.
Despite this, the overall growth rate can still be considered moderately positive, especially when viewed against current annual population growth rate of approximately 2.4%. Both Westpac and RBA project the economy's actual growth to be within the range of 1-2% for both this and the coming year, a rate that lags behind potential trend growth.
A key concern for RBA is the adequacy of this sluggish growth in achieving inflation target of 2-3% within a reasonable timeframe. As highlighted in RBA's recent November meeting minutes, Board maintains a strict stance of "low tolerance" against any further unexpected rises in inflation or delays in returning to the target range. This stance indicates that RBA's policy meetings in the upcoming year will be crucial and "live".
Looking ahead
Main focuses of the day will be US durable goods orders and the weekly jobless claims.
USD/JPY Daily Outlook
Daily Pivots: (S1) 147.51; (P) 148.05; (R1) 148.94; More...
Intraday bias in USD/JPY is turned neutral first with current recovery. Some consolidations would be seen above 147.14 temporary low first. But risk will stay on the downside as long as 55 4H EMA (now at 149.73) holds. Below 147.14 will target medium term channel support at 146.00 next. Nevertheless, sustained break of 55 4H EMA will revive near term bullishness, and target a retest on 151.89/93 resistance zone.
In the bigger picture, rise from 127.20 (2023 low) is seen as the second leg of the pattern from 151.93 resistance (2022 high). Decisive break of 145.06 resistance turned support will confirm that this second leg has completed, after rejection by 151.93. Deeper fall would be seen through 38.2% retracement of 127.20 to 151.89 at 142.45 to 61.8% retracement at 136.63. Nevertheless strong bounce from 145.06 will retain medium term bullishness for another test on 151.93 at a later stage.
Economic Indicators Update
| GMT | Ccy | Events | Actual | Forecast | Previous | Revised |
|---|---|---|---|---|---|---|
| 00:00 | AUD | Westpac Leading Index M/M Oct | 0.00% | 0.10% | ||
| 13:30 | USD | Initial Jobless Claims (Nov 17) | 225K | 231K | ||
| 13:30 | USD | Durable Goods Orders Oct | -3.20% | 4.60% | ||
| 13:30 | USD | Durable Goods Orders ex-Transport Oct | 0.20% | 0.40% | ||
| 15:00 | USD | Michigan Consumer Sentiment Index Nov F | 61.1 | 60.4 | ||
| 15:00 | EUR | Eurozone Consumer Confidence Nov P | -18 | -18 | ||
| 15:30 | USD | Crude Oil Inventories | 0.9M | 3.6M | ||
| 17:00 | USD | Natural Gas Storage | 1B | 60B |
Technical Outlook and Review
DXY:
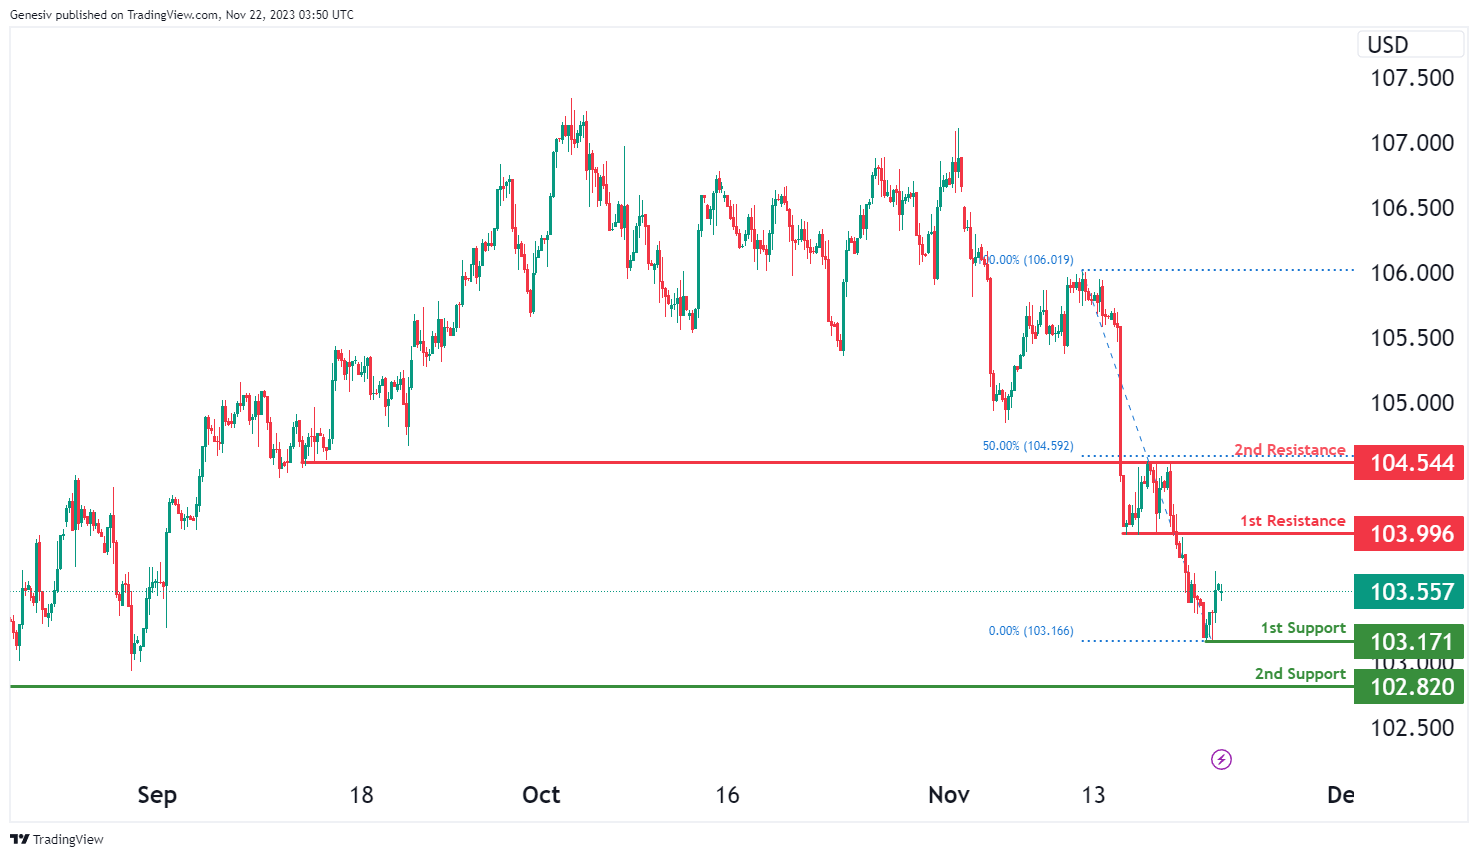
The DXY (US Dollar Index) chart currently indicates a bullish momentum, suggesting a potential bullish continuation towards the first resistance at 103.99.
The first support at 103.17 is identified as a swing low support, indicating a level where the price might find buying interest. Additionally, the second support at 102.82 is recognized as an overlap support, reinforcing the potential strength of the support zone.
On the resistance side, the first resistance at 103.99 is significant due to its pullback resistance, marking a crucial level where the price might face selling pressure or potential reversals within its upward movement. Furthermore, the second resistance at 104.54 is identified as another overlap resistance, emphasizing its importance as a potential hurdle for the price and a point where it might encounter obstacles in its bullish continuation.
EUR/USD:
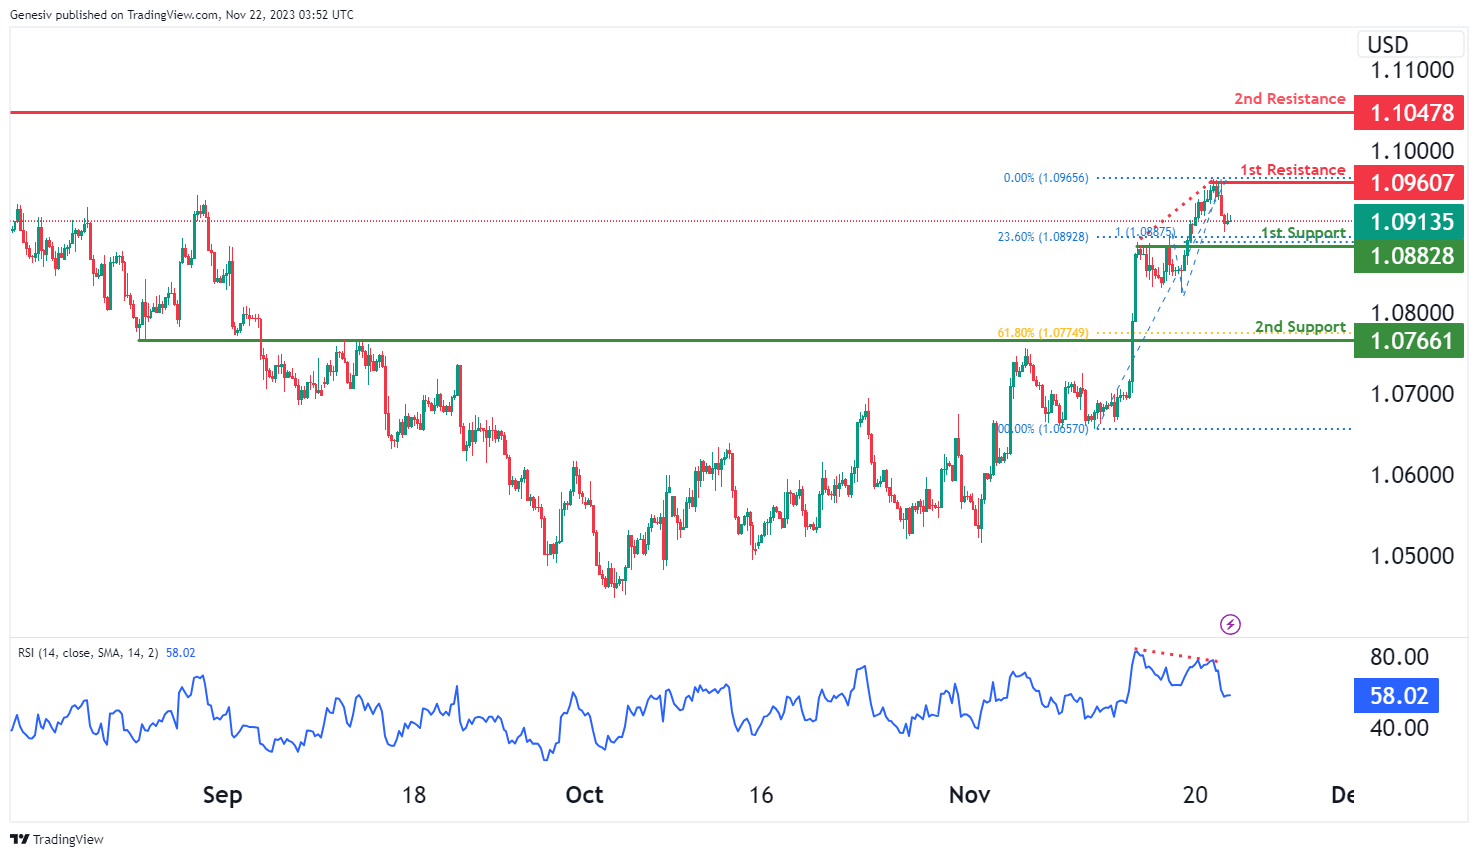
The EUR/USD chart currently indicates a bearish momentum, suggesting a potential bearish continuation towards the first support at 1.0882.
The first support at 1.0882 is identified as a pullback support, coinciding with the 23.60% Fibonacci Retracement and the 100% Fibonacci Projection, indicating a level where the price might find buying interest. Additionally, the second support at 1.0766 is recognized as another pullback support, coinciding with the 61.80% Fibonacci Retracement, reinforcing the potential strength of the support zone.
On the resistance side, the first resistance at 1.0960 is significant due to its swing high resistance, marking a crucial level where the price might face selling pressure or potential reversals within its downward movement. Furthermore, the second resistance at 1.1047 is identified as a multi-swing high resistance, emphasizing its importance as a potential hurdle for the price and a point where it might encounter obstacles in its bearish continuation.
It’s noteworthy that the RSI (Relative Strength Index) is displaying bearish divergence versus price, suggesting that a reversal might occur soon.
EUR/JPY:
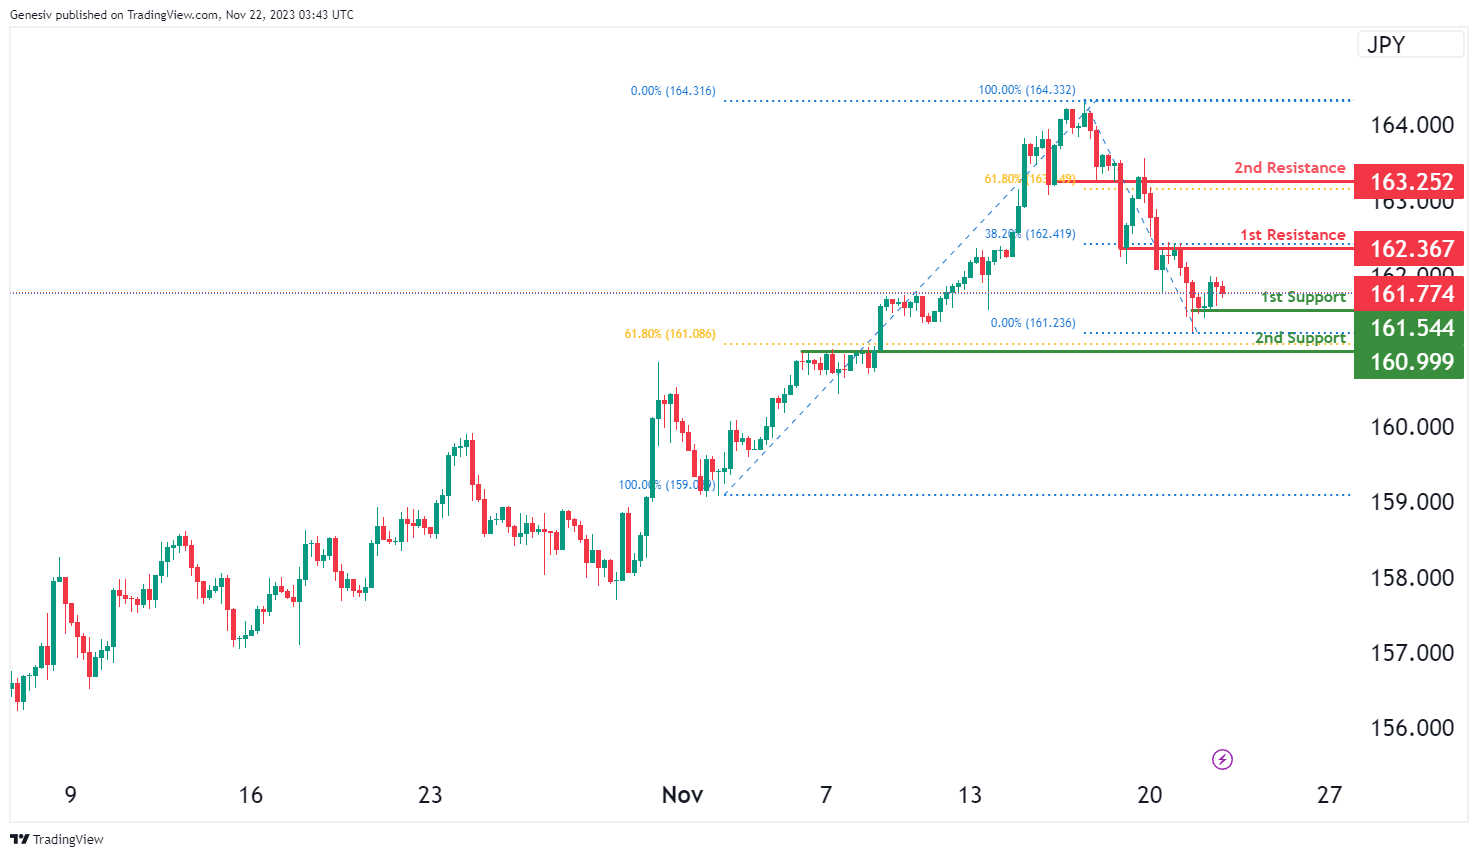
The EUR/JPY chart currently indicates a bullish momentum, suggesting a potential drop to the first support at 161.54 in the short term before bouncing and rising towards the first resistance at 162.36.
The first support at 161.54 is identified as a swing low support, indicating a level where the price might find buying interest. Additionally, the second support at 160.99 is recognized as a pullback support, coinciding with the 61.80% Fibonacci Retracement, reinforcing the potential strength of the support zone.
On the resistance side, the first resistance at 162.36 is significant due to its overlap resistance, marking a crucial level where the price might face selling pressure or potential reversals within its upward movement. Furthermore, the second resistance at 163.25 is identified as another overlap resistance, emphasizing its importance as a potential hurdle for the price and a point where it might encounter obstacles in its bullish continuation.
EUR/GBP:
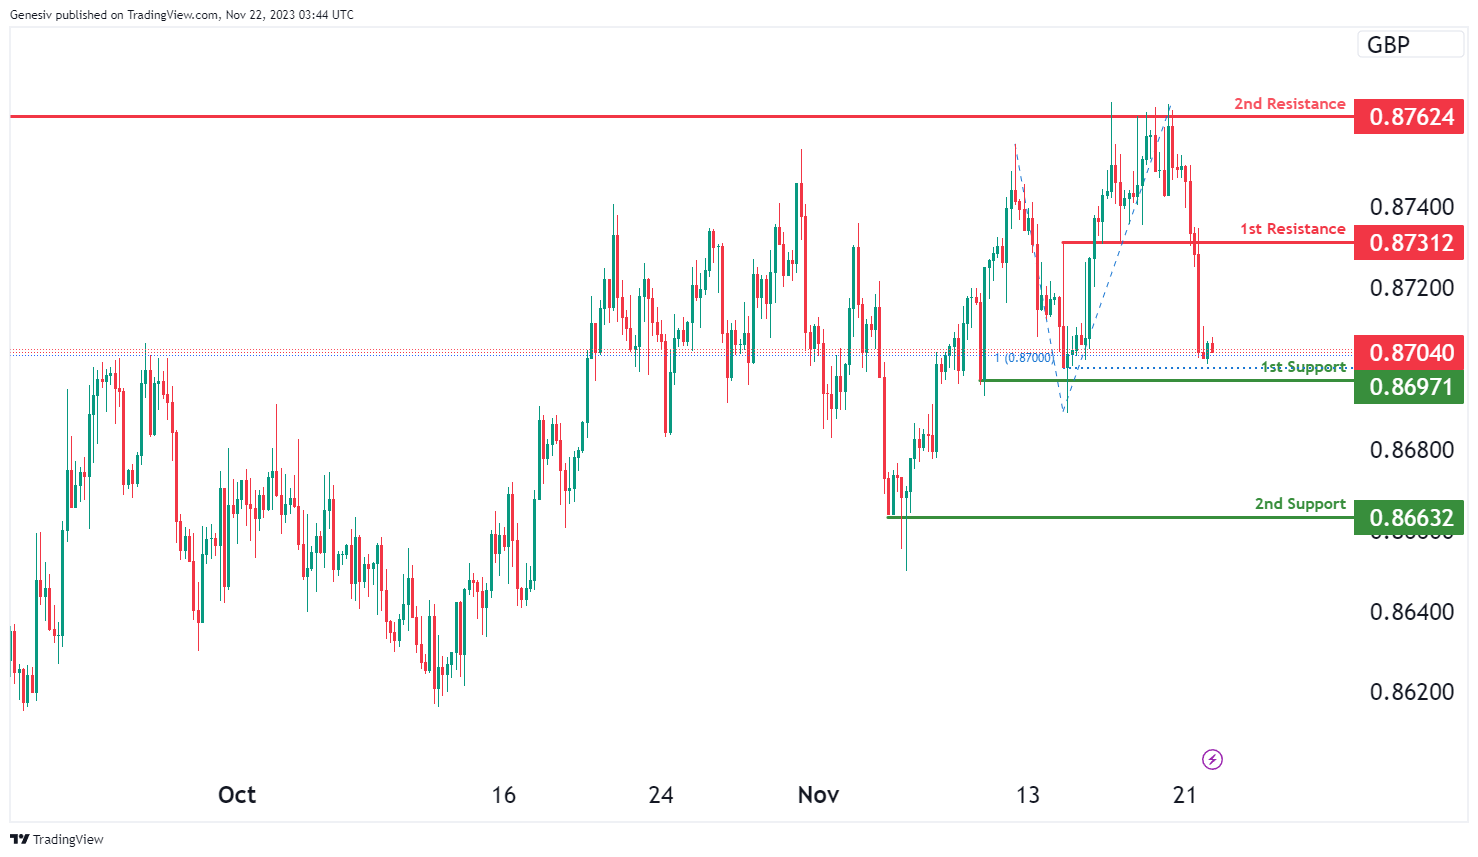
The EUR/GBP chart currently indicates a bullish momentum, suggesting a potential bullish bounce off the first support at 0.8697 towards the first resistance at 0.8731.
The first support at 0.8697 is identified as a swing low support, coinciding with the 100% Fibonacci Projection, indicating a level where the price might find buying interest. Additionally, the second support at 0.8663 is recognized as another swing low support, reinforcing the potential strength of the support zone.
On the resistance side, the first resistance at 0.8731 is significant due to its pullback resistance, marking a crucial level where the price might face selling pressure or potential reversals within its upward movement. Furthermore, the second resistance at 0.8762 is identified as an overlap resistance, emphasizing its importance as a potential hurdle for the price and a point where it might encounter obstacles in its bullish continuation.
GBP/USD:
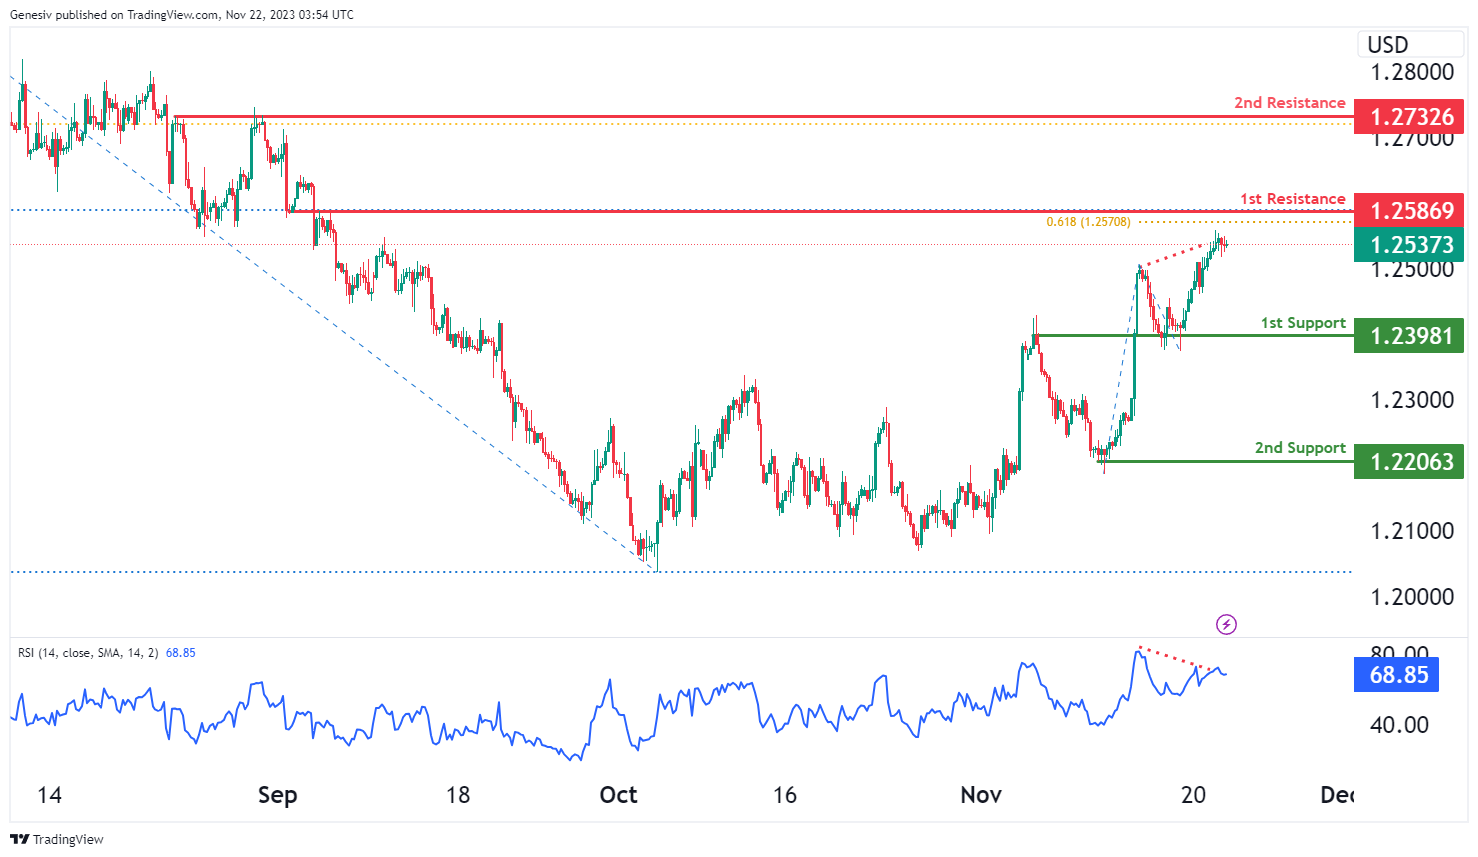
The GBP/USD chart currently shows a bearish overall momentum, and there is a potential scenario for the price to rise towards the first resistance at 1.2586 in the short term before reversing off it and dropping towards the first support at 1.2398.
The first support at 1.2398 is considered significant as an overlap support, indicating a level where the price might find buying interest. Additionally, the second support at 1.2206 is recognized as a swing low support, reinforcing the potential strength of the support zone.
On the resistance side, the first resistance at 1.2586 is crucial due to its nature as an overlap resistance, coinciding with the 50% Fibonacci Retracement and the 61.80% Fibonacci Projection, indicating a level where the price might face selling pressure or potential reversals within its upward movement. Furthermore, the second resistance at 1.2732 is identified as another overlap resistance, coinciding with the 61.80% Fibonacci Retracement, emphasizing its importance as a potential hurdle for the price.
It’s noteworthy that the RSI (Relative Strength Index) is displaying bearish divergence versus price, suggesting that a reversal might occur soon.
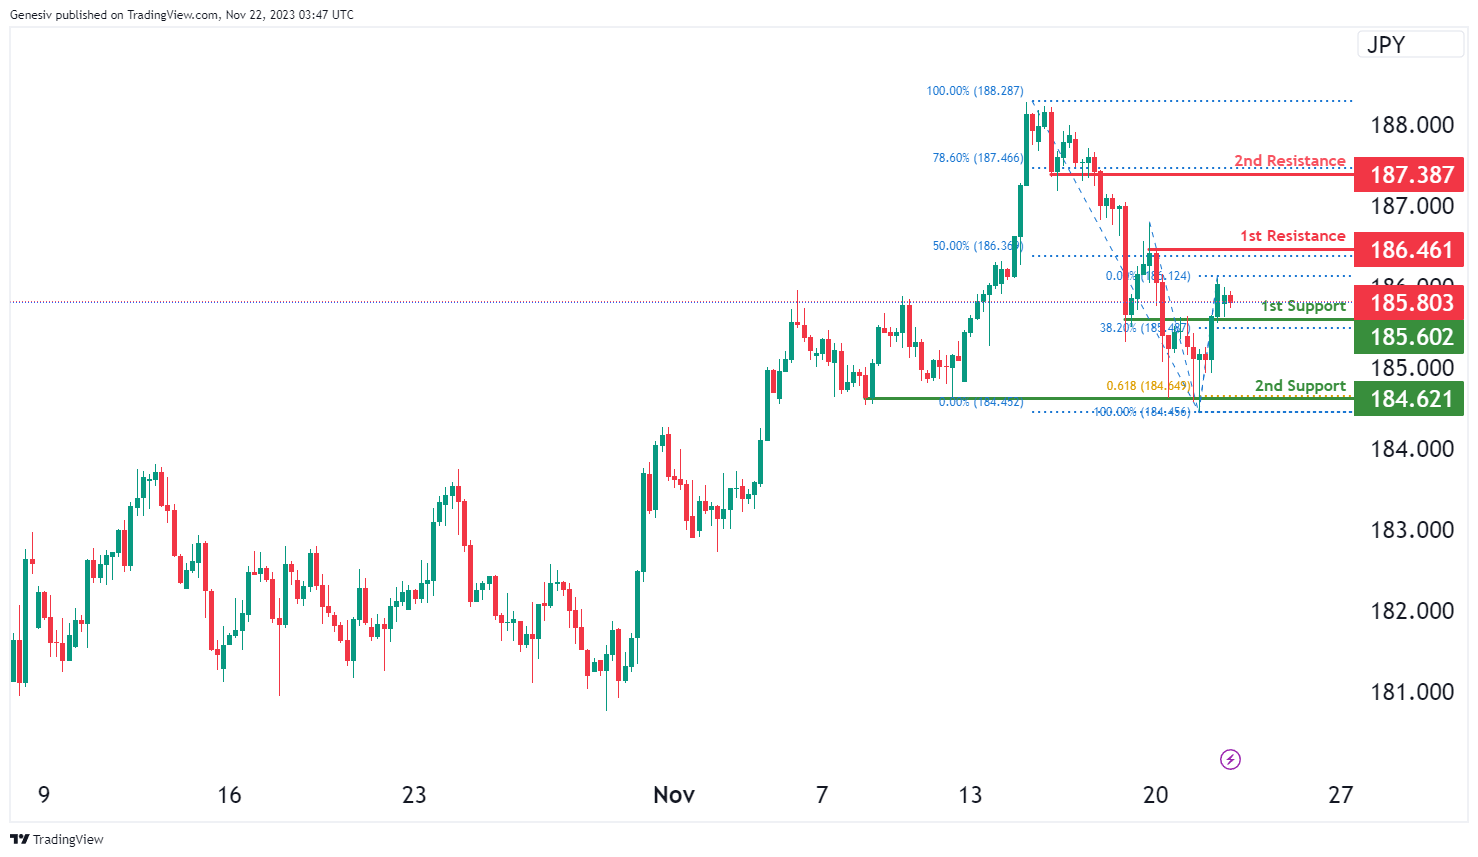
GBP/JPY:
The GBP/JPY chart currently indicates a bullish momentum, suggesting a potential bullish bounce off the first support at 185.60 towards the first resistance at 186.46.
The first support at 185.60 is identified as a pullback support, coinciding with the 38.20% Fibonacci Retracement, indicating a level where the price might find buying interest. Additionally, the second support at 184.62 is recognized as a multi-swing low support, coinciding with the 61.80% Fibonacci Projection, reinforcing the potential strength of the support zone.
On the resistance side, the first resistance at 186.46 is significant due to its swing high resistance, marking a crucial level where the price might face selling pressure or potential reversals within its upward movement. Furthermore, the second resistance at 187.38 is identified as a pullback resistance, coinciding with the 78.60% Fibonacci Retracement, emphasizing its importance as a potential hurdle for the price and a point where it might encounter obstacles in its bullish continuation.
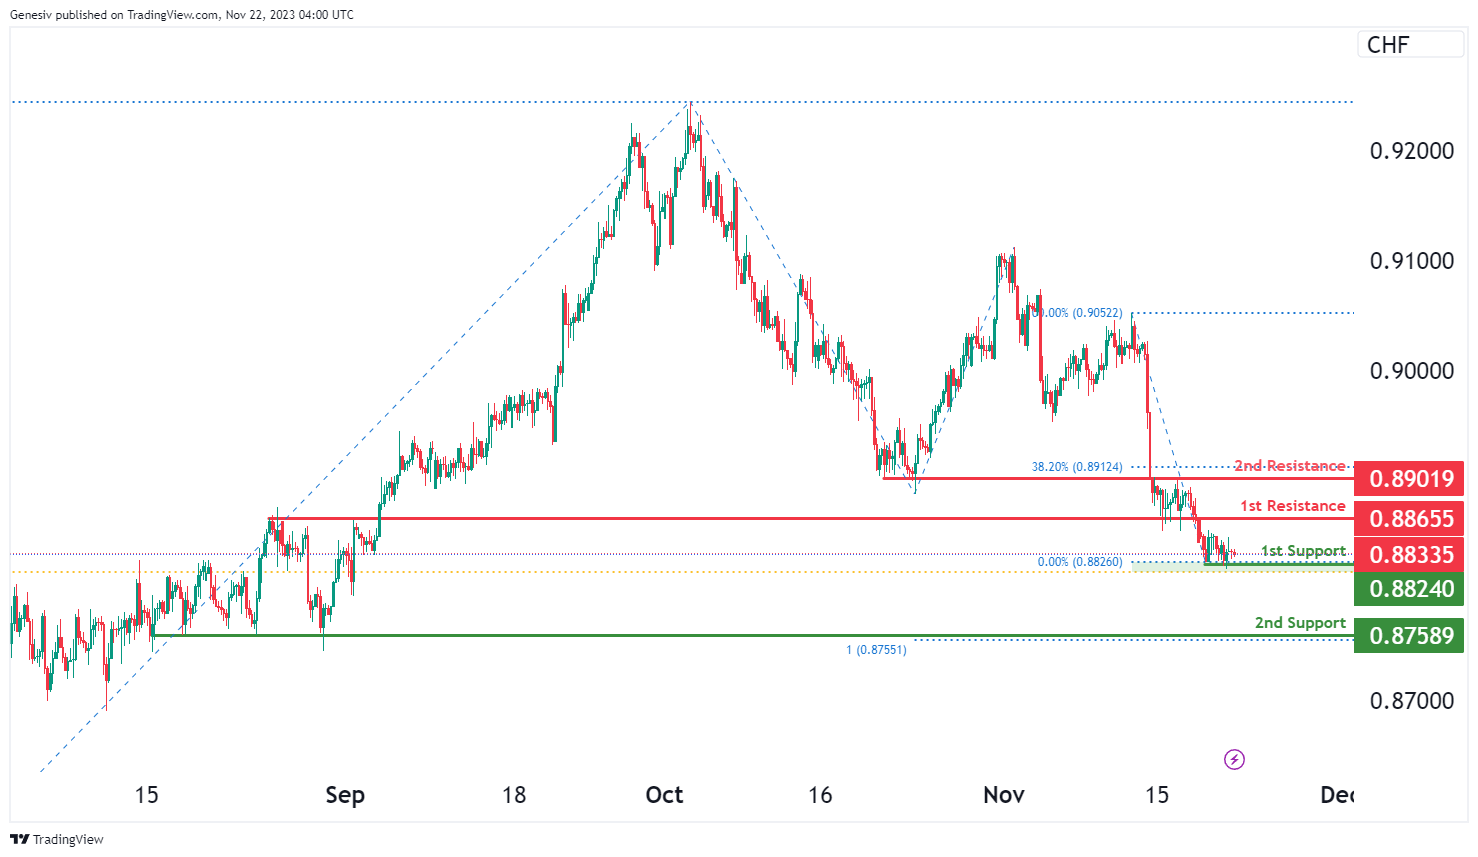
USD/CHF:
The USD/CHF chart currently reflects a neutral overall momentum, indicating a lack of a clear directional bias. There is a potential scenario for the price to fluctuate between the 1st resistance at 0.8865 and the 1st support level at 0.8824.
The 1st support at 0.8824 is considered significant as a multi-swing low support, indicating a level where the price has previously found support across multiple swings. Additionally, it coincides with the 61.80% Fibonacci Retracement, reinforcing its potential as a strong support level.
The 2nd support at 0.8758 is also recognized as a multi-swing low support, further emphasizing the importance of this support zone. Additionally, it aligns with the 100% Fibonacci Projection, indicating potential buying interest at this level.
On the resistance side, the 1st resistance at 0.8865 is crucial due to its nature as a pullback resistance, suggesting a level where the price might face selling pressure or potential reversals within its upward movement.
The 2nd resistance at 0.8901 is identified as an overlap resistance, coinciding with the 38.20% Fibonacci Retracement, emphasizing its significance as a potential hurdle for the price.
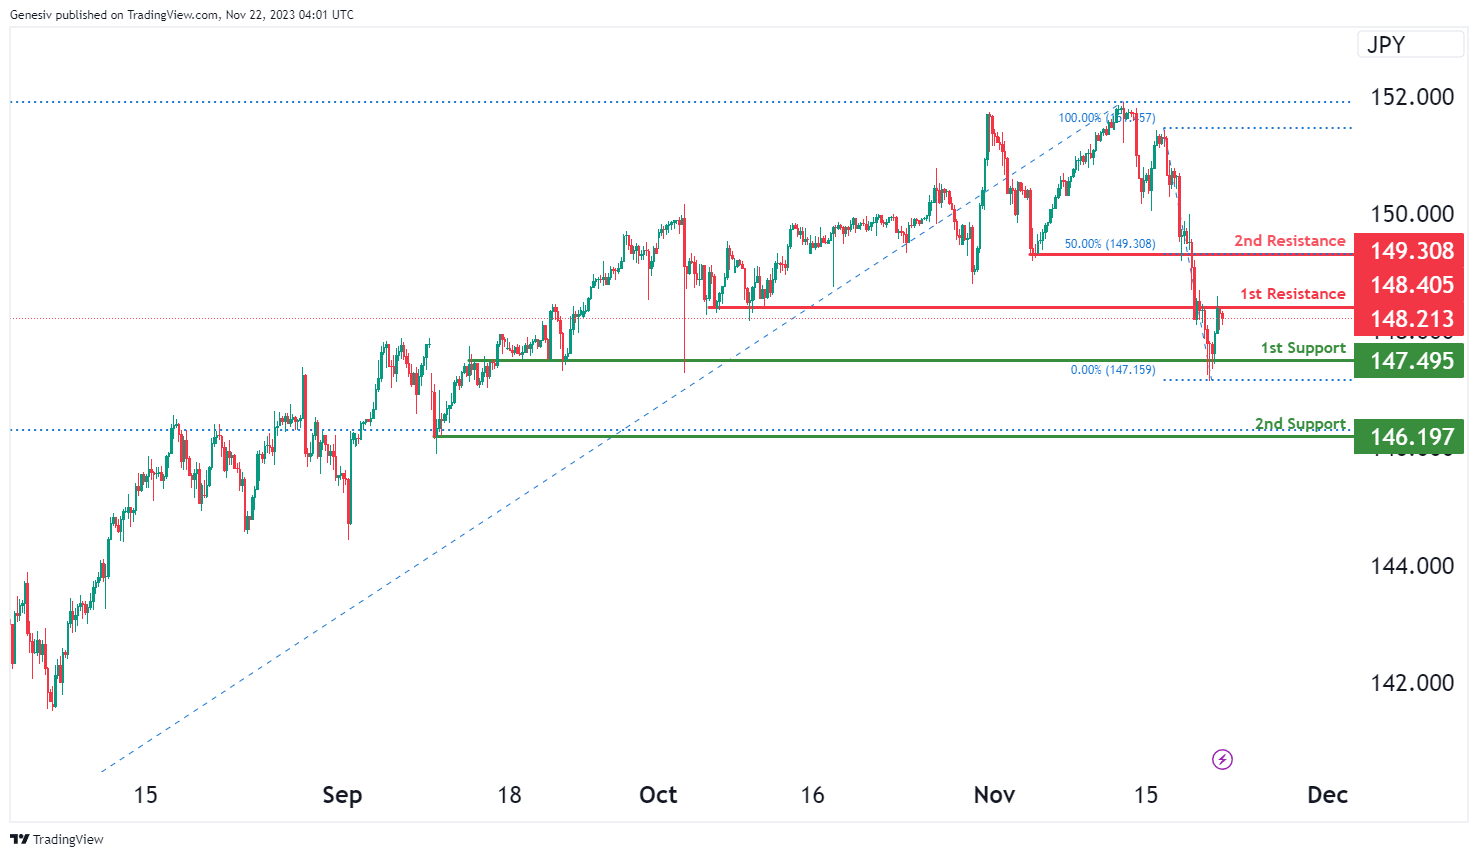
USD/JPY:
The USD/JPY chart currently has an overall bearish momentum, suggesting the potential for a bearish continuation towards the 1st support. There is a possibility that the price might exhibit a bearish reaction off the 1st resistance and subsequently drop to the 1st support.
The 1st support level is identified at 147.49, and the reason it is considered favorable is due to the presence of an overlap support.
The 2nd support level is located at 146.19, and its favorable aspect is attributed to being a swing low support as well as being at the 38.20% Fibonacci Retracement level.
On the resistance side, the 1st resistance is situated at 148.40, and it is deemed significant due to being an overlap resistance.
The 2nd resistance is positioned at 149.30, and its significance is derived from being a pullback resistance and coinciding with the 50% Fibonacci Retracement level.
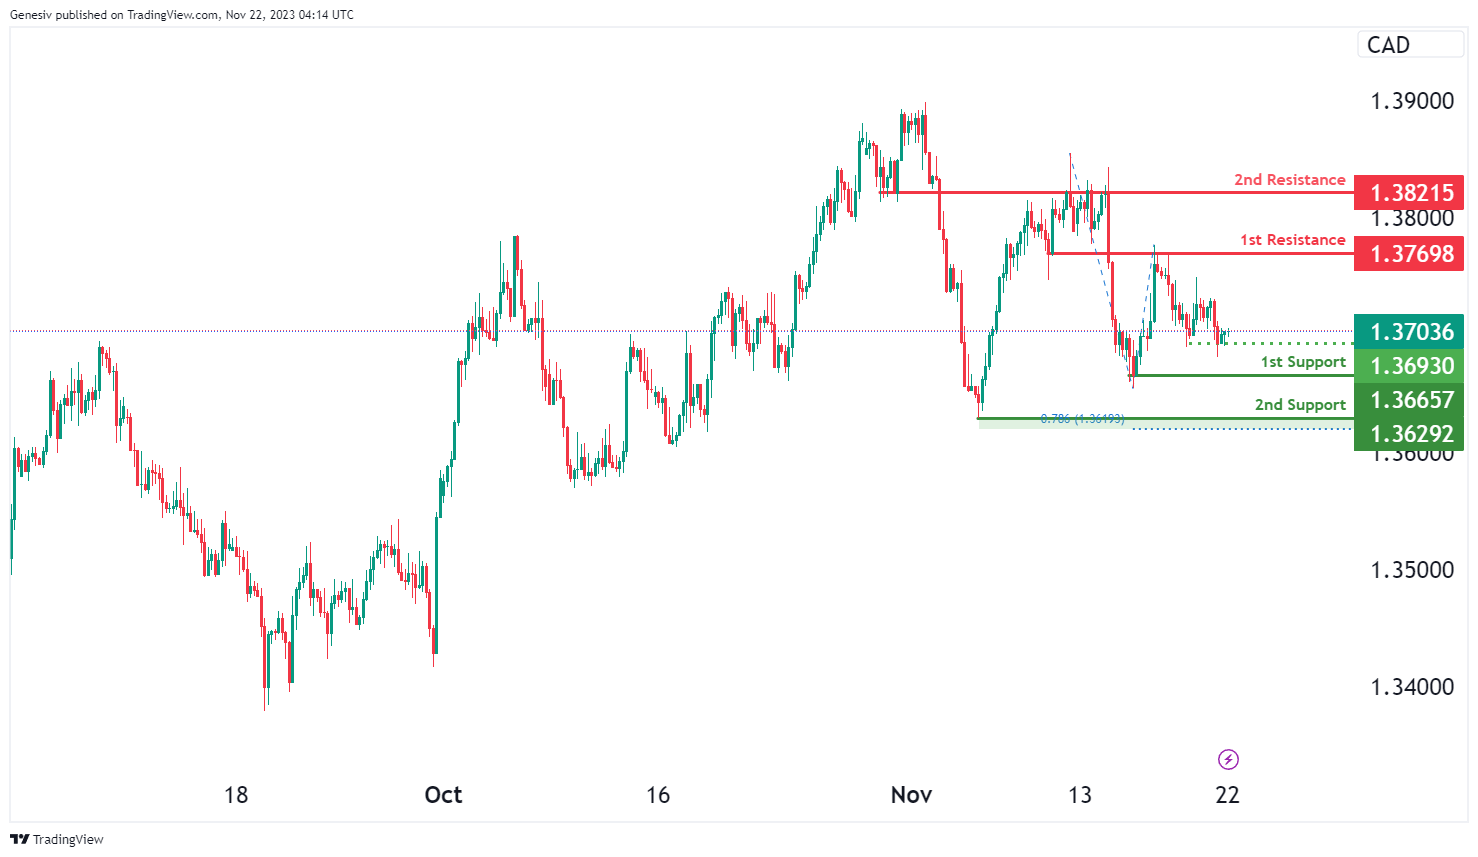
USD/CAD:
The USD/CAD chart currently exhibits an overall bearish momentum, indicating the potential for a bearish continuation towards the 1st support should price break below the intermediate support.
The intermediate support level at 1.3693 is identified as a multi-swing low support while the 1st support level at 1.3666 is also considered as a swing low support. Further below, the 2nd support level at 1.3629 is identified as a swing-low support that aligns with the 78.60% Fibonacci projection level, further reinforcing the potential for price to find support in this region.
On the resistance side, the 1st resistance level at 1.3769 is categorized as an overlap resistance. Higher up, the 2nd resistance level at 1.3822 is also noted as an overlap resistance, potentially acting as a barrier to further upward movement.
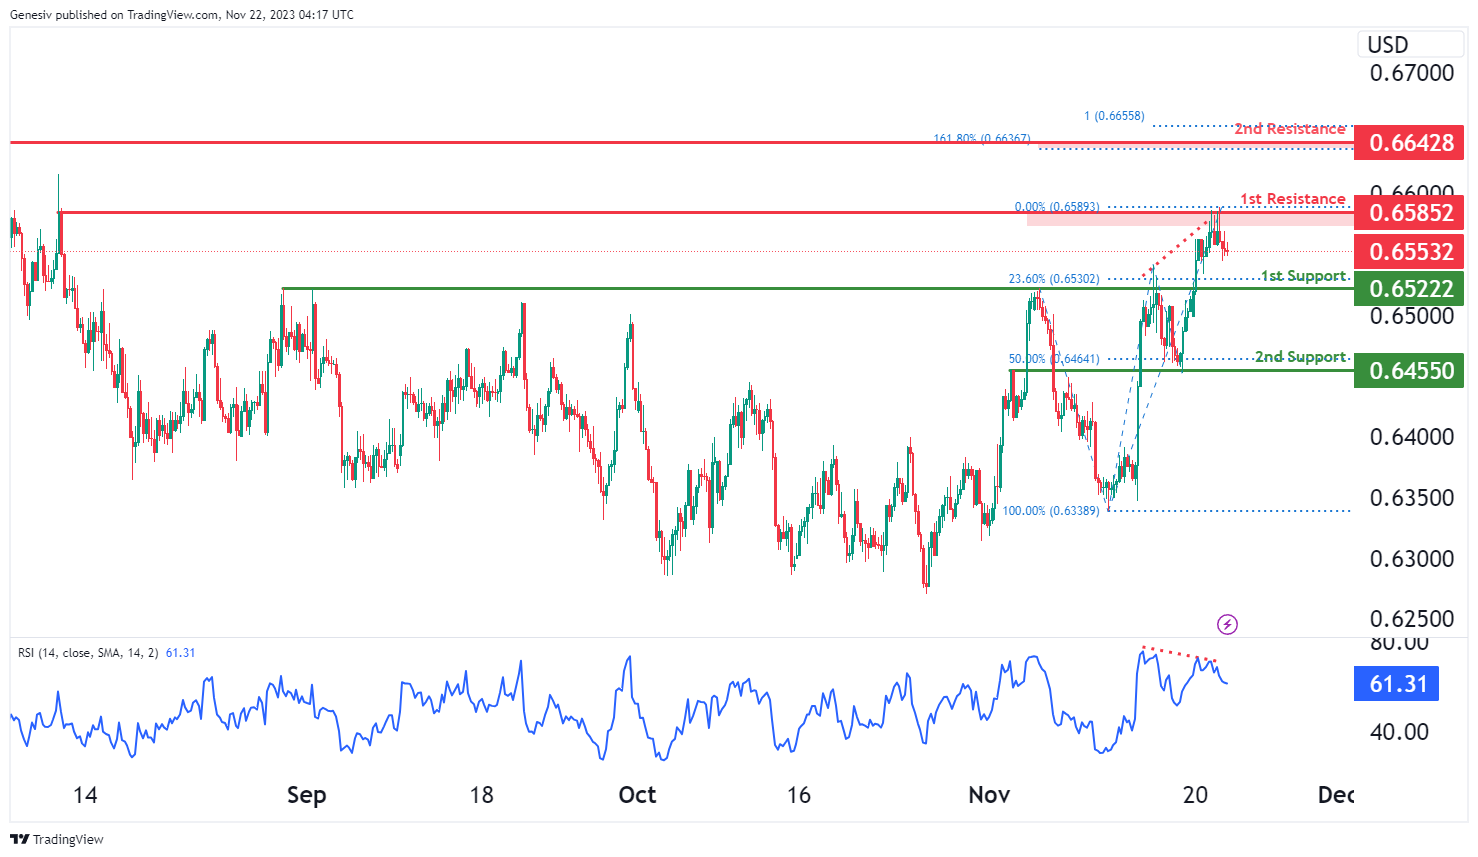
AUD/USD:
The analyzed instrument is AUD/USD, and the overall momentum of the chart is currently bearish.
There is a potential for the price to undergo a bearish continuation towards the 1st support.
The 1st support level is identified at 0.6522, and its favorable characteristic is attributed to being a pullback support, coinciding with the 23.60% Fibonacci Retracement level.
The 2nd support level is situated at 0.6455, and its favorable aspects are twofold—it is an overlap support and aligns with the 50% Fibonacci Retracement level.
On the resistance side, the 1st resistance is positioned at 0.6585, and it is considered significant due to being a multi-swing high resistance.
The 2nd resistance is located at 0.6642, and its significance is derived from being a pullback resistance, coinciding with the 161.80% Fibonacci Extension and the 100% Fibonacci Projection, indicating Fibonacci confluence.
Additionally, the Relative Strength Index (RSI) is displaying bearish divergence versus the price, suggesting that a reversal might occur soon.
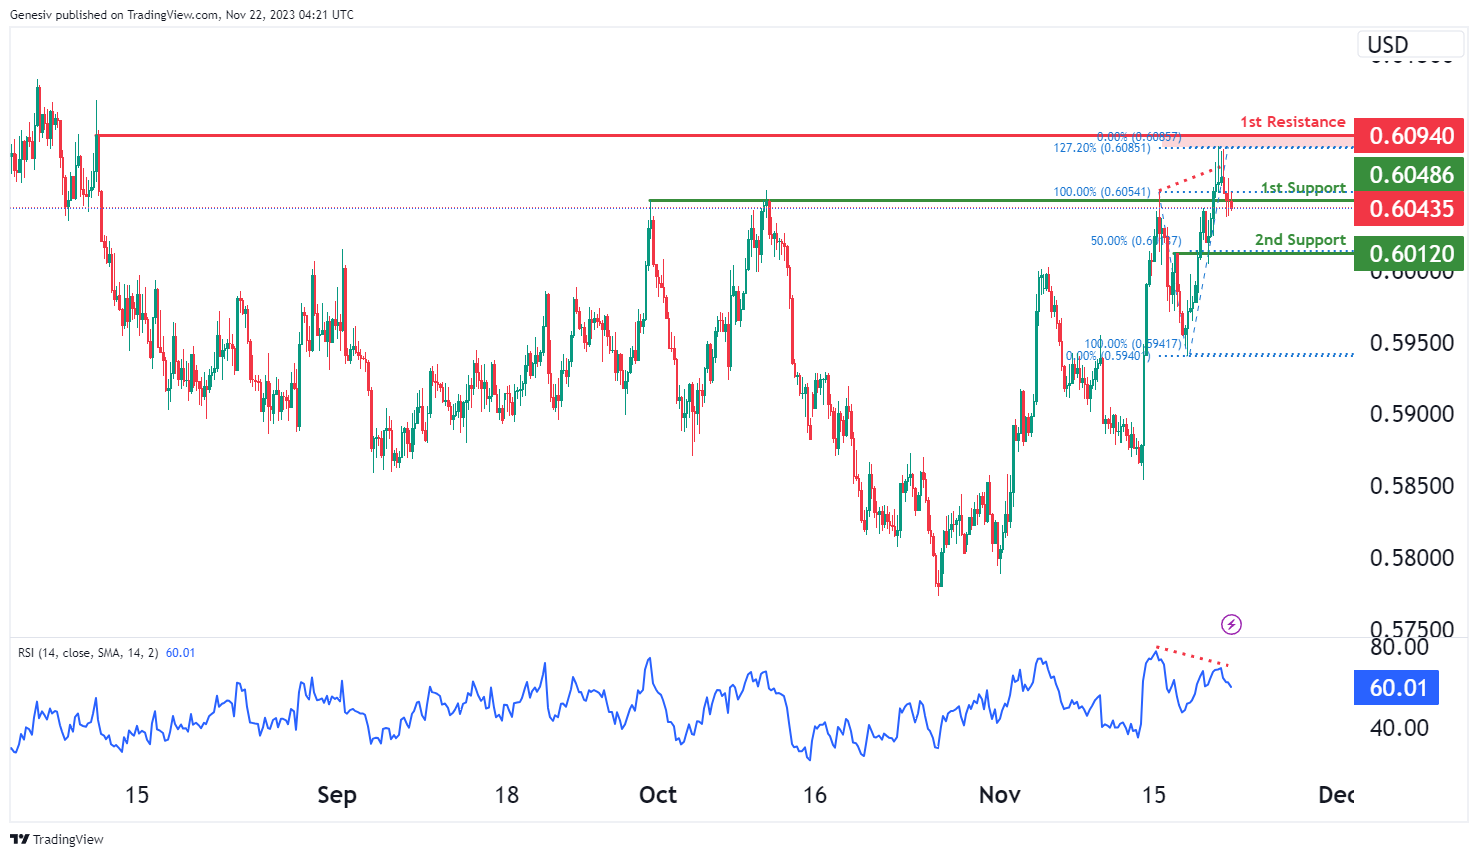
NZD/USD
The analyzed instrument is NZD/USD, and the overall momentum of the chart is currently bearish.
There is a potential for the price to undergo a bearish break off the 1st support and subsequently drop towards the 2nd support.
The 1st support level is identified at 0.6048, and its favorable characteristic is attributed to being a pullback support.
The 2nd support level is situated at 0.6012, and its favorable aspects are twofold—it is an overlap support and aligns with the 50% Fibonacci Retracement level.
On the resistance side, the 1st resistance is positioned at 0.6094, and it is considered significant due to being a swing high resistance and coinciding with the 127.20% Fibonacci Extension.
Additionally, the Relative Strength Index (RSI) is displaying bearish divergence versus the price, suggesting that a reversal might occur soon.
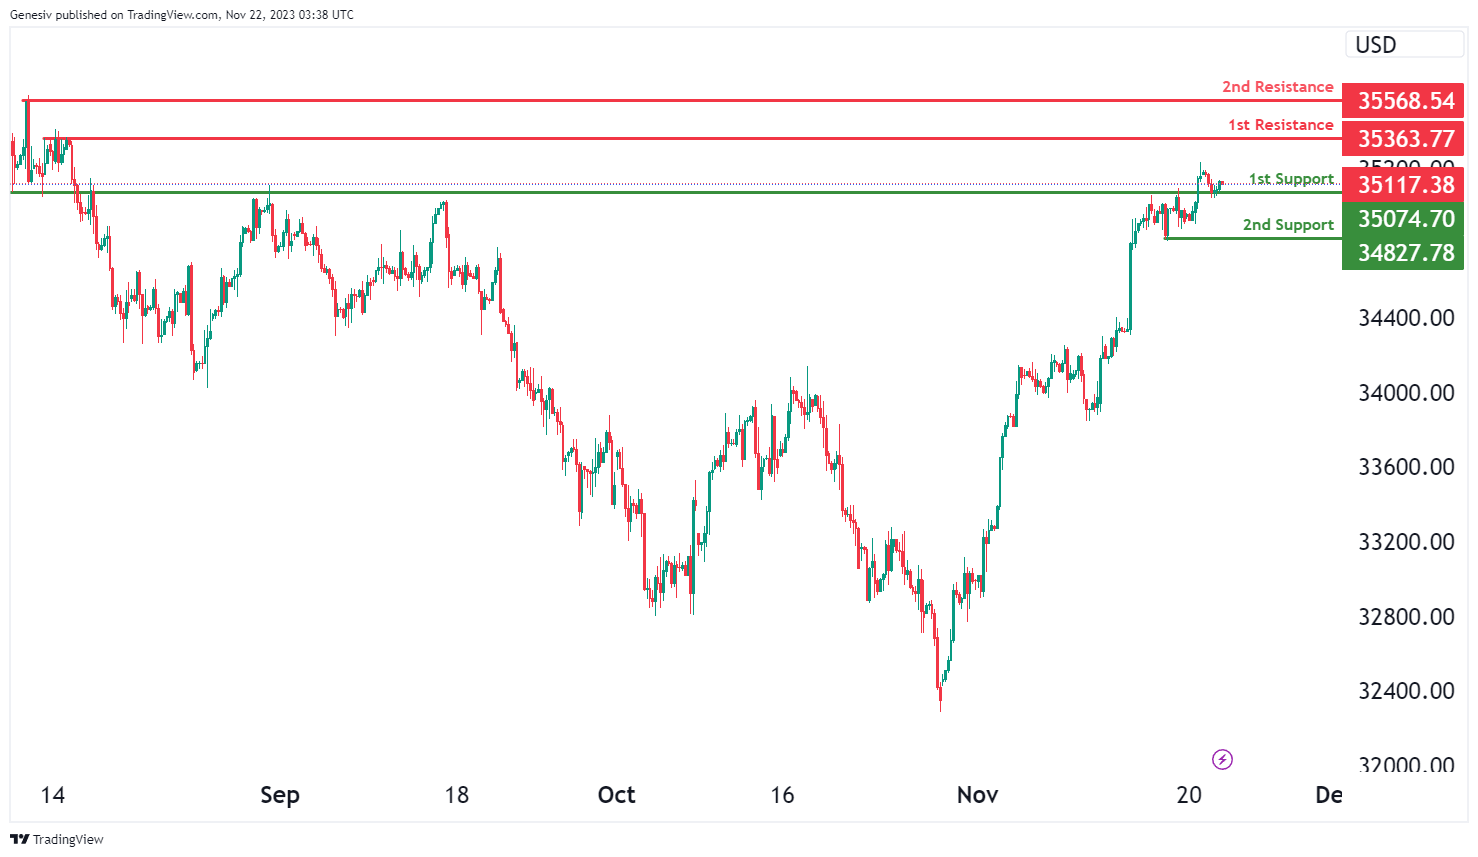
DJ30:
The DJ30 chart currently indicates a bullish momentum, suggesting a potential bullish bounce off the first support at 35074.70 towards the first resistance at 35363.77.
The first support at 35074.70 is identified as a pullback support, indicating a level where the price might find buying interest. Additionally, the second support at 34827.78 is recognized as a swing low support, reinforcing the potential strength of the support zone.
On the resistance side, the first resistance at 35363.77 is significant due to its multi-swing high resistance, marking a crucial level where the price might face selling pressure or potential reversals within its upward movement. Furthermore, the second resistance at 35568.54 is identified as a swing high resistance, emphasizing its importance as a potential hurdle for the price and a point where it might encounter obstacles in its bullish continuation.
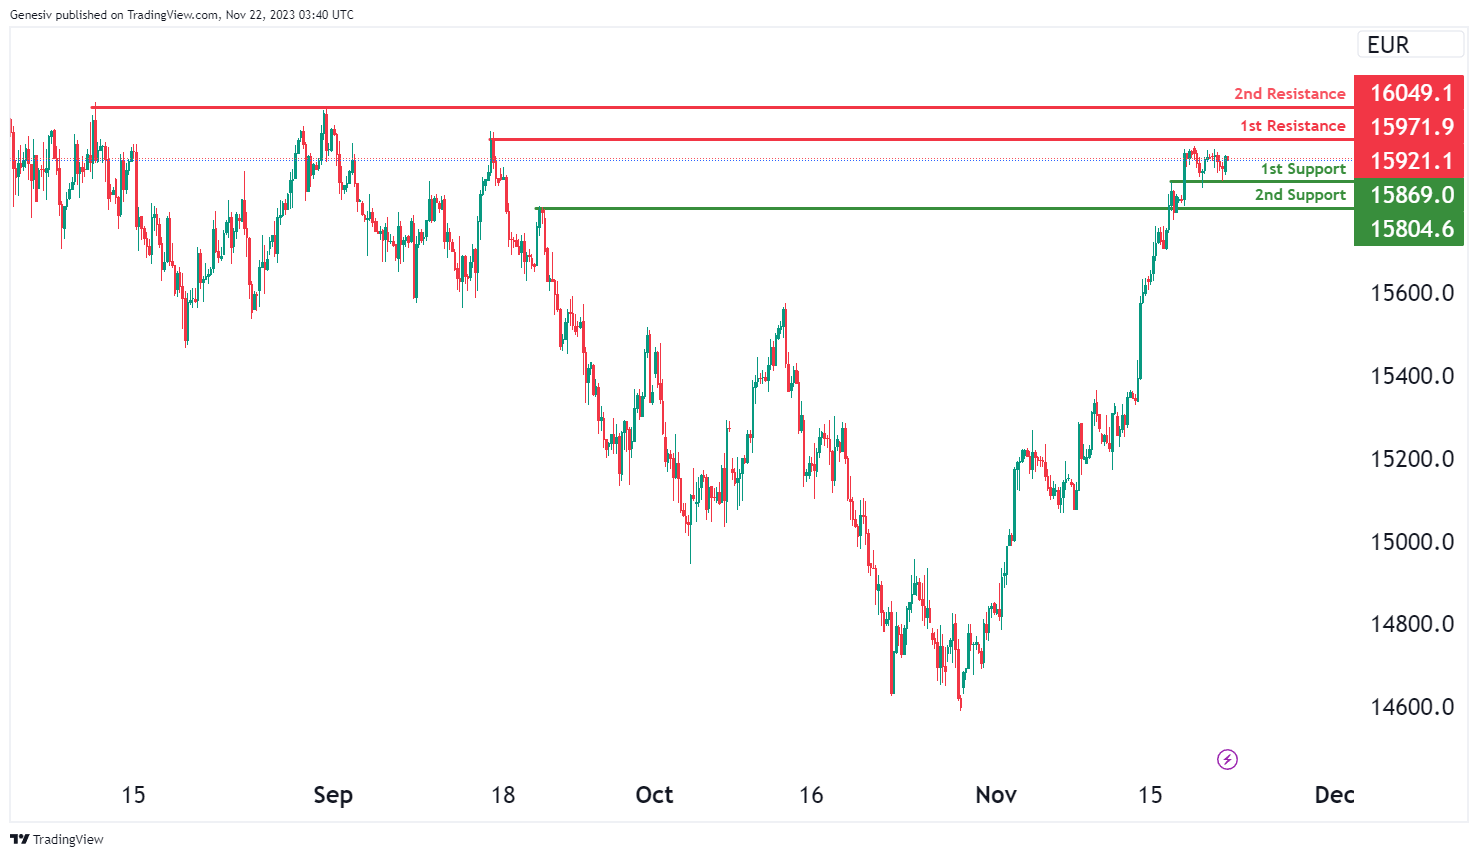
GER40:
The GER40 chart currently indicates a bullish momentum, suggesting a potential bullish continuation towards the first resistance at 15971.9.
The first support at 15869.0 is identified as an overlap support, indicating a level where the price might find buying interest. Additionally, the second support at 15804.6 is recognized as another overlap support, reinforcing the potential strength of the support zone.
On the resistance side, the first resistance at 15971.9 is significant due to its swing high resistance, marking a crucial level where the price might face selling pressure or potential reversals within its upward movement. Furthermore, the second resistance at 16049.1 is identified as a multi-swing high resistance, emphasizing its importance as a potential hurdle for the price and a point where it might encounter obstacles in its bullish continuation.
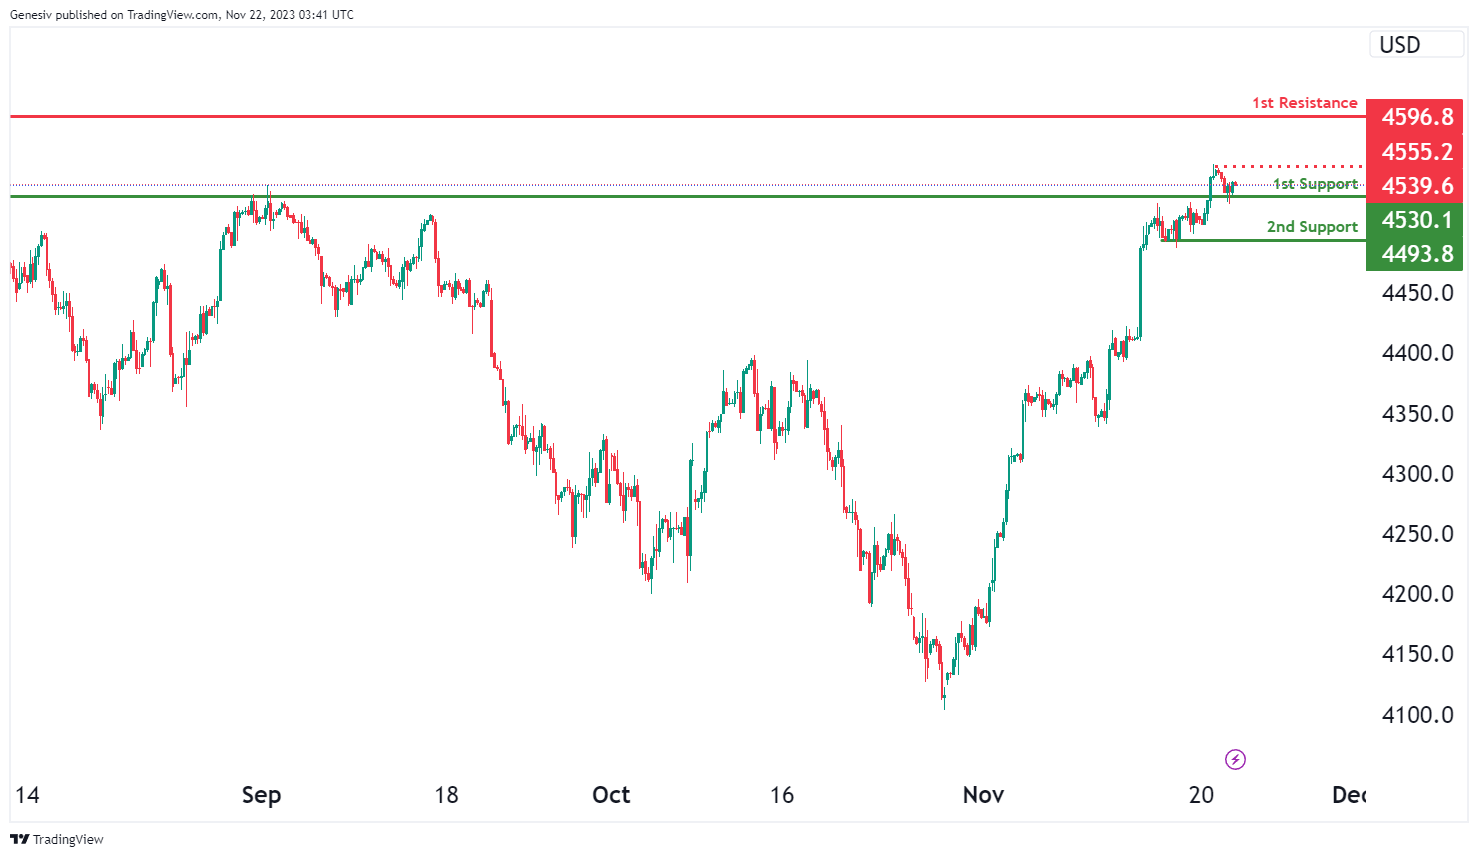
US500
The US500 chart currently indicates a bullish momentum, suggesting a potential bullish bounce off the first support at 4530.1 towards the first resistance at 4596.8.
The first support at 4530.1 is identified as an overlap support, indicating a level where the price might find buying interest. Additionally, the second support at 4493.8 is recognized as a multi-swing low support, reinforcing the potential strength of the support zone.
On the resistance side, the first resistance at 4596.8 is significant due to its swing high resistance, marking a crucial level where the price might face selling pressure or potential reversals within its upward movement. Furthermore, the intermediate resistance at 4555.2 is identified as a swing high resistance, emphasizing its importance as a potential hurdle for the price and a point where it might encounter obstacles in its bullish continuation.
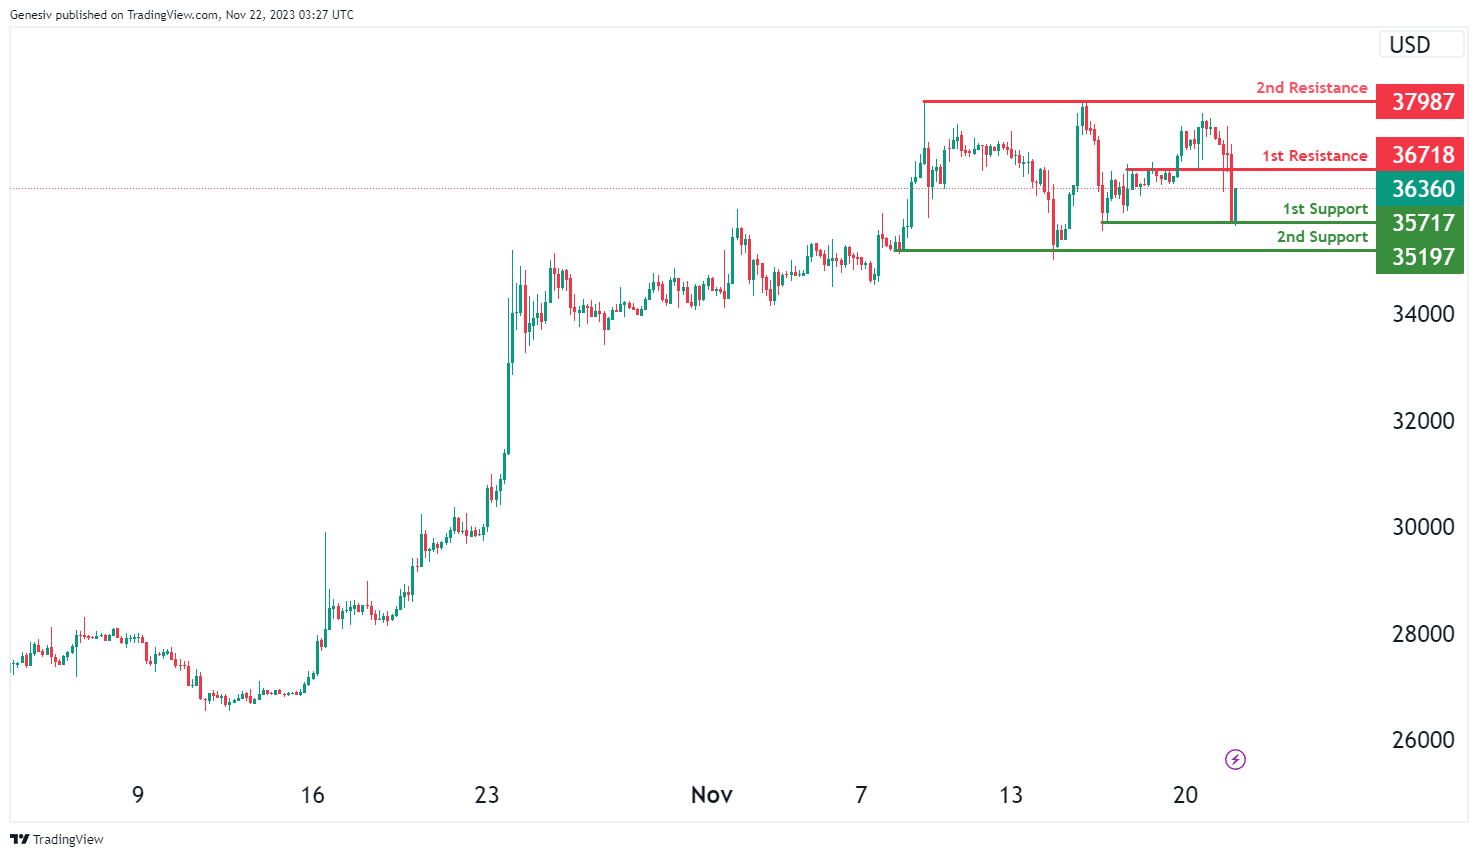
BTC/USD:
The BTC/USD chart currently indicates a bullish momentum, suggesting a potential bullish continuation towards the first resistance at 36718.
The first support at 35717 is identified as a multi-swing low support, indicating a level where the price might find buying interest. Additionally, the second support at 35197 is recognized as another multi-swing low support, reinforcing the potential strength of the support zone.
On the resistance side, the first resistance at 36718 is significant due to its pullback resistance, marking a crucial level where the price might face selling pressure or potential reversals within its upward movement. Furthermore, the second resistance at 37987 is identified as a multi-swing high resistance, emphasizing its importance as a potential hurdle for the price and a point where it might encounter obstacles in its bullish continuation.
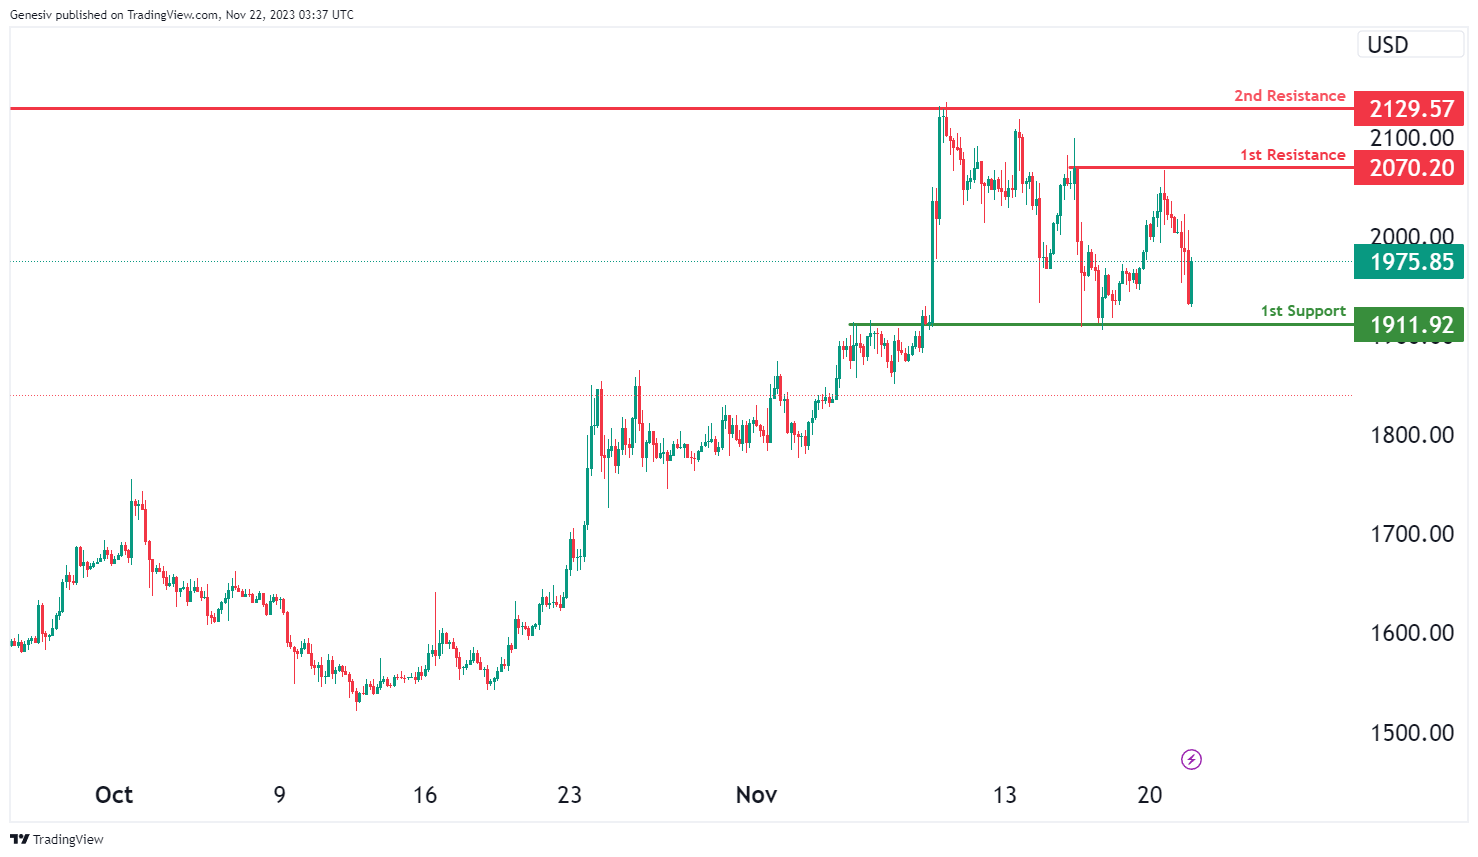
ETH/USD:
The ETH/USD chart currently indicates a bullish momentum, suggesting a potential bullish continuation towards the first resistance at 2070.20.
The first support at 1911.92 is identified as an overlap support, indicating a level where the price might find buying interest. Additionally, the second support at 1859.43 is recognized as another overlap support, reinforcing the potential strength of the support zone.
On the resistance side, the first resistance at 2070.20 is significant due to its multi-swing high resistance, marking a crucial level where the price might face selling pressure or potential reversals within its upward movement. Furthermore, the second resistance at 2129.57 is identified as another multi-swing high resistance, emphasizing its importance as a potential hurdle for the price and a point where it might encounter obstacles in its bullish continuation.
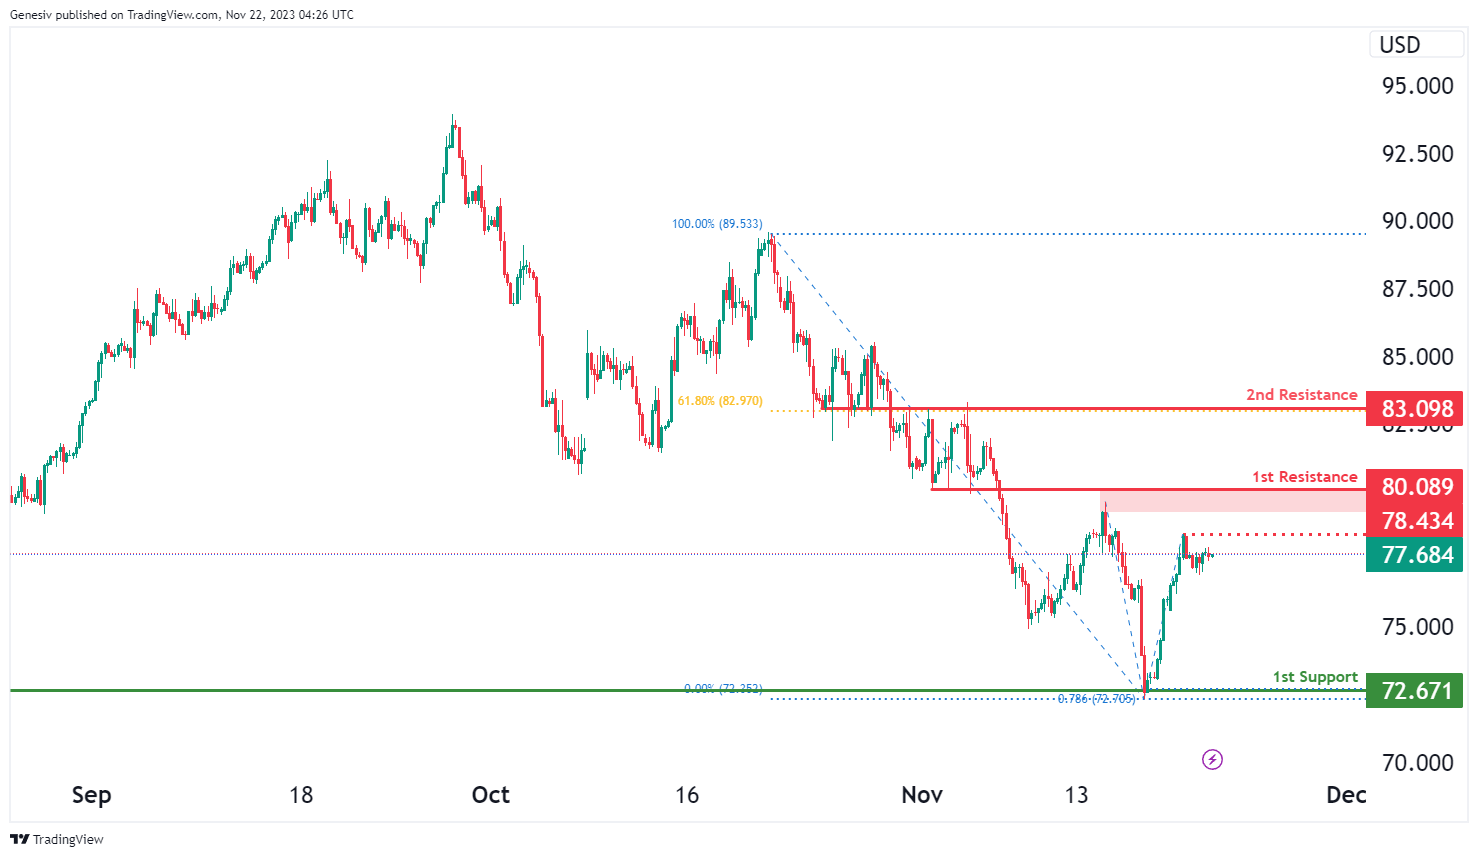
WTI/USD:
The analyzed instrument is WTI, and the overall momentum of the chart is currently bearish.
There is a potential for the price to undergo a bearish continuation towards the 1st support.
The 1st support level is identified at 72.67, and its favorable characteristics include being an overlap support and coinciding with the 78.60% Fibonacci Projection.
On the resistance side, the 1st resistance is positioned at 80.08, and it is considered significant due to being a pullback resistance.
The 2nd resistance is located at 83.09, and its significance is attributed to being an overlap resistance and aligning with the 61.80% Fibonacci Retracement.
An intermediate resistance is also noted at 78.43, and its significance is derived from being a swing high resistance.
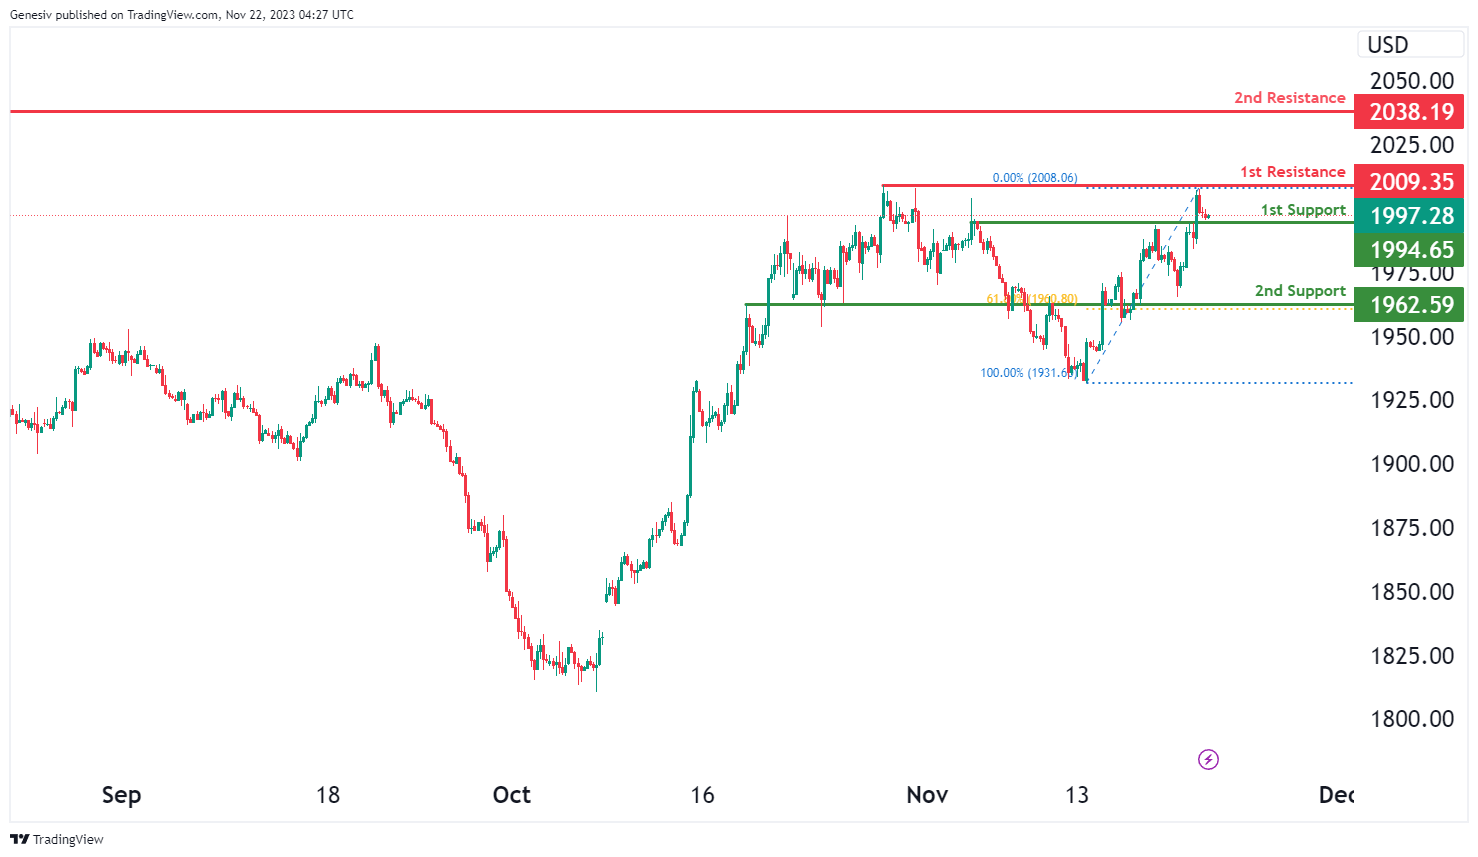
XAU/USD (GOLD):
The analyzed instrument is XAU/USD, and the overall momentum of the chart is currently bullish.
There is a potential for the price to make a bullish bounce off the 1st support and head towards the 1st resistance.
The 1st support level is identified at 1994.65, and its favorable characteristic is attributed to being a pullback support.
The 2nd support level is situated at 1962.59, and its favorable aspect is twofold—it is a pullback support and coincides with the 61.80% Fibonacci Retracement level.
On the resistance side, the 1st resistance is positioned at 2009.35, and it is considered significant due to being a multi-swing high resistance.
The 2nd resistance is located at 2038.19, and its significance is derived from being a swing high resistance.
Oil (CL) Short Term Impulsive Structure Suggests Further Upside
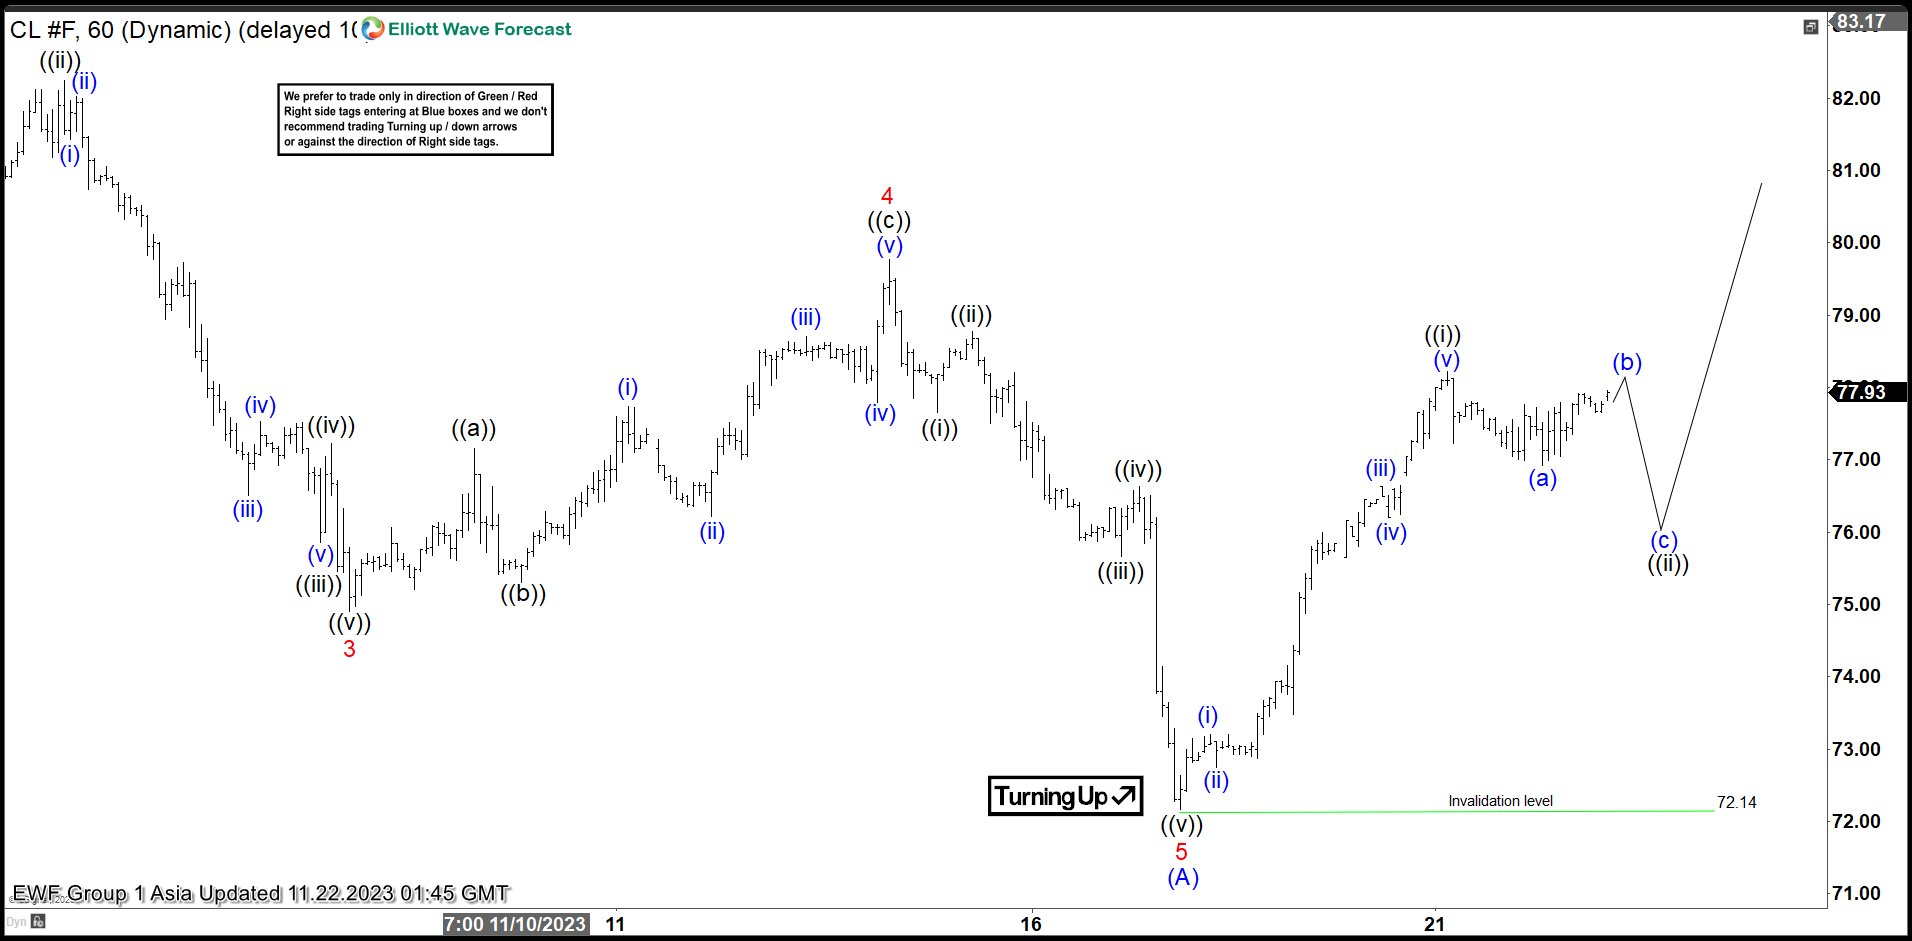
Oil (CL) ended cycle from 9.28.2023 high as a 5 waves impulse. Down from 9.28.2023 peak, wave 1 ended at 81.5 and rally in wave 2 ended at 90.78. The instrument then extended lower in wave 3 towards 74.91. The 1 hour chart below shows the move down ending wave 3. Then it corrected in wave 4 which ended at 79.77. Oil then resumed lower in wave 5 towards 72.16 and this completed wave (A) in higher degree.
Wave (B) rally is presently in progress as a zigzag Elliott Wave structure ABC. Up from wave (A), wave (i) ended at 73.21 and pullback in wave (ii) ended at 72.75. Oil extended higher in wave (iii) towards 76.63 and dips in wave (iv) ended at 76.20. Final leg wave (v) ended at 78.22 which completed wave ((i)). Pullback in wave ((ii)) is currently in progress to correct rally from 11.17.2023 low before it resumes higher. Down from wave ((i)), wave (a) ended at 76.92. While below wave ((i)) at 78.22, expect Oil to turn lower again in wave (c) of ((ii)) before it resumes higher. Near term, as far as 11.17.2023 pivot at 72.14 holds, expect pullback to find support in 3, 7, or 11 swing for further upside.
Oil (CL) 60 Minutes Elliott Wave Chart
Oil (CL) Elliott Wave Video
https://www.youtube.com/watch?v=dTpCiciXcSk
GBP/USD Rallies Above 1.2500, Gold Resumes Increase
Key Highlights
- GBP/USD rallied above the 1.2420 and 1.2500 levels.
- It broke a key declining channel with resistance near 1.2425 on the 4-hour chart.
- Gold prices started a fresh increase above the $1,990 resistance.
- USD/JPY extended losses and traded below the 148.50 support.
GBP/USD Technical Analysis
The British Pound started a strong increase above the 1.2350 level against the US dollar. GBP/USD broke the 1.2420 barrier to move into a positive zone.
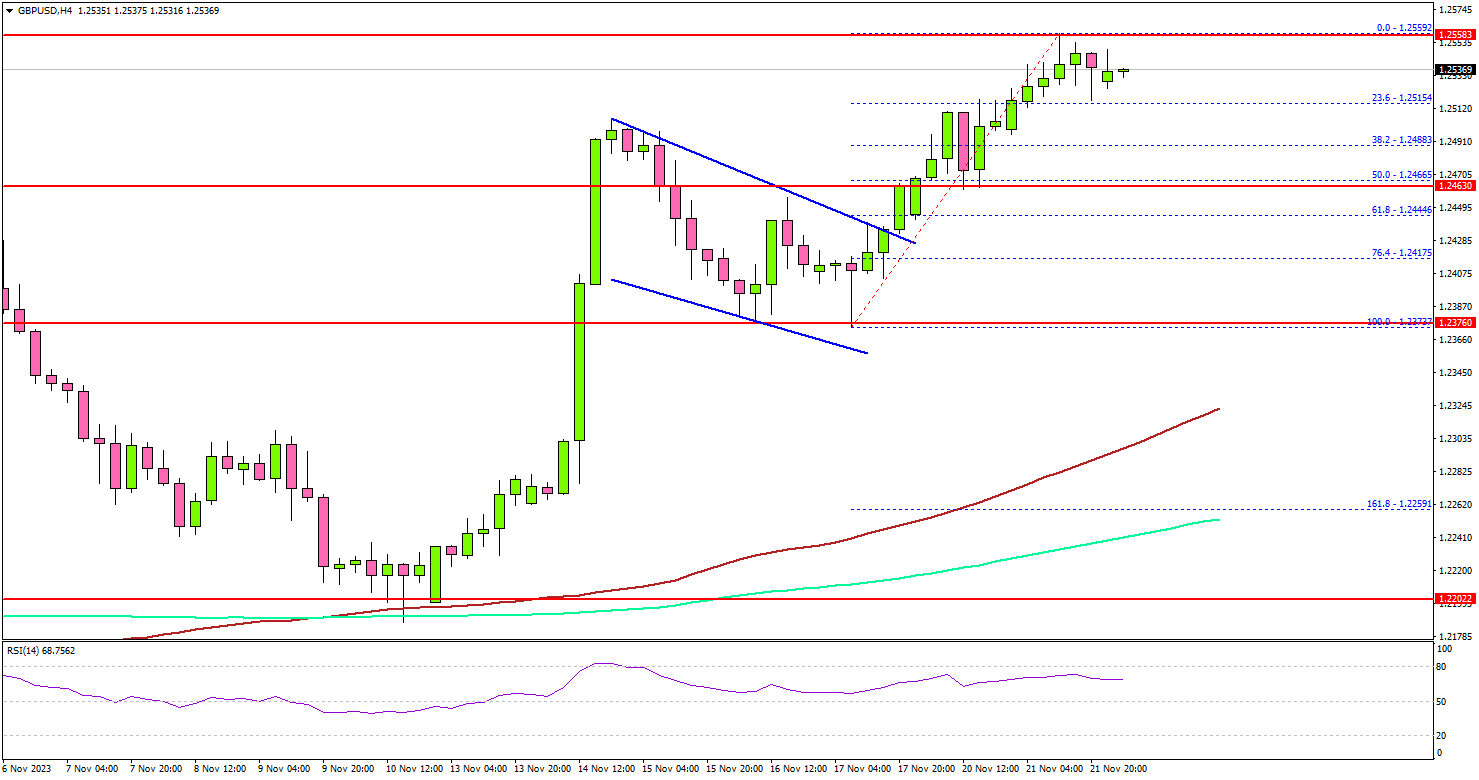
Looking at the 4-hour chart, the pair even settled above the 1.2450 level, the 100 simple moving average (red, 4 hours), and the 200 simple moving average (green, 4 hours). It also broke a key declining channel with resistance near 1.2425.
Finally, there was a move above the 1.2500 resistance. The pair tested the 1.2550 resistance and started a consolidation. On the upside, the pair is facing resistance near the 1.2565 level.
The next key resistance is near the 1.2580 level. The main resistance is now near the 1.2620 level. A close above the 1.2620 zone could open the doors for more upsides. The next stop for the bulls might be 1.2700.
If not, the pair might start a downside correction below the 1.2500 support. The first major support is now forming near the 1.2465 level. The next key support sits at 1.2440, below which the pair could test the 1.2350 pivot level in the near term.
Any more losses may perhaps open the doors for a move toward the 100 simple moving average (red, 4 hours) at 1.2300.
Looking at Gold, there was a fresh increase above the $1,990 resistance and the bulls might now aim for a move above $2,000.
Economic Releases
- US Durable Goods Orders for Oct 2023 – Forecast -3.1% versus +4.6% previous.
- US Initial Jobless Claims - Forecast 225K, versus 231K previous.
Australia’s Westpac leading index fell to -0.40%, indicates prolonged low growth
Westpac Leading Index in Australia has shown a marginal decline from -0.38% to -0.40% in October, underscoring the ongoing trend of subdued economic growth. This marks the fifteenth consecutive month where the index's growth rate has been below zero, signaling that the Australian economy is likely to continue experiencing limited growth into 2024.
Despite this, the overall growth rate can still be considered moderately positive, especially when viewed against current annual population growth rate of approximately 2.4%. Both Westpac and RBA project the economy's actual growth to be within the range of 1-2% for both this and the coming year, a rate that lags behind potential trend growth.
A key concern for RBA is the adequacy of this sluggish growth in achieving inflation target of 2-3% within a reasonable timeframe. As highlighted in RBA's recent November meeting minutes, Board maintains a strict stance of "low tolerance" against any further unexpected rises in inflation or delays in returning to the target range. This stance indicates that RBA's policy meetings in the upcoming year will be crucial and "live".
Japan’s economic outlook downgraded amid domestic demand weakness
The Japanese government has revised its assessment of the nation's economy, marking the first downgrade in ten months. This change in outlook indicates pausing in part" in Japan's moderate recovery, primarily attributed to weakening domestic demand. This shift represents a departure from the previously consistent description of the economy as "recovering at a moderate pace" over the past six months.
A critical aspect of this revised assessment is the downgraded view on business investment, which has been adjusted for the first time in nearly two years. The government's monthly report cites the slowing of global growth, particularly in China, as a significant factor contributing to the "pausing" in pick-up in business investment.
Despite this downgrade, the Cabinet Office maintained its assessment of other economic components. Private consumption is described as "picking up," driven by a continued recovery in service demand. The report also highlights a positive trend in both industrial production and exports, which are showing signs of "picking up".
The government's report, however, underscores several downside risks to the Japanese economy. These include the impacts of aggressive interest rate hikes in other countries and the economic slowdown in China. Additionally, the government emphasizes the need for full attention to price increases, developments in the Middle East, and fluctuations in financial and capital markets.
Full monthly economic report of Japan's cabinet office here.
ECB’s Lagarde emphasizes vigilance in inflation battle, outlines wage dynamics and policy outlook
ECB President Christine Lagarde, in her speech overnight, cautioned against premature optimism on the ongoing fight against inflation in Eurozone, stating emphatically, "this is not the time to start declaring victory".
Lagarde highlighted the complex nature of inflation in the Eurozone, stressing the need for ongoing attentiveness to the risks of "persistent inflation". The dynamics of "wage-setting" in the region, which are often "multi-annual and staggered", play a significant role in this context.
She pointed out that "the high inflation rates that are now behind us are still having a significant influence on wage agreements today," indicating the lag effect of past inflation on current wage negotiations.
Addressing the current wage growth scenario, Lagarde opined that it primarily represents "catch-up" effects from past inflation, rather than being driven by expectations of future inflation. However, she noted the importance of monitoring wage developments to assess any potential risks to price stability. This involves closely observing how firms manage rising wages, whether there is an easing of labor market tightness, and ensuring that inflation expectations remain anchored.
Lagarde also reiterated ECB's commitment to maintaining policy rates at sufficiently restrictive levels for as long as necessary to achieve its inflation targets. She emphasized that future decisions will be data-dependent, allowing ECB the flexibility to act again if the risk of missing inflation target increases.
FOMC minutes indicate cautious approach and possible softening in hawkish stance
A key takeaway from FOMC minutes from October 31-November 1 meeting is the consensus on proceeding with caution, as indicated by the unanimous agreement that "the Committee was in a position to proceed carefully."
The minutes also emphasized Fed's readiness to implement further tightening measures if the progress toward its inflation target is deemed insufficient. This stance is aligned with Fed's ongoing commitment to combatting inflation, as reflected in the sentiment that "further tightening of monetary policy would be appropriate if incoming information indicated that progress toward the Committee's inflation objective was insufficient."
The committee members were also unanimous in their view that restrictive policy stance should be maintained until inflation shows a sustainable decline towards Fed's target. This highlights Fed's focus on ensuring that inflationary pressures are adequately managed before considering any policy easing.
However, a notable shift in the committee's outlook was observed in the latest minutes. The previous stance, which suggested that "one more increase in the target federal funds rate at a future meeting would likely be appropriate," was conspicuously absent in the latest document. This omission may signal a slight softening in the FOMC's hawkish stance, indicating a potential pivot in future policy decisions.