
Sample Category Title
GBP/USD Mid-Day Outlook
Daily Pivots: (S1) 1.2505; (P) 1.2532; (R1) 1.2565; More...
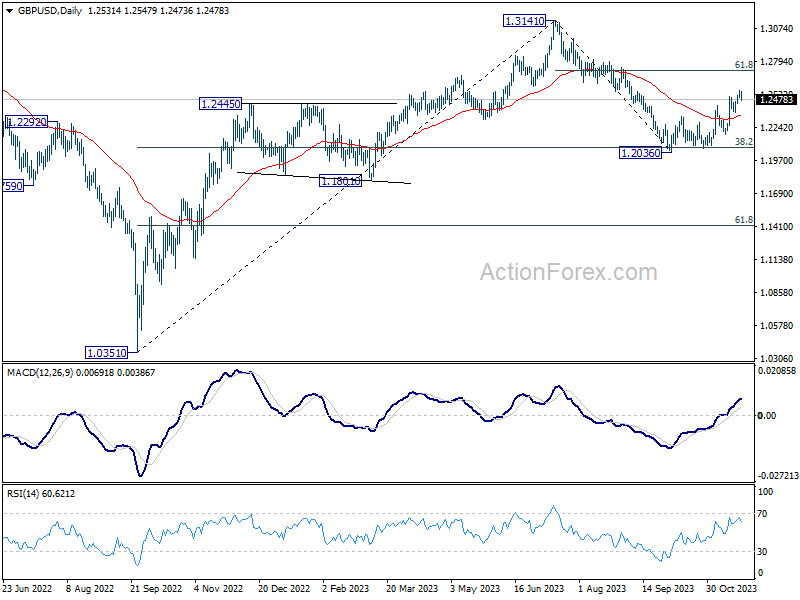
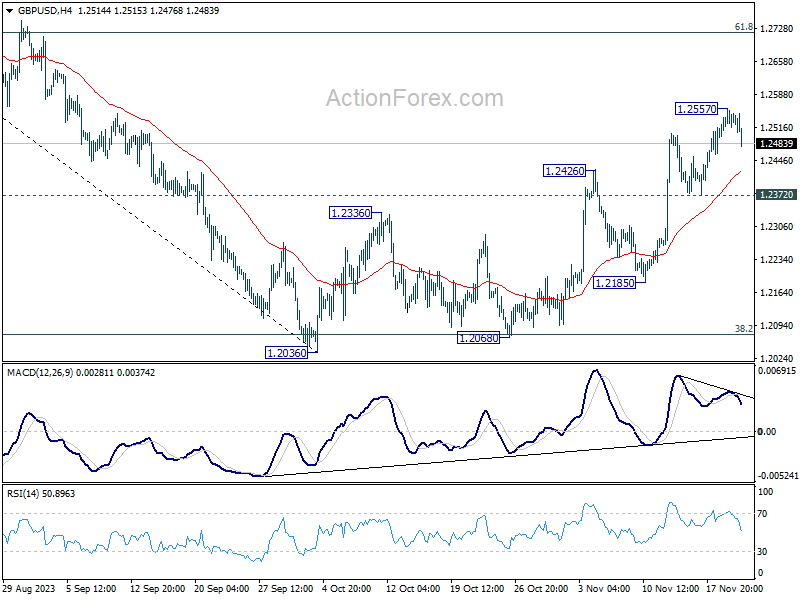
Intraday bias in GBP/USD remains neutral as consolidation continues below 1.2557. While deeper retreat might be seen, further rally is expected as long as 1.2372 support holds. Above 1.2557 will resume the rise from 1.2036, and target 61.8% retracement of 1.3141 to 1.2036 at 1.2716 next.

In the bigger picture, price actions from 1.3141 are seen as a corrective pattern to rise from 1.0351 (2022 low). Strong rebound from 38.2% retracement of 1.0351 (2022 low) to 1.3141 at 1.2075 argues that current rise from 1.2036 is the second leg. However, while further rally could be seen, upside should be limited by 1.3141 to bring the third leg of the pattern.
EUR/USD Mid-Day Outlook
Daily Pivots: (S1) 1.0885; (P) 1.0926; (R1) 1.0951; More...
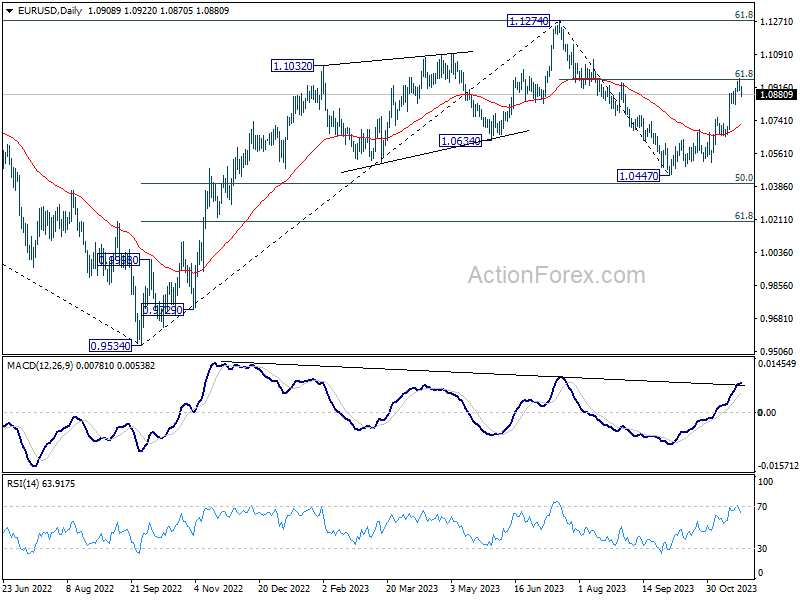
Intraday bias in EUR/USD remains neutral for consolidation below 1.0964 temporary top. While deeper retreat could be seen, downside should be contained by 1.0823 support to bring another rally. On the upside, sustained trading above 1.0958 will pave the way to retest 1.1274 high. However, firm break of 1.0823 will indicate short term topping, and turn bias back to the downside for deeper decline.
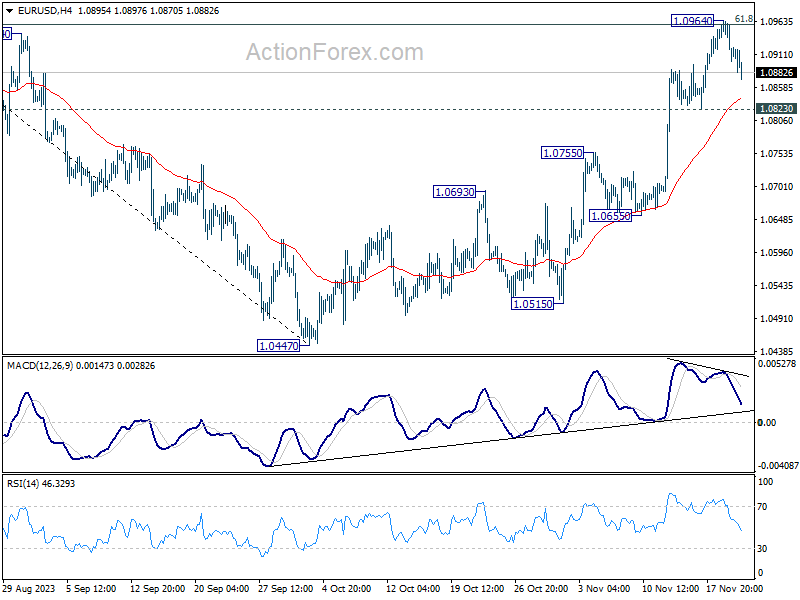
In the bigger picture, price actions from 1.1274 are viewed as a corrective pattern to rise from 0.9534 (2022 low). Rise from 1.0447 is tentatively seen as the second leg. Hence while further rally could be seen, upside should be limited by 1.1274 to bring the third leg of the pattern.
Dollar Extending Recovery as Consolidation Starts, Risks Still Tilted to the Downside
Dollar is extending its near term recovery in the early US session. The latest jobless claims data came in better than expected, offering some support to the greenback. However, this was somewhat offset by weaker-than-anticipated durable goods orders. Overall, the current upswing in may not be entirely rooted in these economic releases.
The recovery appears more likely attributed to traders taking profits on short positions ahead of Thanksgiving holiday, a period typically marked by reduced trading activity. This context suggests that the greenback's recovery could be part of a broader consolidation phase, with a more definitive trend likely to emerge only after the release of crucial economic data next week, including PCE inflation and ISM Manufacturing figures.
In the wider currency market, Australian Dollar is trailing Dollar as the second strongest performer of the day, followed by Swiss Franc. In contrast, Japanese Yen is reversing its recent gains and currently stands as the day's weakest currency. Similarly, New Zealand Dollar is positioned as the second weakest, and Canadian Dollar follows as the third. Euro and Sterling are exhibiting mixed performance.
Technically, certain key levels in various Dollar pairs merit close attention for short-term movements. These levels include 1.0823 support in EUR/USD, 1.2372 support in GBP/USD, 0.6451 support in AUD/USD, and 0.8952 resistance in USD/CHF. As long as these levels are maintained, the risk remains tilted towards the downside for Dollar, and resurgence in selling pressure could occur at any time.
In Europe, at the time of writing, FTSE is down -0.12%. DAX is up 0.50%. CAC is up 0.45%. Germany 10-year yield is down -0.038 at 2.533. Earlier in Asia, Nikkei rose 0.29%. Hong Kong HSI closed flat. China Shanghai SSE fell -0.79%. Singapore Strait Times rose 0.60%. Japan 10-year JGB yield rose 0.0320 to 0.731.
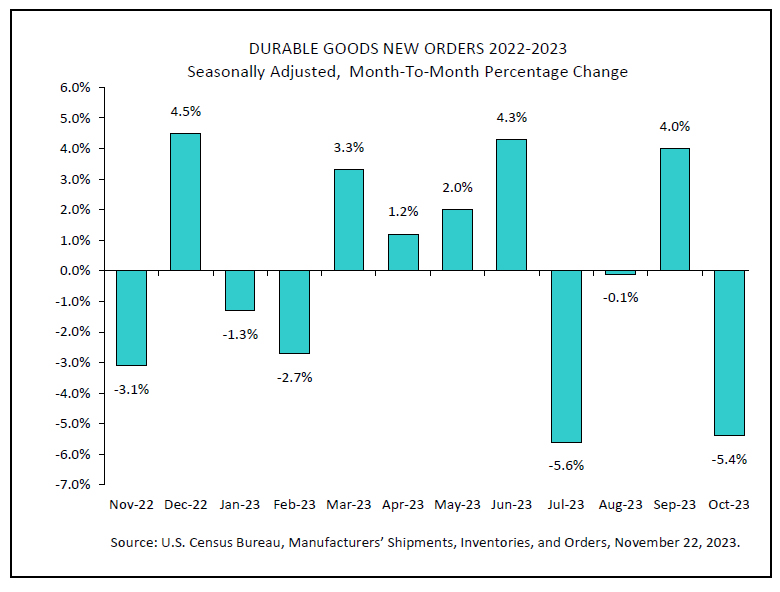
US durable goods orders down -5.4% mom, driven by transportation equipment
US durable goods orders fell -5.4% mom to USD 279.4B in October, worse than expectation of -3.2% mom. Headline orders were also down three of the last four months. Ex-transport orders was rose 0.0% mom to 187.4B. Ex-defense orders fell -6.7% mom to 261.6B. Transportation equipment also down three of the last four months, drove the decrease by -14.8% mom to USD 92.1B.
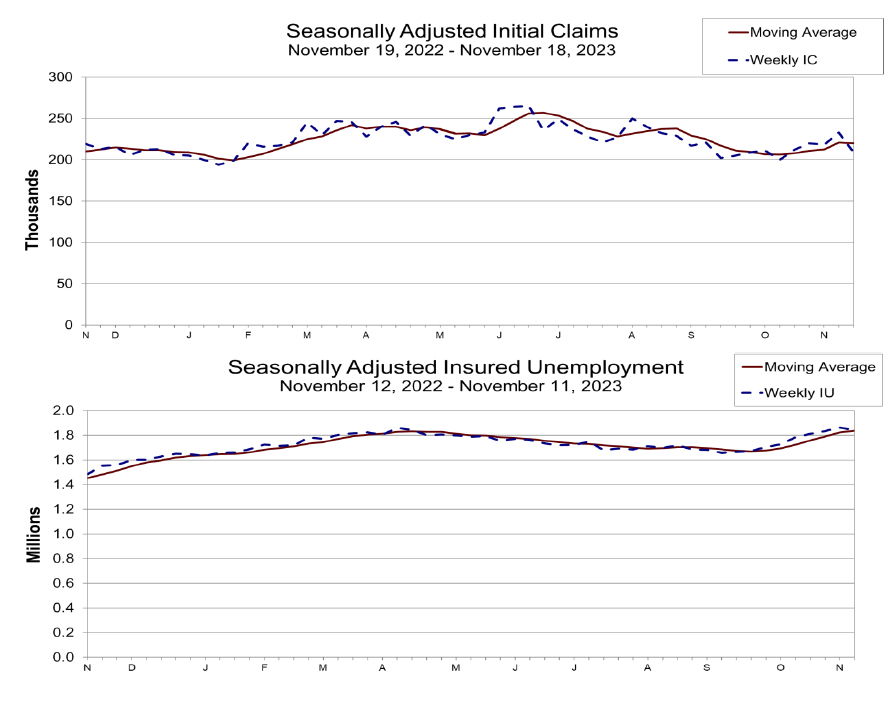
US initial jobless claims falls back to 209k, vs expectation 225k
US initial jobless claims fell -24k to 209k in the week ending November 18, better than expectation of 225k. Four-week moving average of initial claims fell -750 to 220k.
Continuing claims fell -22k to 1840 in the week ending November 11. Four-week moving average of continuing claims rose 14k to 1837k, highest since December 18, 2021.
RBA's Bullock: Inflation increasingly domestic and lengthy to control
RBA Governor Michele Bullock, in a speech, emphasized the changing nature of the inflation challenge facing Australia, noting its increasing shift towards being "homegrown and demand driven." This distinction is crucial as it significantly influences the central bank's policy response.
Bullock differentiated between inflation driven by global supply disruptions, over which monetary policy has limited influence, and inflation stemming from domestic demand exceeding the economy's potential. In the case of the latter, she argues, "a more substantial monetary policy tightening is the right response."
The Governor also highlighted three key indicators supporting the demand-driven nature of current inflation: Firstly, the broad-based nature of inflation across various sectors; secondly, the underpinning of inflation by domestic demand, particularly in services; and thirdly, the continued limited spare capacity in the economy, as evident in high rates of labor utilization.
Regarding the timeframe for bringing inflation back to the target range, Bullock suggested that while supply-side issues eased relatively quickly, reducing inflation from 8% to 5.5% within three quarters, the demand-driven component would take longer to address. She projected that it might take another two years for inflation to fall below 3%.
Australia's Westpac leading index fell to -0.40%, indicates prolonged low growth
Westpac Leading Index in Australia has shown a marginal decline from -0.38% to -0.40% in October, underscoring the ongoing trend of subdued economic growth. This marks the fifteenth consecutive month where the index's growth rate has been below zero, signaling that the Australian economy is likely to continue experiencing limited growth into 2024.
Despite this, the overall growth rate can still be considered moderately positive, especially when viewed against current annual population growth rate of approximately 2.4%. Both Westpac and RBA project the economy's actual growth to be within the range of 1-2% for both this and the coming year, a rate that lags behind potential trend growth.
A key concern for RBA is the adequacy of this sluggish growth in achieving inflation target of 2-3% within a reasonable timeframe. As highlighted in RBA's recent November meeting minutes, Board maintains a strict stance of "low tolerance" against any further unexpected rises in inflation or delays in returning to the target range. This stance indicates that RBA's policy meetings in the upcoming year will be crucial and "live".
Japan's economic outlook downgraded amid domestic demand weakness
The Japanese government has revised its assessment of the nation's economy, marking the first downgrade in ten months. This change in outlook indicates pausing in part" in Japan's moderate recovery, primarily attributed to weakening domestic demand. This shift represents a departure from the previously consistent description of the economy as "recovering at a moderate pace" over the past six months.
A critical aspect of this revised assessment is the downgraded view on business investment, which has been adjusted for the first time in nearly two years. The government's monthly report cites the slowing of global growth, particularly in China, as a significant factor contributing to the "pausing" in pick-up in business investment.
Despite this downgrade, the Cabinet Office maintained its assessment of other economic components. Private consumption is described as "picking up," driven by a continued recovery in service demand. The report also highlights a positive trend in both industrial production and exports, which are showing signs of "picking up".
The government's report, however, underscores several downside risks to the Japanese economy. These include the impacts of aggressive interest rate hikes in other countries and the economic slowdown in China. Additionally, the government emphasizes the need for full attention to price increases, developments in the Middle East, and fluctuations in financial and capital markets.
EUR/USD Mid-Day Outlook
Daily Pivots: (S1) 1.0885; (P) 1.0926; (R1) 1.0951; More...
Intraday bias in EUR/USD remains neutral for consolidation below 1.0964 temporary top. While deeper retreat could be seen, downside should be contained by 1.0823 support to bring another rally. On the upside, sustained trading above 1.0958 will pave the way to retest 1.1274 high. However, firm break of 1.0823 will indicate short term topping, and turn bias back to the downside for deeper decline.
In the bigger picture, price actions from 1.1274 are viewed as a corrective pattern to rise from 0.9534 (2022 low). Rise from 1.0447 is tentatively seen as the second leg. Hence while further rally could be seen, upside should be limited by 1.1274 to bring the third leg of the pattern.
Economic Indicators Update
| GMT | Ccy | Events | Actual | Forecast | Previous | Revised |
|---|---|---|---|---|---|---|
| 00:00 | AUD | Westpac Leading Index M/M Oct | 0.00% | 0.10% | ||
| 13:30 | USD | Initial Jobless Claims (Nov 17) | 209K | 225K | 231K | 233K |
| 13:30 | USD | Durable Goods Orders Oct | -5.40% | -3.20% | 4.60% | |
| 13:30 | USD | Durable Goods Orders ex-Transport Oct | 0.00% | 0.20% | 0.40% | |
| 15:00 | USD | Michigan Consumer Sentiment Index Nov F | 61.1 | 60.4 | ||
| 15:00 | EUR | Eurozone Consumer Confidence Nov P | -18 | -18 | ||
| 15:30 | USD | Crude Oil Inventories | 0.9M | 3.6M | ||
| 17:00 | USD | Natural Gas Storage | 1B | 60B |
US durable goods orders down -5.4% mom, driven by transportation equipment
US durable goods orders fell -5.4% mom to USD 279.4B in October, worse than expectation of -3.2% mom. Headline orders were also down three of the last four months. Ex-transport orders was rose 0.0% mom to 187.4B. Ex-defense orders fell -6.7% mom to 261.6B. Transportation equipment also down three of the last four months, drove the decrease by -14.8% mom to USD 92.1B.
US initial jobless claims falls back to 209k, vs expectation 225k
US initial jobless claims fell -24k to 209k in the week ending November 18, better than expectation of 225k. Four-week moving average of initial claims fell -750 to 220k.
Continuing claims fell -22k to 1840 in the week ending November 11. Four-week moving average of continuing claims rose 14k to 1837k, highest since December 18, 2021.
EURJPY Elliott Wave : Buying The Dips At The Blue Box Area
Hello fellow traders. In this technical article we’re going to take a quick look at the Elliott Wave charts of EURJPY published in members area of the website. As our members know, the pair is showing impulsive bullish sequences that are calling for further strength. Our team recommended members to avoid selling , while keep favoring the long side. Recently we got correction that reached our buying zone. The pair found buyers and made reaction from the blue box as expected. In the further text we are going to explain the Elliott Wave Forecast and trading strategy.
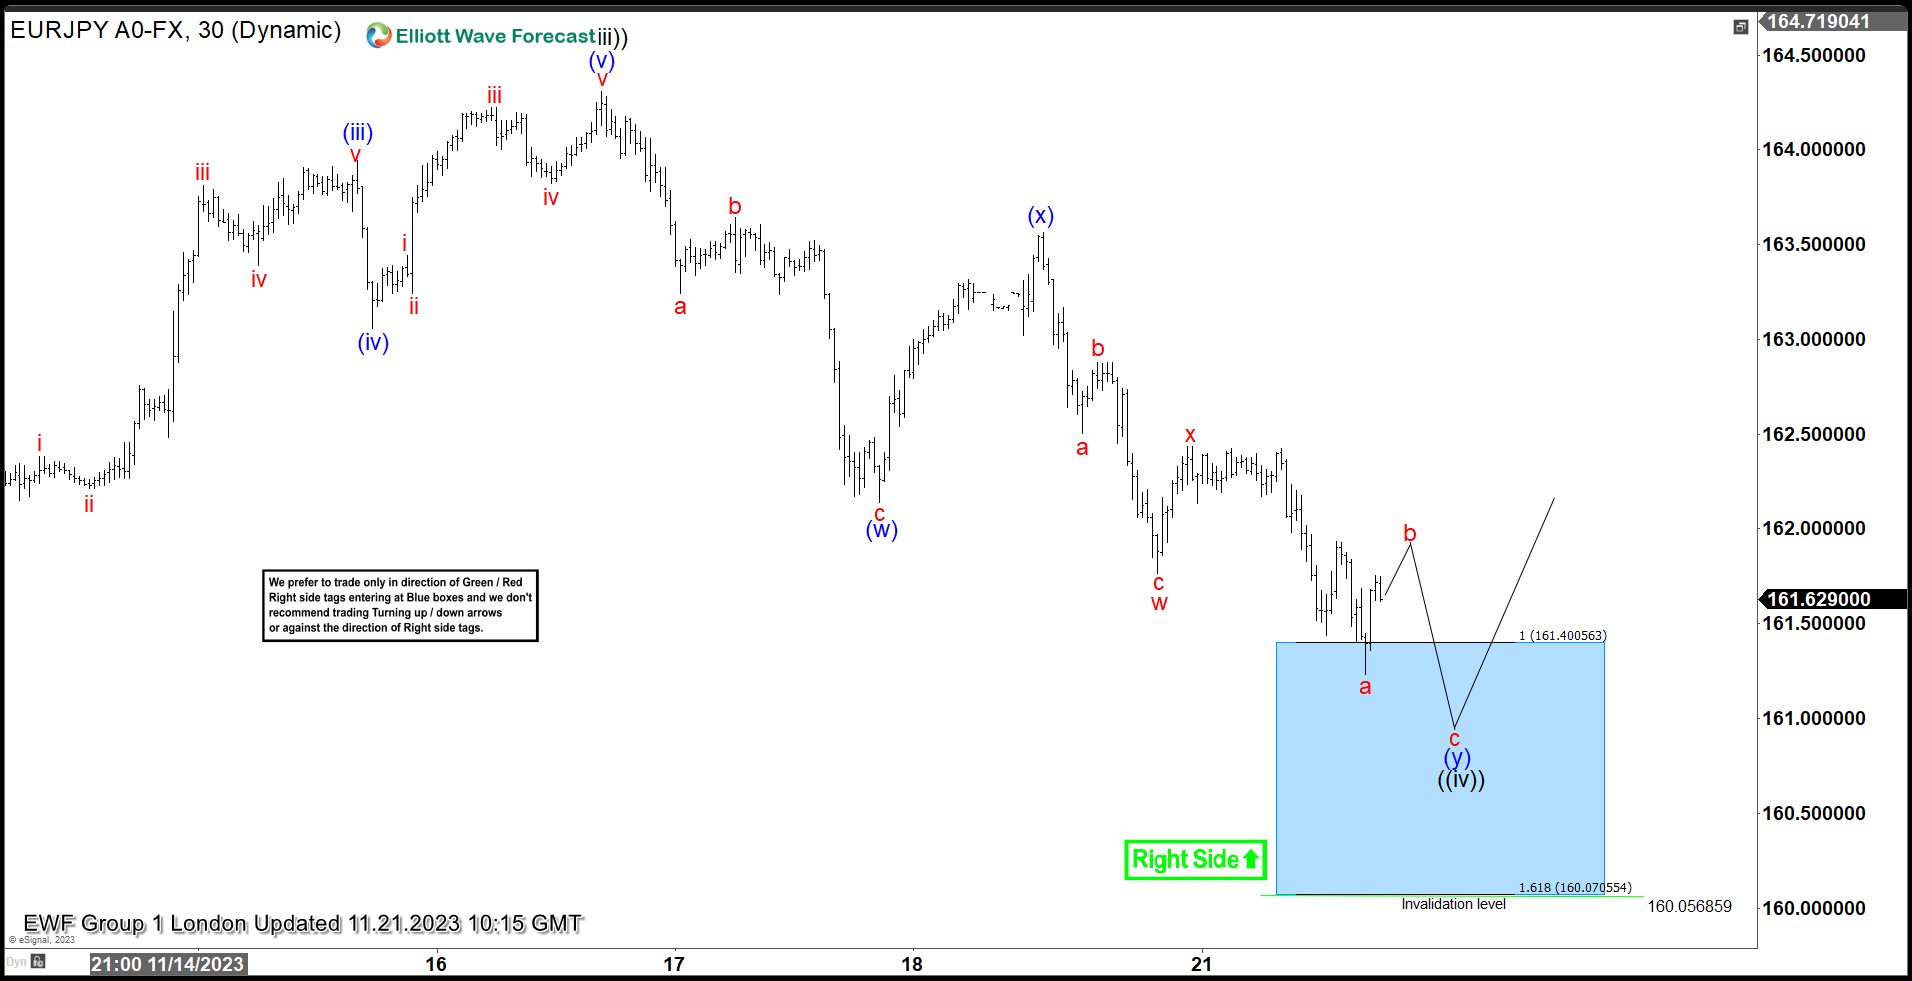
EURJPY Elliott Wave 1 Hour Chart 11.21.2023
The pair is giving us wave (iv)) pull back that is unfolding as Double Three pattern. The price has reached extreme zone at 161.4-160.07 ( Blue Box – Buyers Zone). We don’t recommend selling the pair and prefer the long side from the blue box- equal legs zone. As the main trend is bullish , we expect to see at least 3 waves bounce from our buying zone. Once bounce reaches 50 Fibs against the (x) blue high , we will make long position risk free ( put SL at BE) and take partial profits. Invalidation for the long trades is break of 1.618 fib ext : 160.07
Quick reminder:
Our charts are easy to trade and understand:
Red bearish stamp+ blue box = Selling Setup
Green bullish stamp+ blue box = Buying Setup
Charts with Black stamps are not tradable. 🚫
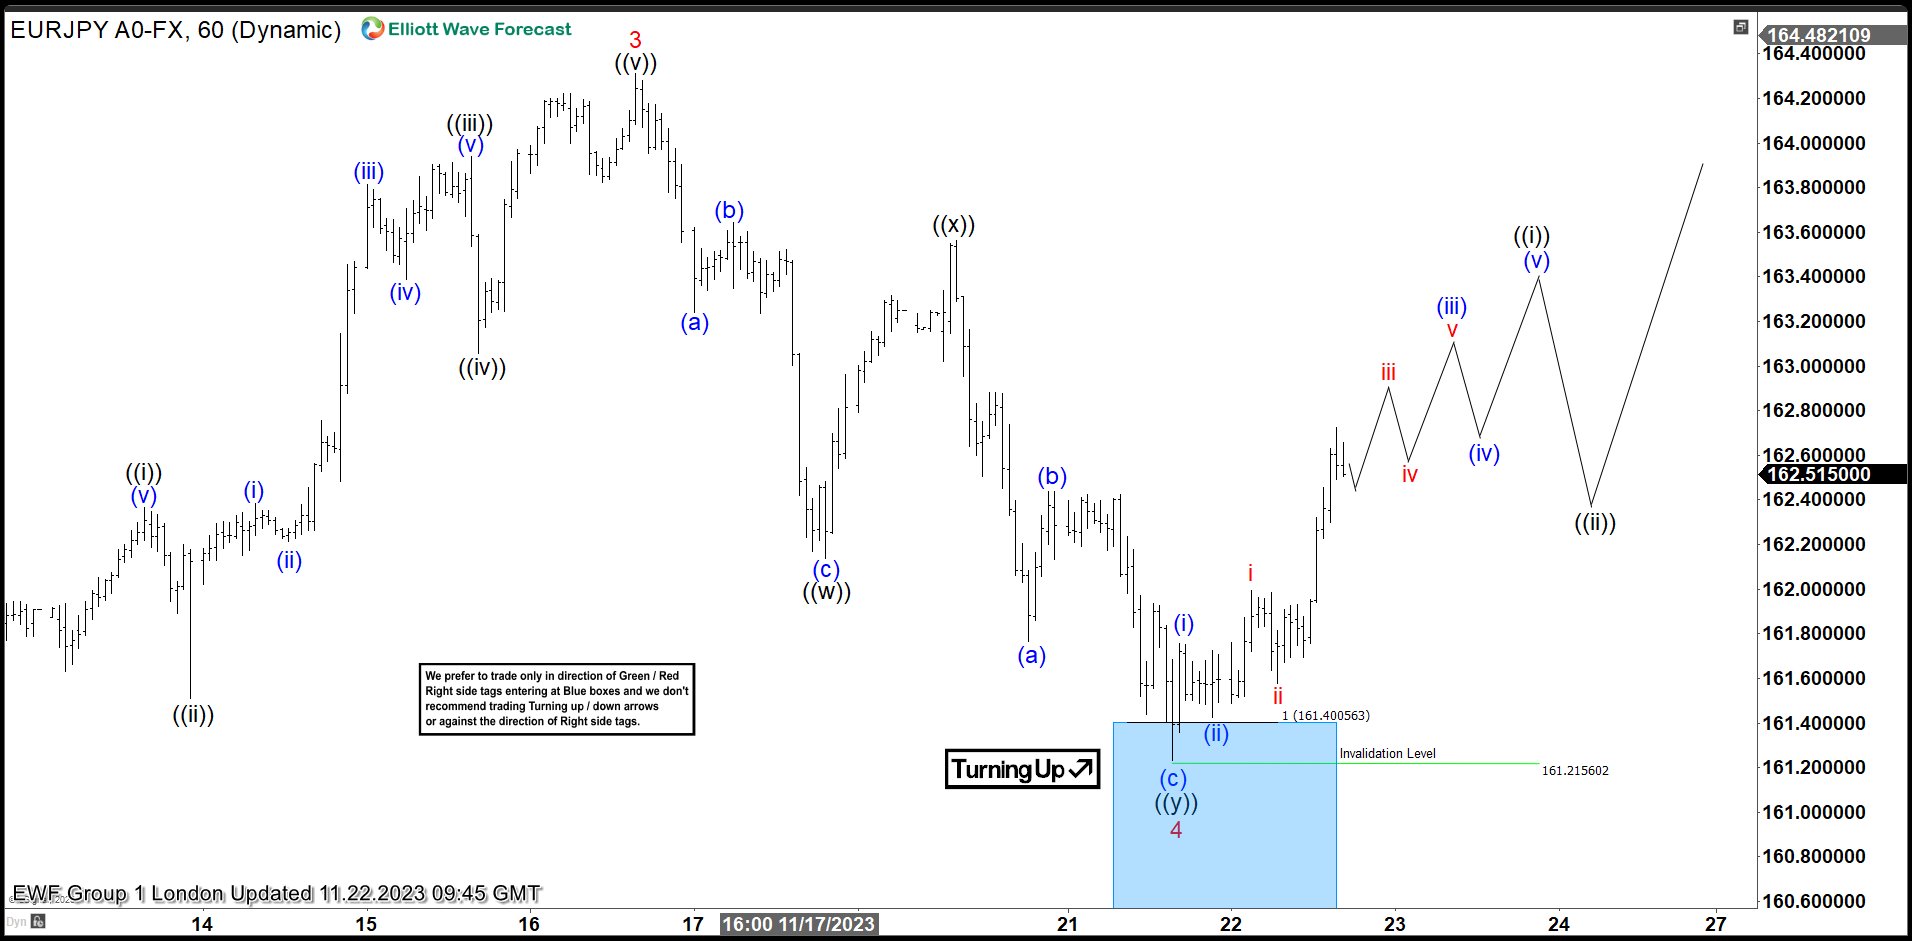
EURJPY Elliott Wave 1 Hour Chart 11.22.2023
The pair found buyers right at the Blue Box area : 161.4-160.07. Pull back completed at the 161.21 low and we are getting good reaction from the buying zone. Bounce reached and exceeded 50 fibs against the connector’s high. So members who took the long trade are enjoying profits now in a risk free positions. While above 161.21 low, next leg up could be in progress toward new highs.
AUD/USD: Consolidation Likely to Precede Fresh Push Higher
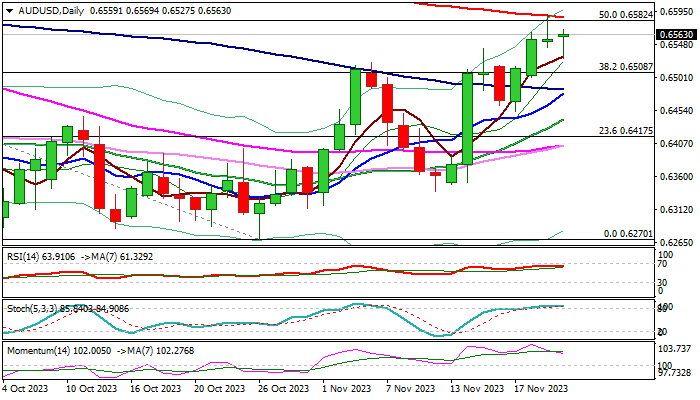
AUDUSD is holding within a near-term sideways mode after larger rally stalled at strong resistance zone at 0.6582/87 (50% of 0.6894/0.6270 / 200DMA) but subsequent weakness was short-lived as Aussie dollar received fresh support from hawkish RBA chief’s comments.
Long upper shadow on Tuesday’s daily candle and long tail on Wednesday’s signal indecision and signal that bulls may take a breather before resuming.
Fundamentals work in favor of Aussie dollar as RBA keeps hawkish stance on monetary policy while Fed shifted to more cautious approach, with growing signals that the central bank is likely done with raising interest rates.
Overall bullish daily studies are weighed by overbought conditions and fading positive momentum which contributes to signals of consolidation.
Dips should hold above broken Fibo 38.2% barrier (0.6508) to offer better buying opportunities for fresh push through 0.6582/87 pivots and acceleration towards 0.6656 (Fibo 61.8% of 0.6894/0.6270).
Res: 0.6582; 0.6616; 0.6656; 0.6700.
Sup: 0.6527; 0.6508; 0.6484; 0.6450.
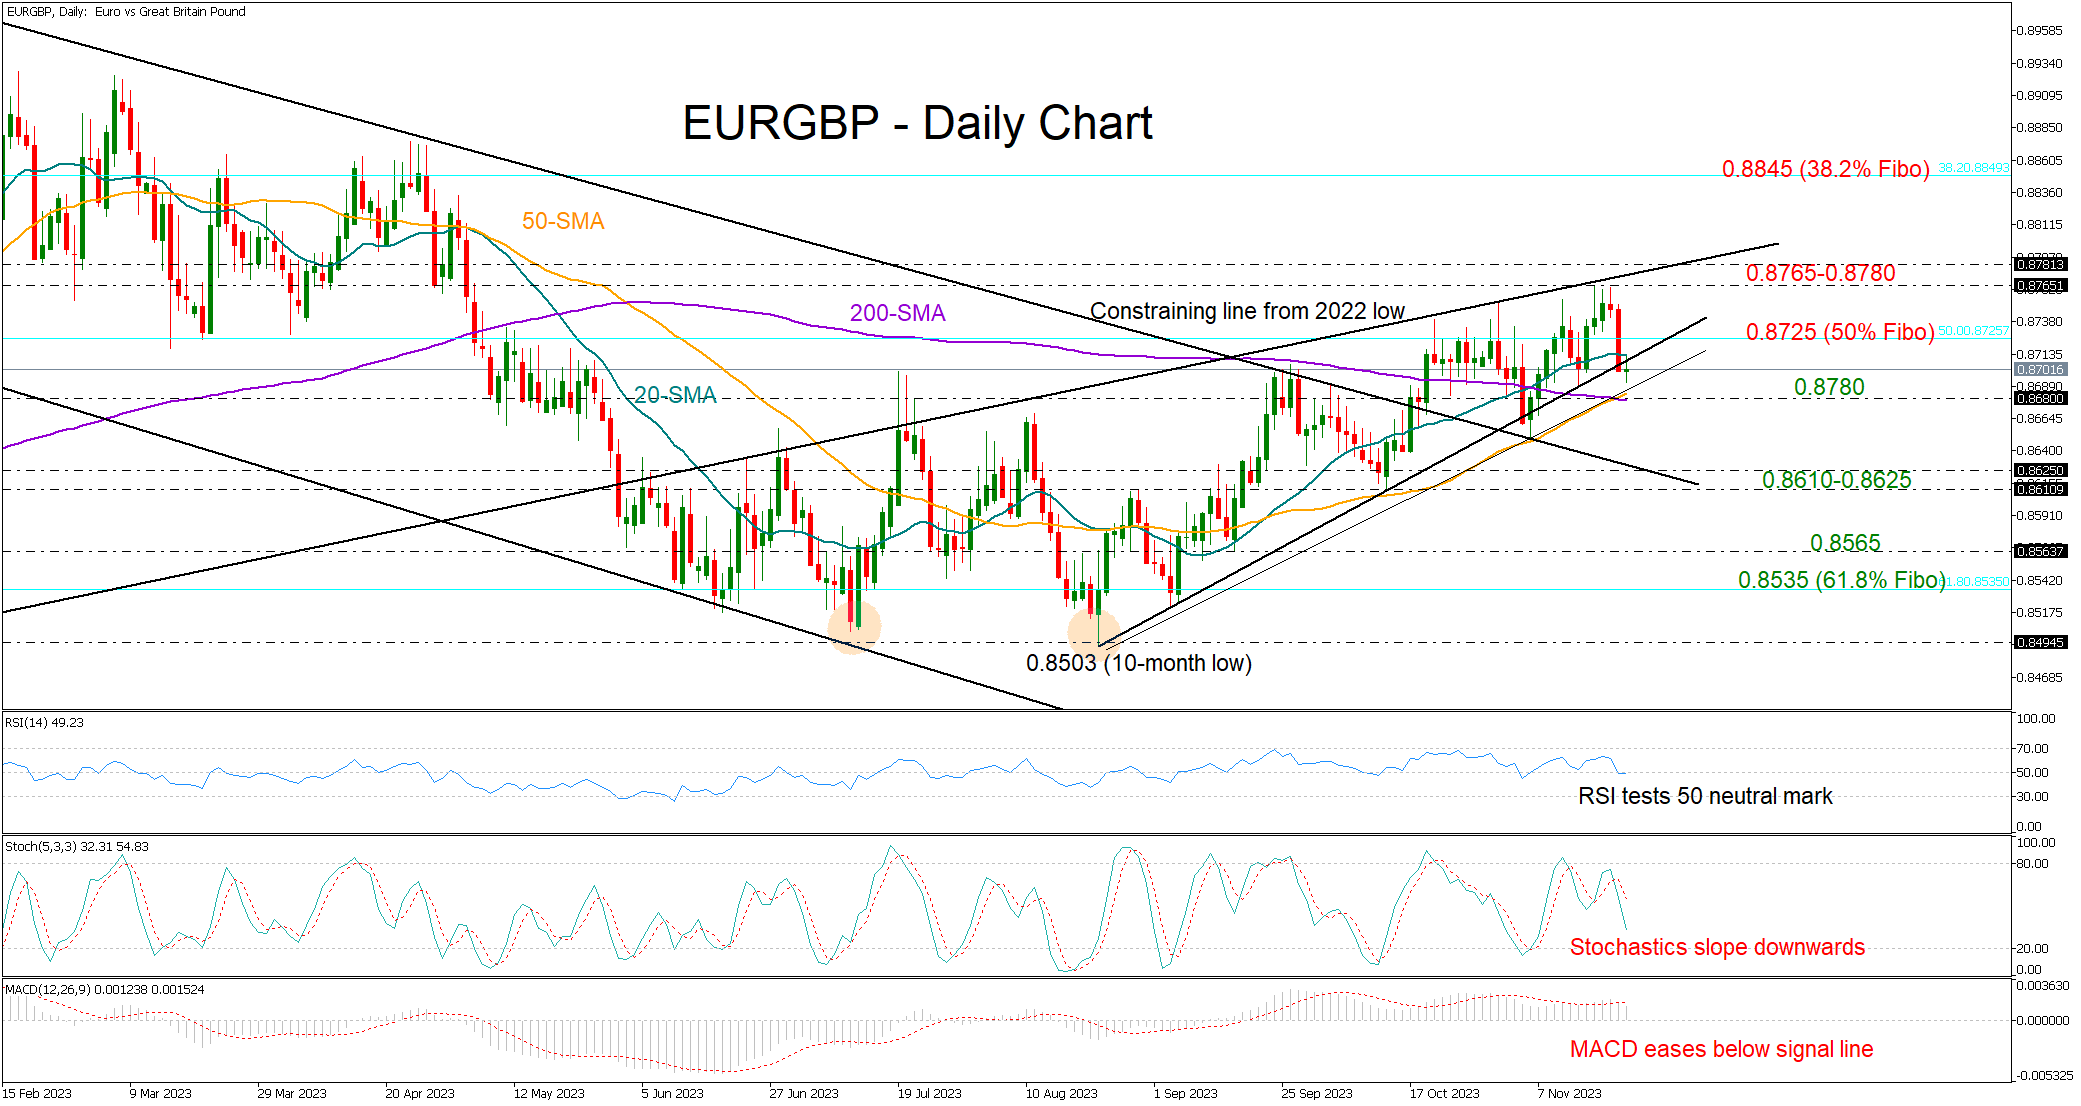
EURGBP Flips Backwards; Focus on 0.8780
- EURGBP erases last week’s bounce
- Technical signals are mixed
- Selling pressures might intensify below 0.8780
EURGBP switched to losses, falling back below its 20-day simple moving average (SMA) after an unsuccessful three-day battle around the more-than-six month high of 0.8764.
The pair is currently trying to stay afloat above the 0.8700 round-level as the 20-day SMA appeared a tough obstacle earlier today at 0.8712. From a technical perspective, the risk is more to the downside than to the upside.
The price closed marginally below the key support trendline from August’s lows yesterday, while the momentum indicators have resumed their negative slope. Specifically, the RSI is set to cross below its 50 neutral mark and the stochastic oscillator is moving southwards again. Meanwhile, the MACD has slid below its red signal line too, indicating some pessimism among investors.
Yet, the golden cross marked between the 50- and 200-day SMAs is feeding some hopes that the positive trend from August’s lows could become more pronounced.
If the bears drive the pair below its 50- and 200-day SMAs at 0.8780, they may gain direct access to the 0.8610-0.8625 key area. This is where the upper band of the broken bearish channel from February’s highs is placed. Hence, another failure there could motivate a more aggressive selling towards the 0.8535-0.8565 constraining region.
On the upside, a break above the 20-day SMA and the 50% Fibonacci retracement of the January-September 2022 upleg at 0.8725 could lift the price up to the 0.8765-0.8780 caution zone. A victory there could generate strong buying interest, likely boosting the price towards the 38.2% Fibonacci of 0.8845.
All in all, EURGBP seems to be trading within neutral territory. A decisive rally above 0.8780 could brighten the short- and medium-term outlook, whilst a drop below 0.8680 might revive downside pressure.
AUD/USD Analysis: Price at Important Resistance Block
Yesterday's news from the FOMC is unlikely to have much impact on participants' views that the Fed's tightening cycle is over. According to published protocols:
→ The Fed will act cautiously;
→ all FOMC participants considered it appropriate to keep rates at current levels;
→ everyone also agreed that they would raise interest rates only if progress in controlling inflation slowed. In doing so, they left the door open to the possibility of further tightening, even as data showed a sustained slowdown in inflation.
Market participants are almost confident that the Fed will keep rates at its December meeting, while estimating the likelihood of a rate cut as early as March at about 30%, according to CME's FedWatch Tool.
The reaction of the foreign exchange market was a slight strengthening of the dollar index relative to other currencies, in particular AUD/USD.
By the way, yesterday, the head of the Reserve Bank of Australia, Michelle Bullock, warned that wages are growing at a pace that cannot be sustained without reversing the decline in productivity in the country, which indicates the possibility of another rate hike to suppress inflation.
“Inflation will be the most important issue in the next one to two years,” she said on Tuesday.
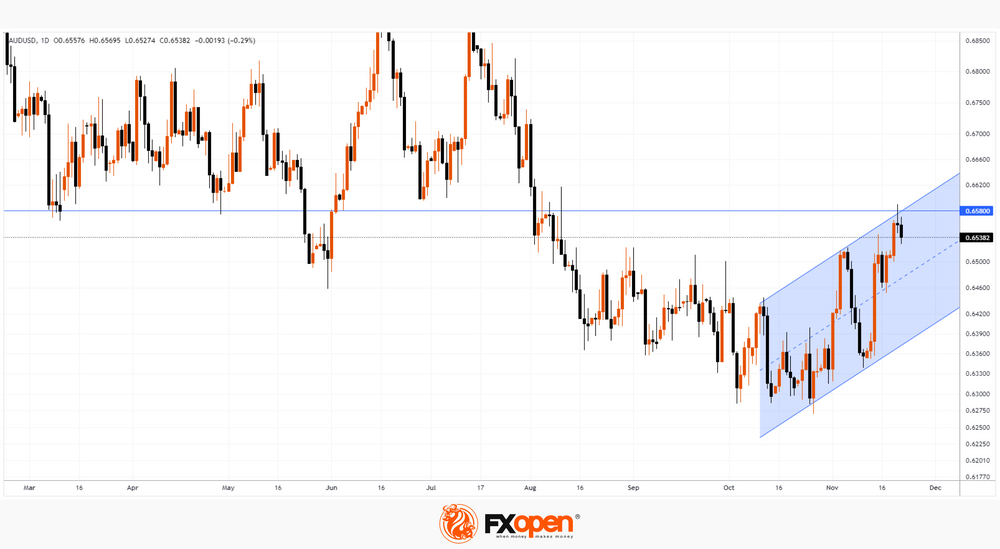
The AUD/USD chart meanwhile shows that:
→ the rate is at an important resistance of 0.658 – the rate has repeatedly formed reversals from this level;
→ the upper boundary of the ascending channel (shown in blue) may increase resistance;
→ the upper long shadow on yesterday's candle indicates the activation of sellers.
With AUD/USD up over 5% from the October lows, some correction from the above resistance levels looks like a worthwhile scenario.
This article represents the opinion of the Companies operating under the FXOpen brand only. It is not to be construed as an offer, solicitation, or recommendation with respect to products and services provided by the Companies operating under the FXOpen brand, nor is it to be considered financial advice.
RBA’s Bullock: Inflation increasingly domestic and lengthy to control
RBA Governor Michele Bullock, in a speech, emphasized the changing nature of the inflation challenge facing Australia, noting its increasing shift towards being "homegrown and demand driven." This distinction is crucial as it significantly influences the central bank's policy response.
Bullock differentiated between inflation driven by global supply disruptions, over which monetary policy has limited influence, and inflation stemming from domestic demand exceeding the economy's potential. In the case of the latter, she argues, "a more substantial monetary policy tightening is the right response."
The Governor also highlighted three key indicators supporting the demand-driven nature of current inflation: Firstly, the broad-based nature of inflation across various sectors; secondly, the underpinning of inflation by domestic demand, particularly in services; and thirdly, the continued limited spare capacity in the economy, as evident in high rates of labor utilization.
Regarding the timeframe for bringing inflation back to the target range, Bullock suggested that while supply-side issues eased relatively quickly, reducing inflation from 8% to 5.5% within three quarters, the demand-driven component would take longer to address. She projected that it might take another two years for inflation to fall below 3%.