
Sample Category Title
WTI Oil Technical: Recent Plunge Seems to Have Found a Floor ahead of OPEC+
- The 7-week decline of -23% in WTI crude oil has started to stabilize in the last two days.
- The recent rebound of +8% from last Friday, 17 November low has been driven by anticipation of an extension of oil supply cuts into 2024 by OPEC+.
- Watch the US$75.60 key short-term support in WTI crude oil.
In the past four weeks, oil prices have been hammered to the downside due to waning external global demand as the past year of tight monetary policies enacted by developed nations’ central banks (except Japan) have started to show negative trickle-down effects on the real economy.
In addition, the geopolitical risk premium has remained status quo as the ongoing Israel-Hamas conflict has not triggered a wider negative repercussion in the Middle East region at this juncture since the start of the hostilities on 7 October 2023.
The price actions of West Texas Oil (a proxy of WTI crude oil futures) have tumbled by -23% from its 28 September 2023 high of US$95.50/barrel to last Thursday, 16 November low of US$72.68/barrel.
Bears have managed to stall at a key medium-term support
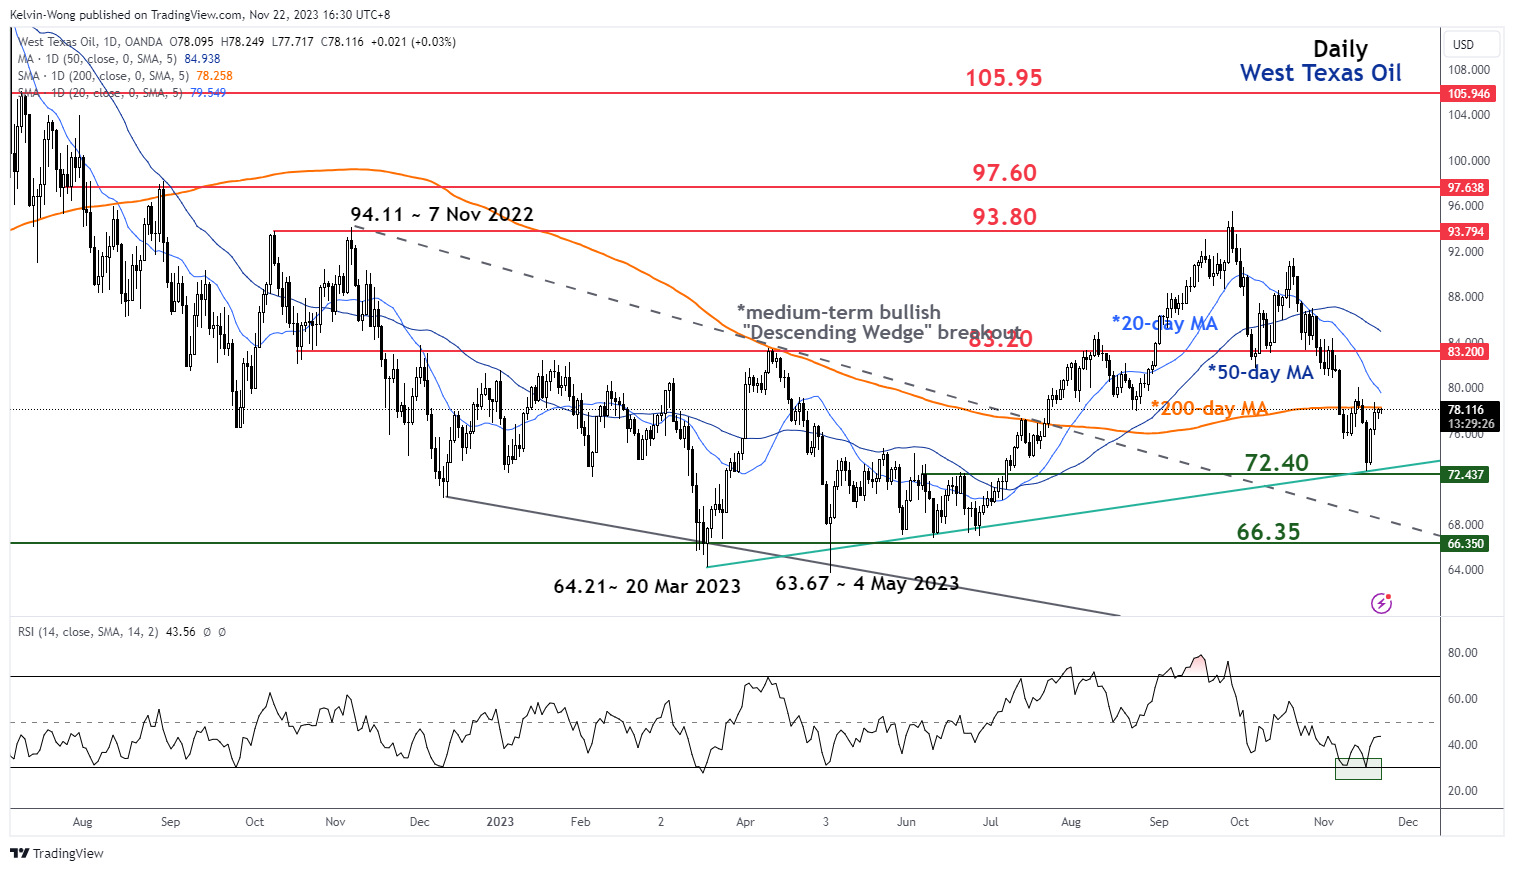
Fig 1: West Texas Oil medium-term trend as of 22 Nov 2023 (Source: TradingView, click to enlarge chart)
Interestingly, the seven-week decline seen in West Texas Oil has managed to stall at the US$72.40 key medium-term support which is defined by the ascending trendline in place since the 20 March 2023 low, congestion zone of 7 June/21 June 2023 and the 76.4% of the Fibonacci retracement of the prior medium-term uptrend from 4 May 2023 low to 28 September 2023 high; a confluence of different elements leading to similar price level.
Thereafter, it managed to stage a significant rebound of +8.3% to print an intraday high of US$78.75 on Monday, 20 November before it traded sideways.
The current bout of optimism in oil prices has been driven by built-up anticipation that OPEC+ members are likely to extend the current quantum of supply cuts into 2024 or even the possibility of deeper cuts when the cartel group meets this Sunday, 26 November.
Retesting its 200-day moving average
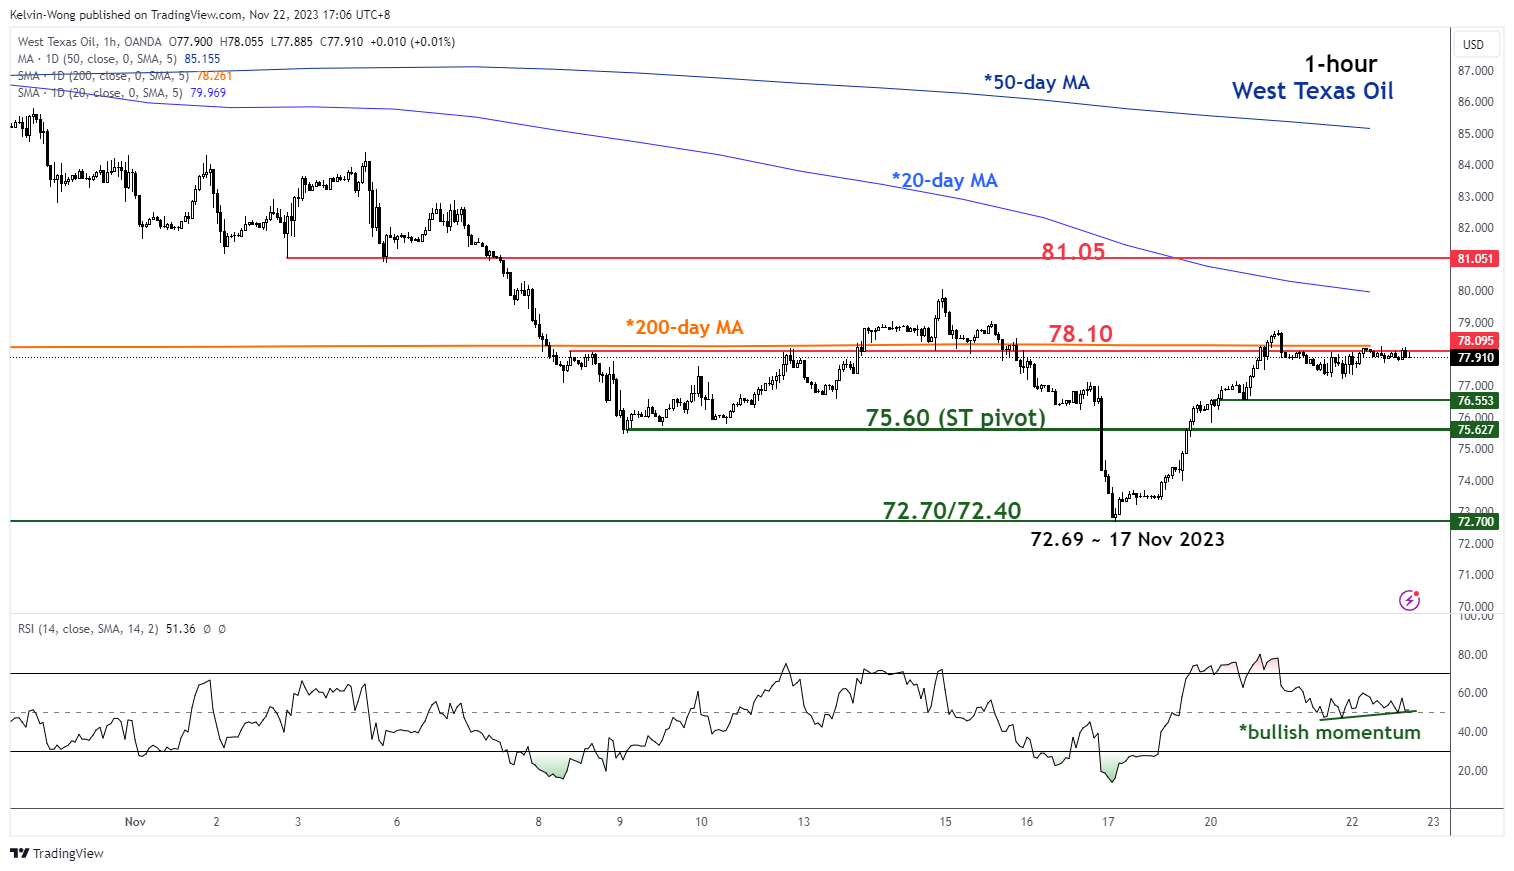
Fig 2: West Texas Oil minor short-term trend as of 22 Nov 2023 (Source: TradingView, click to enlarge chart)
As seen in the shorter-term 1-hour chart, the price actions of West Texas Oi have traded in a narrow sideway range of 1% since yesterday, 20 November after a retest on the 200-day moving average now acting as a near-term resistance of US$78.10.
The hourly RSI momentum indicator has continued to hold above the 50 level which suggests a potential bullish momentum reading at least in the short term.
Watch the US$75.60 key short-term pivotal support and clearance above the 200-day moving average (US$78.10) may see the next intermediate resistance coming in at US$81.05.
On the other hand, failure to hold at US$75.60 exposes the key medium-term support zone of US$72.70/72.40.
Binance Case Shocked But Hasn’t Broken Crypto Market
Market picture
Crypto market capitalisation fell 2.5% in 24 hours to $1.39 trillion, partially recovering from $1.35 trillion. The pressure on the market is due to the resignation of Binance’s CEO, who has been the face of the industry for the past year following the collapse of FTX. The market movement does not yet suggest a dramatic change in the long-term view of the industry.
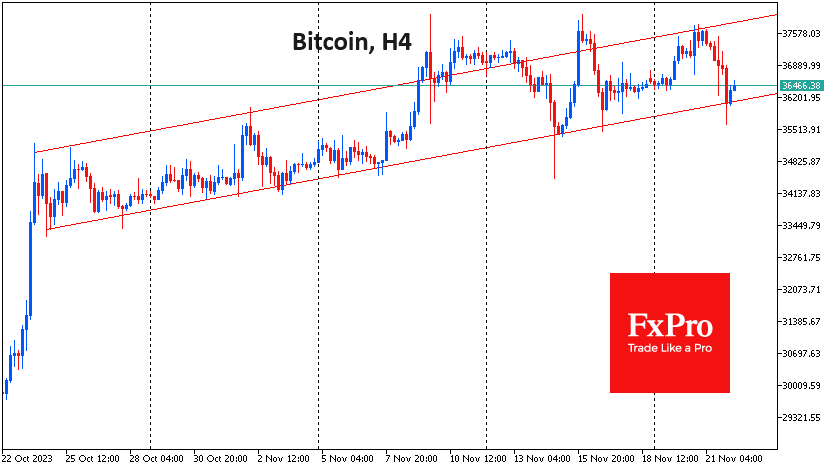
Bitcoin briefly touched $35.6K but found buyers again in more liquid trading at the start of the European session. So far, the top cryptocurrency has managed to stay within the uptrend of the last four weeks.
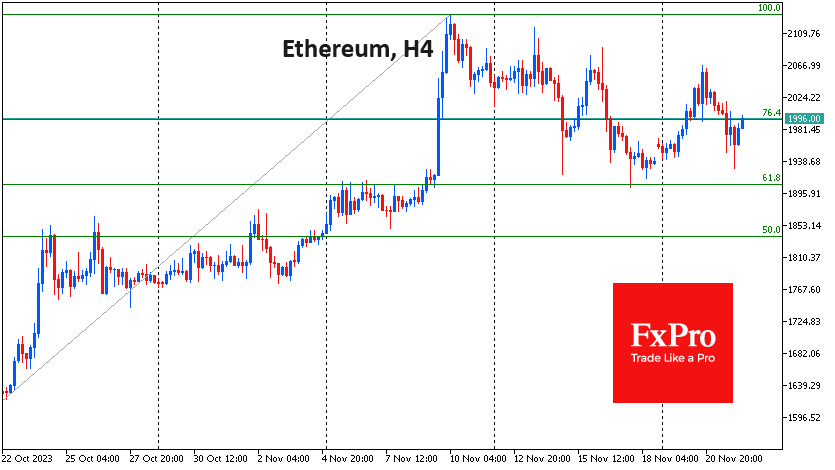
Solana and Ethereum have retreated to support 61.8% of the rally from last month’s lows. Continued buying in the sector today could signal the correction’s end and buyers’ return. An intensification of the sell-off from current levels would signal a move to a deeper drawdown, breaking the uptrend of the past few months.
News background
Binance, the world’s largest exchange, has settled the case with US authorities, agreeing to pay more than $4.3 billion in compensation for violating some laws.
The exchange’s chief executive, Changpeng Zhao, resigned after pleading guilty and agreeing to pay $50 million personally. Richard Teng, former head of regional markets, became the new CEO.
Meanwhile, the SEC accused Kraken of trading in unregistered securities and failing to register as an exchange, broker, dealer, and clearing agency. The SEC also alleges Kraken commingles customer funds with its assets and uses customer accounts to pay operating expenses. The exchange has denied the SEC’s allegations and intends to defend its position in court. Kraken co-founder Jesse Powell has called for all cryptocurrency companies to leave the US.
Popular blockchain analyst and researcher Willie Wu said that Bitcoin will never go below $30K again. According to him, whenever BTC has experienced a bear market or a halving, “the price has never come back”.
The number of bitcoins with “paper” profits has reached 83.6 per cent of all coins in circulation – the highest since November 2021 – but the average value of those profits remains insufficient to create a wave of holders closing positions, Glassnode said.
According to The Block, the average fee on the first cryptocurrency’s blockchain has surpassed the corresponding figure for Ethereum amid renewed interest in Ordinals Wallet. Over the past seven days, the average transaction value on the Bitcoin network has risen 49 per cent, from $8.59 to $12.75. Ether’s figure is $7.55.
GBP/JPY Daily Outlook
Daily Pivots: (S1) 184.99; (P) 185.55; (R1) 186.62; More...
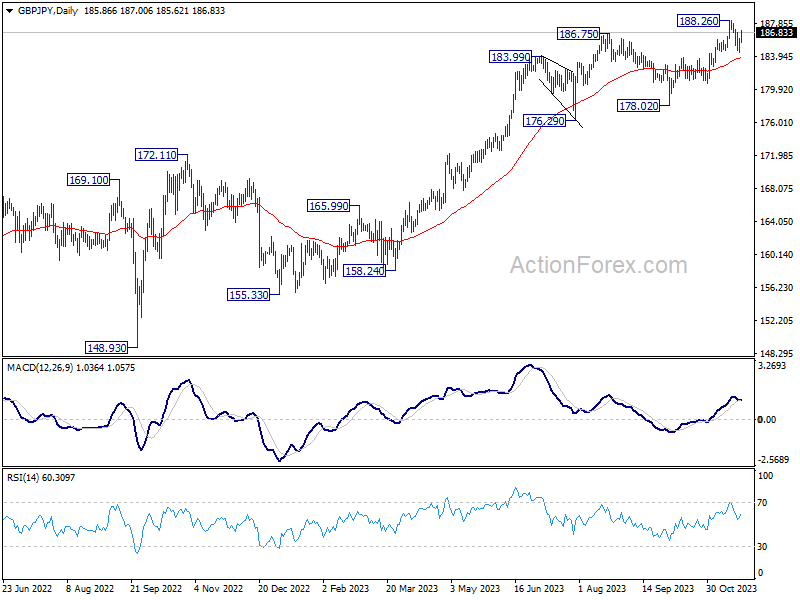
Intraday bias in GBP/JPY is back on the upside with break of 186.77 minor resistance. Retest of 188.26 high should be seen next. Decisive break there will resume larger up trend. On the downside though, below 184.44 support will resume the fall from 188.26 to 183.79 resistance turned support.
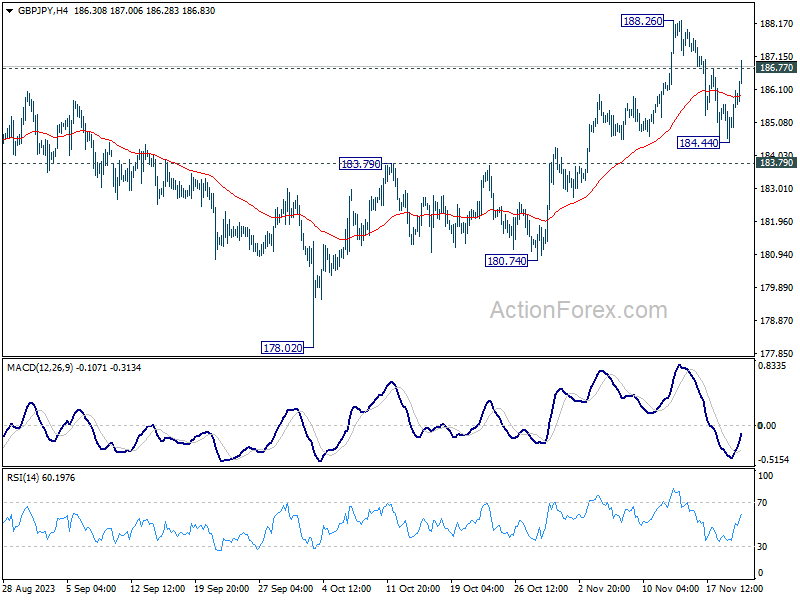
In the bigger picture, as long as 180.74 support holds, larger up trend from 123.94 (202 low) should still be in progress, next target is 195.86 (2015 high). However, firm break of 180.74 will now argue that a medium term top is formed, possibly in bearish divergence condition in D MACD, and bring deeper fall back to 178.02 support.
EUR/JPY Daily Outlook
Daily Pivots: (S1) 161.30; (P) 161.86; (R1) 162.48; More....
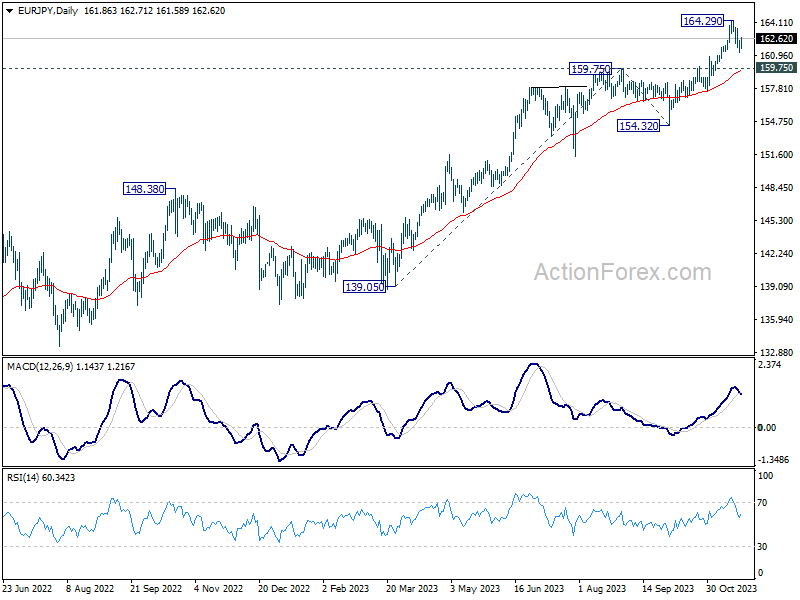
Intraday bias in EUR/JPY is back on the upside with break of 162.42 minor resistance. Retest of 164.29 resistance should be seen next. Firm break there will resume larger up trend. On the downside, though, below 161.22 will resume the fall from 164.29 to 159.75 resistance turned support.
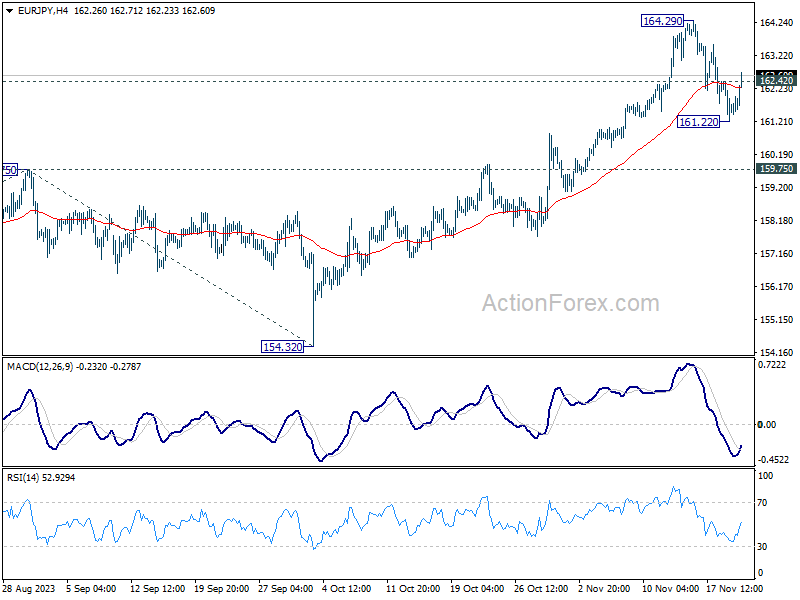
In the bigger picture, rise from 114.42 (2020 low) is in progress. Next target is 169.96 (2008 high). On the downside, break of 159.75 resistance turned support is needed to be the first sign of medium term topping. Otherwise, outlook will remain bullish even in case of deep pullback.
EUR/GBP Daily Outlook
Daily Pivots: (S1) 0.8684; (P) 0.8720; (R1) 0.8738; More....
EUR/GBP is still holding above 0.8648 support despite current steep retreat. Intraday bias remains neutral first, and another rally is in favor. Break of 0.8764 will resume whole rebound from 0.8491. However, decisive break of 0.8687 will confirm short term topping, and turn bias back to the downside for 0.8648 support and below.

In the bigger picture, down trend from 0.9267 (2022 high) should have completed completed with three down to to 0.8491. Rise from 0.8491 is seen as another leg inside that pattern from 0.9499 (2020 high). Further rally should be seen to 0.8977 resistance and above. This will remain the favored case as long as 0.8648 support holds.

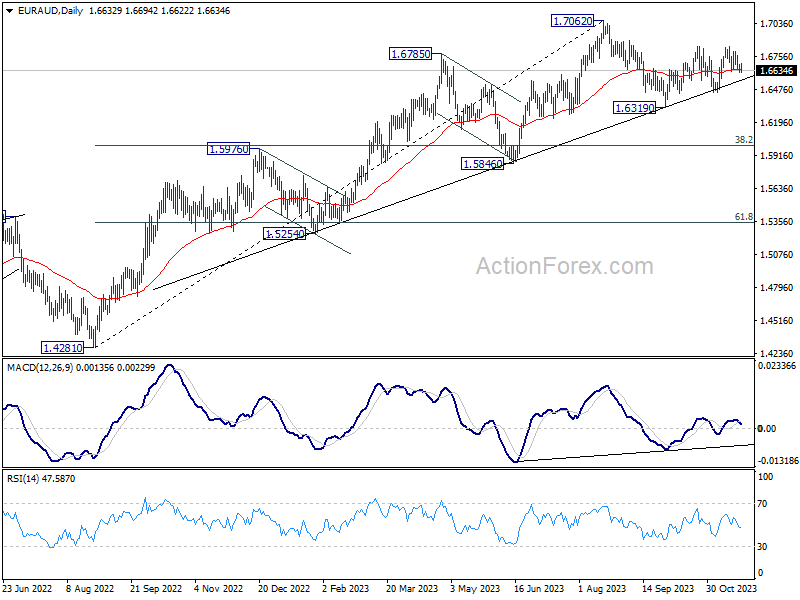
EUR/AUD Daily Outlook
Daily Pivots: (S1) 1.6613; (P) 1.6654; (R1) 1.6684; More...
Intraday bias in EUR/AUD stays neutral first. On the downside, firm break of 1.6631 support will turn bias back to the downside for 1.6449 support. On the upside, sustained break of 1.6843/4 will resume the rebound from 1.6319 for retesting 1.7062 high next.
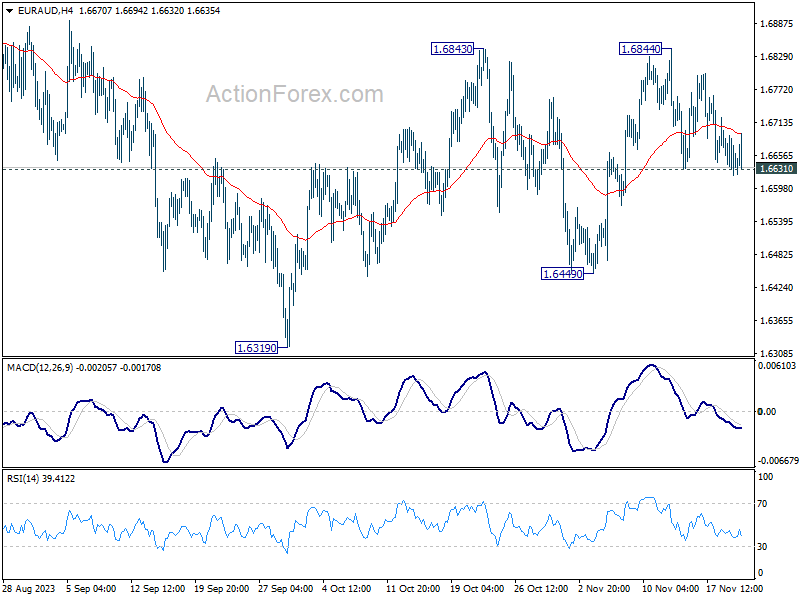
In the bigger picture, while 1.7062 is a medium term top, there is no clear sign of trend reversal as EUR/AUD continues to draw strong support from the medium term trend line. Break of 1.7062 will resume the larger up trend from 1.4281 (2022 low) to 1.7691 fibonacci level. Nevertheless, break of 1.6449 support will argue that deeper correction is underway to 38.2% retracement of 1.4281 to 1.7062 at 1.6000.
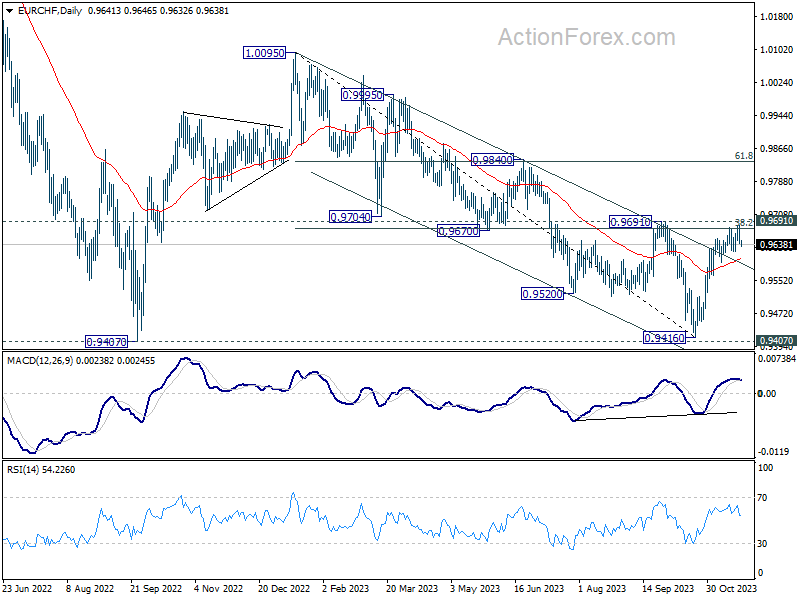
EUR/CHF Daily Outlook
Daily Pivots: (S1) 0.9626; (P) 0.9656; (R1) 0.9670; More...
Intraday bias in EUR/CHF is turned neutral with current retreat. Some consolidations would be seen first. But further rally is in favor as long as 0.9620 support holds. On the upside, decisive break of 0.9691 resistance will carry larger bullish implication, and target 0.9840 resistance next. However, break of 0.9620 support will indicate short term topping, and turn bias back to the downside for deeper pull back.
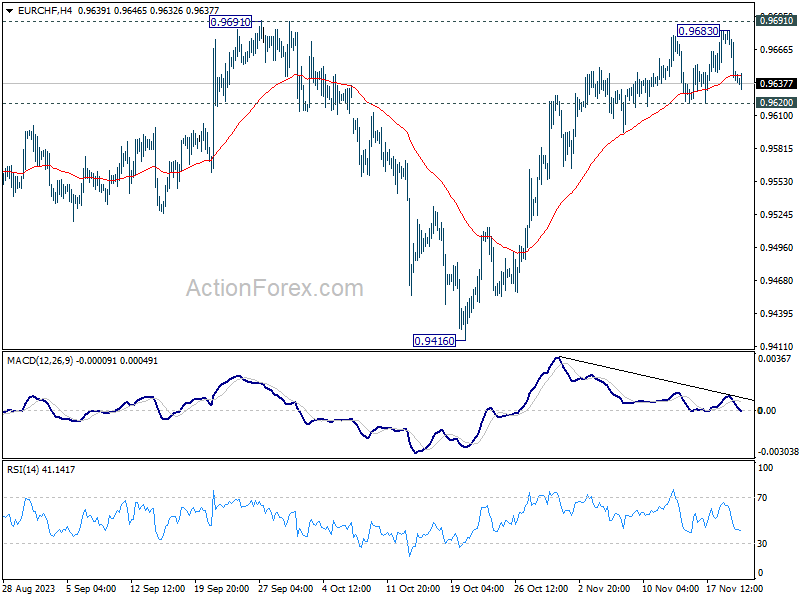
In the bigger picture, fall from 1.0095 (2023 high) might have completed at 0.9416, just ahead of 0.9407 support (2022 low). Sustained break of 0.9691 cluster resistance (38.2% retracement of 1.0095 to 0.9416 at 0.9675) will pave the way to 61.8% retracement at 0.9836 and above. However, rejection by 0.9691 will maintain medium term bearishness for another test on 0.9407 at least.
Time for a Correction in NZDUSD?
- NZDUSD in the red today after recording a new higher high
- Bulls took advantage of the widespread USD underperformance
- The stochastic oscillator could turn bearish soon
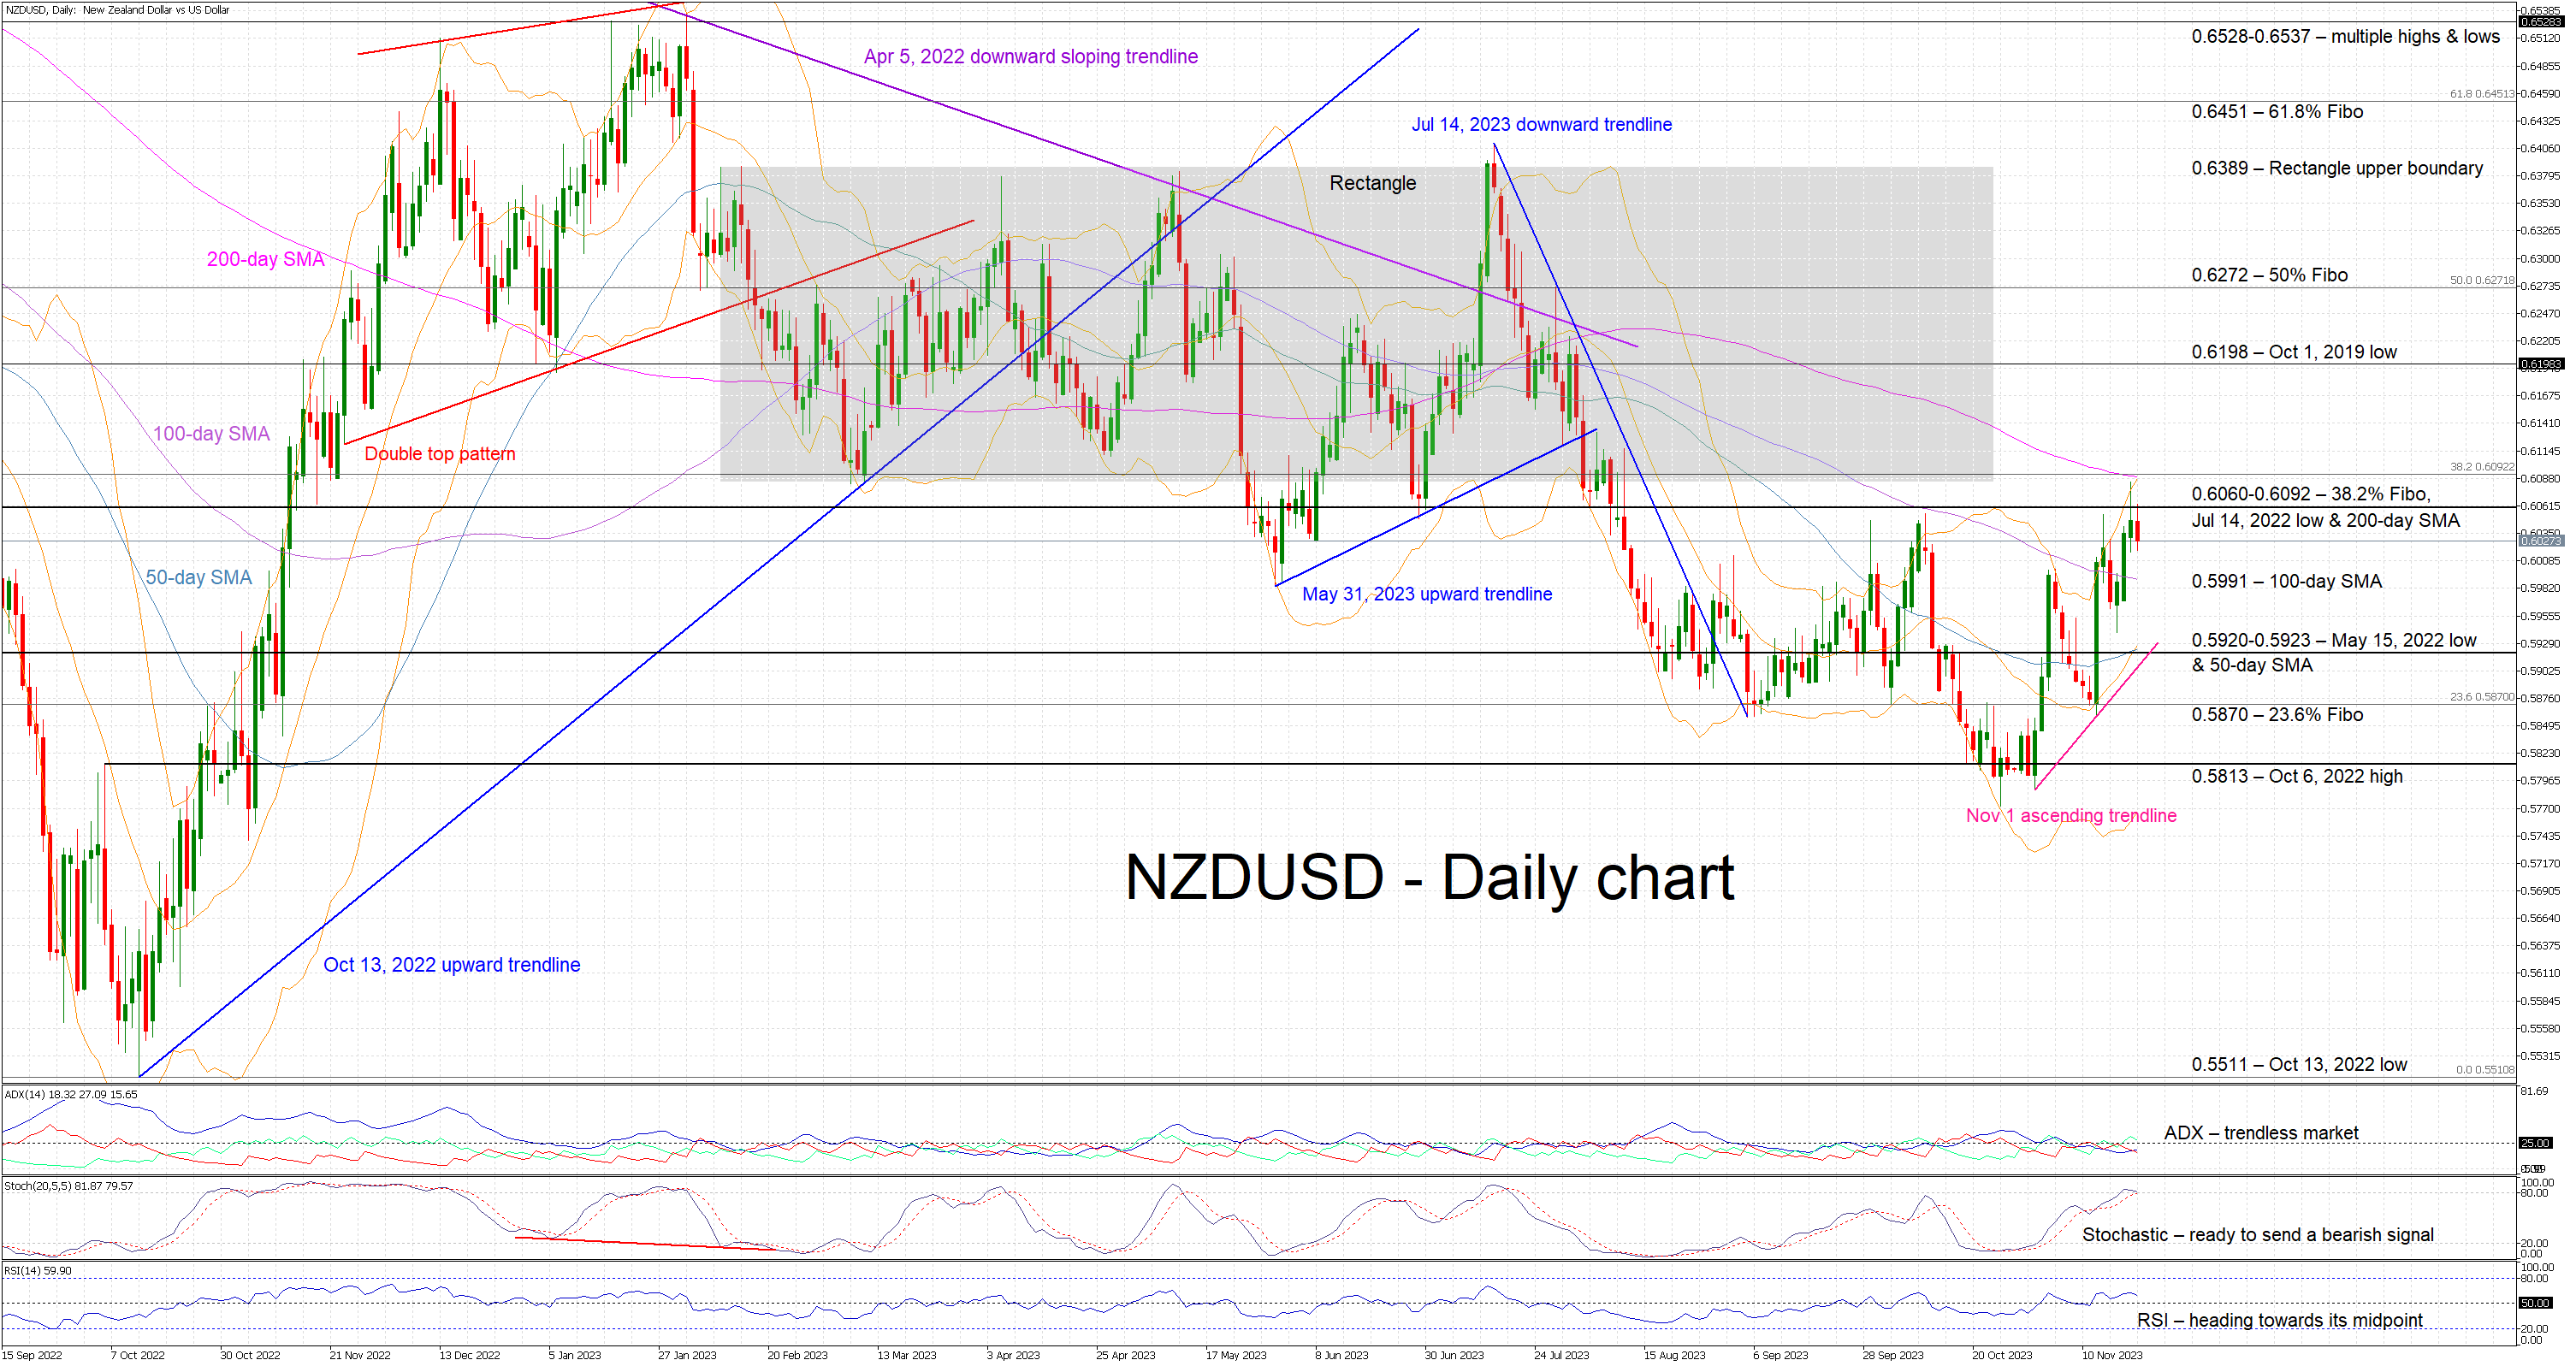
NZDUSD is edging lower, reacting to Tuesday's 3-month high of 0.6085. It has been an aggressive rally from the November 1 low of 0.6017 as the NZDUSD bulls took advantage of the recent widespread USD weakness. They have managed to establish a bullish series of higher highs and higher lows but the next local trough has to be above the 0.5939 level for this pattern to remain intact. In the meantime, a stretched double top pattern appears to be forming with a move below the 0.5772 neckline needed for this structure to become active.
Amidst these developments, the focus has turned to the mixed momentum indicators. More specifically, the Average Directional Movement Index (ADX) points to a trendless market, and the RSI is edging lower but remains above its 50-midpoint. More importantly, the stochastic oscillator is trying to break below its moving average. If successful, it could signal the start of a correction in NZDUSD.
If the bulls remain confident, they could try to push NZDUSD above the 0.6060-0.6092 region. This is defined by the 38.2% Fibonacci retracement of the April 5, 2022 – October 13, 2022 downtrend, the July 14, 2022 low and the 200-day simple moving average (SMA). Even higher, the path looks clear until the October 1, 2019 low at 0.6198.
On the flip side, the bears are trying to regain market control. They could try to keep NZDUSD below the 0.6060-0.6092 region and then test the 100-day SMA at 0.5991. They could then set a course towards the 0.5920-0.5923 range that is populated by the May 15, 2022 low and the 50-day SMA. Even lower, the bears could face sizeable support at both the 0.5870 and 0.5813 levels.
To sum up, NZDUSD bulls have managed to record a new higher high, but they now have to defend their recent gains against the resurgent bears.
USDJPY Ticks Up After Bullish Doji Candle
- USDJPY advances after it bottomed at 147.10
- Momentum indicators suggest more gains in the near term
- A jump above 20- and 50-day SMAs would shift the bias back to bullish
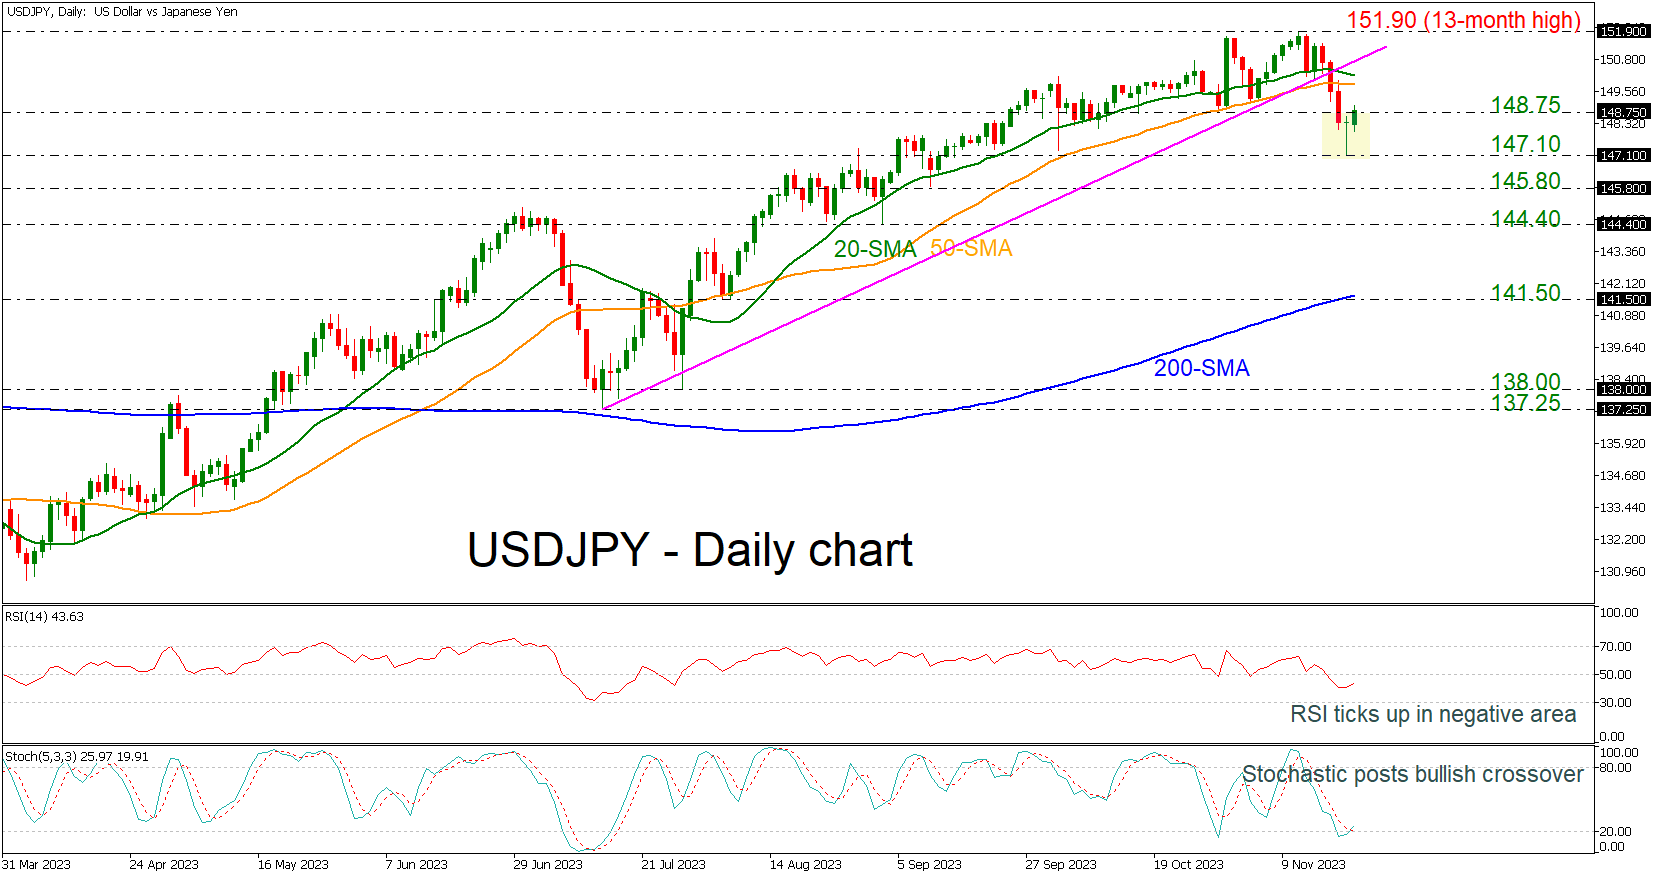
USDJPY stormed higher after posting a bullish doji candle that indicates an upside reverse on the current trend in the short-term.
The price is gaining some ground trying to recoup the previous days’ sell-off with the technical oscillators endorsing the positive move. The RSI is ticking up in the negative region, while the stochastics posted a bullish crossover between the %K and %D lines.
If the bullish pressures persist, the price could revisit its recent resistance lines of the 50- and then the 20-day simple moving averages (SMAs) at 149.85 and 150.20 respectively. A jump above these lines and a return above the penetrated rising trend line could pave the way for the 13-month peak of 151.90.
Alternatively, should the bears attempt to push the price lower, initial declines could cease at the recent support of 147.10. Diving below that floor, the price may descend towards the 145.80 barrier ahead of the 144.40 level, registered on September 1.
In brief, USDJPY is switching the bearish bias to bullish in the short-term timeframe and any jumps above the short-term SMAs would confirm the upside structure in the medium-term outlook as well.
EUR/USD Extends Rally While USD/CHF Dives
EUR/USD started a steady increase above the 1.0830 resistance. USD/CHF declined and now struggling below the 0.8900 resistance.
Important Takeaways for EUR/USD and USD/CHF Analysis Today
- The Euro rallied after it broke the 1.0830 resistance against the US Dollar.
- There is a short-term bearish trend line forming with resistance near 1.0930 on the hourly chart of EUR/USD at FXOpen.
- USD/CHF declined below the 0.9000 and 0.8900 support levels.
- There is a connecting bearish trend line forming with resistance near 0.8840 on the hourly chart at FXOpen.
EUR/USD Technical Analysis
On the hourly chart of EUR/USD at FXOpen, the pair started a decent increase from the 1.0700 zone. The Euro cleared the 1.0750 resistance to move into a bullish zone against the US Dollar.
The bulls pushed the pair above the 50-hour simple moving average and 1.0830. Finally, the pair tested the 1.0965 resistance. It is now correcting gains and trading below the 23.6% Fib retracement level of the upward wave from the 1.0824 swing low to the 1.0965 high.
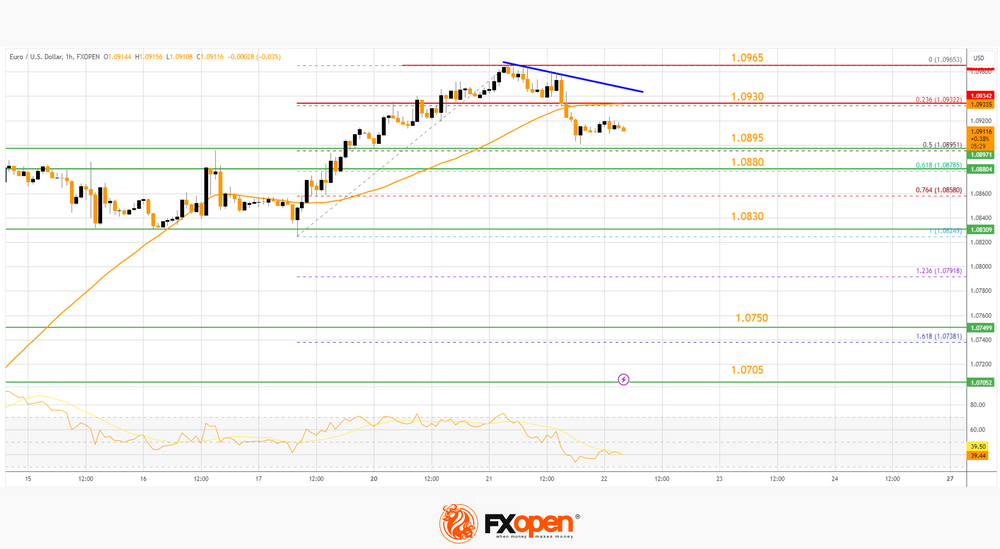
Immediate support on the downside is near the 50% Fib retracement level of the upward wave from the 1.0824 swing low to the 1.0965 high at 1.0895. The next major support is 1.0880.
A downside break below the 1.0880 support could send the pair toward the 1.0830 level. Any more losses might send the pair into a bearish zone to 1.0750.
Immediate resistance on the EUR/USD chart is near the 50-hour simple moving average at 1.0930. There is also a short-term bearish trend line forming with resistance near 1.0930. The first major resistance is near the 1.0965 level. An upside break above the 1.0965 level might send the pair toward the 1.0985 resistance.
The next major resistance is near the 1.1000 level. Any more gains might open the doors for a move toward the 1.1050 level.
USD/CHF Technical Analysis
On the hourly chart of USD/CHF at FXOpen, the pair started a fresh decline from well above the 0.9000 zone. The US Dollar dropped below the 0.8900 support to move into a negative zone against the Swiss Franc.
The bears pushed the pair below the 50-hour simple moving average and 0.8860. Finally, the bulls appeared near the 0.8820 level. A low is formed near 0.8819 and the pair is now attempting a recovery wave.
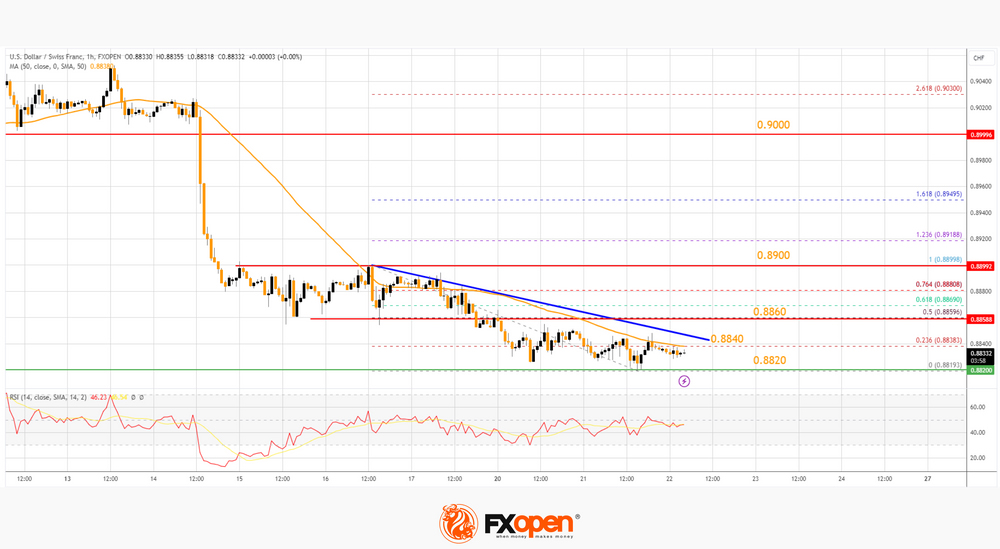
On the upside, the pair could face resistance near the 50-hour simple moving average and the 23.6% Fib retracement level of the downward move from the 0.8899 swing high to the 0.8819 low.
There is also a connecting bearish trend line forming with resistance near 0.8840. The next major resistance is near the 50% Fib retracement level of the downward move from the 0.8899 swing high to the 0.8819 low at 0.8860.
If there is a clear break above the 0.8860 resistance zone, the pair could start another increase. In the stated case, it could even surpass 0.8900.
On the downside, immediate support on the USD/CHF chart is 0.8820. The first major support is near the 0.8800 level. The next major support is near 0.8765. Any more losses may possibly open the doors for a move toward the 0.8720 level in the coming days.
This article represents the opinion of the Companies operating under the FXOpen brand only. It is not to be construed as an offer, solicitation, or recommendation with respect to products and services provided by the Companies operating under the FXOpen brand, nor is it to be considered financial advice.