
Sample Category Title
Gold Lacks Bullish Momentum
Gold (XAU) declined on Friday, losing initial gains XAUUSD got on the back of the weakening U.S. dollar.
Possible effects for traders
Economic data indicating a slowing U.S. economy brought the U.S. dollar to its lowest point in nearly a month as the chances of additional rate hikes by the Federal Reserve decreased. 'Data indicating some weakness in labour markets helped drive market expectations around the Fed and thus drove gold higher today. This comes after a retrenchment in some of the risk-off flows that have occurred as concerns about a broader Middle East conflict have ebbed,' said Christopher Louney, a commodities strategist at RBC Capital Markets.
Today, XAUUSD decreased in the Asian trading session but rose in the early hours of the European session. The People's Bank of China maintained its one and five-year loan prime rates unchanged at 3.45% and 4.2%, aligning with market forecasts. 'Spot gold looks neutral in a range of $1,976–1,990 per ounce, and an escape could suggest a direction,' said Reuters analyst Wang Tao.
Japanese Yen Benefited from U.S. Dollar Weakness
The Japanese yen rose over 149.000, reaching its highest level in over five weeks, driven by overall weakness in the U.S. dollar. Now, the market doesn't expect rate hikes from the Federal Reserve. Expectations shifted towards a more dovish policy by the regulator, so investors believe rate cuts will come in May 2024.
Possible effects for traders
Recent data revealed that Japan's economy shrunk more rapidly than anticipated in Q3 as the global demand declined and domestic inflation increased. The Bank of Japan (BOJ) repeated its dedication to continuing its current loose monetary policy, implementing only minor modifications to its yield curve control measures. The BOJ adjusted its approach to the 10-year Japanese government bonds, designating 1% as a flexible 'upper bound' instead of a strict limit. The regulator also said it wouldn't defend this level via unlimited bond purchases.
USDJPY declined during the Asian trading session but grew in the early European trading hours. Today, the formal macroeconomic calendar is uneventful for the pair. This week, investors will focus on upcoming preliminary manufacturing and services PMI figures and inflation data from Japan, which will provide insights into the country's economic state and possible changes in the monetary policy.
GBP/USD Regains Strength While USD/CAD Weakens
GBP/USD started a fresh increase above the 1.2370 zone. USD/CAD is declining and trading below the 1.3730 support.
Important Takeaways for GBP/USD and USD/CAD Analysis Today
- The British Pound is eyeing a fresh increase above the 1.2500 resistance.
- There was a break above a key bearish trend line with resistance near 1.2430 on the hourly chart of GBP/USD at FXOpen.
- USD/CAD started a fresh decline after it broke the 1.3840 resistance.
- There was a break below a major bullish trend line with support near 1.3730 on the hourly chart at FXOpen.
GBP/USD Technical Analysis
On the hourly chart of GBP/USD at FXOpen, the pair formed a base above the 1.2185 level. The British Pound started a decent increase above the 1.2250 resistance zone against the US Dollar.
The pair gained strength above the 1.2300 level. The bulls even pushed the pair above the 1.2370 level and the 50-hour simple moving average and 1.2120. The pair cleared the 50% Fib retracement level of the downward move from the 1.2505 swing high to the 1.2373 low.
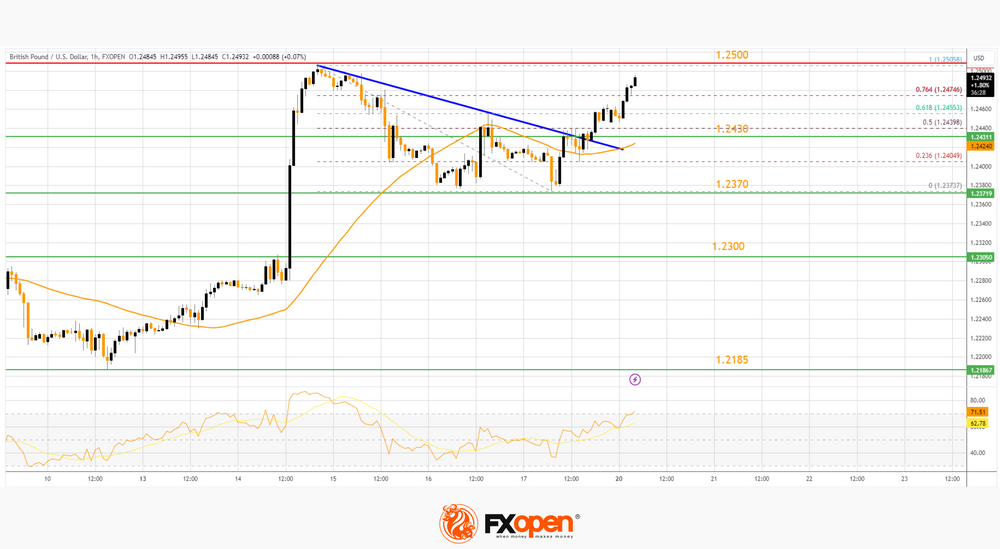
There was a break above a key bearish trend line with resistance near 1.2430. It is now trading above the 76.4% Fib retracement level of the downward move from the 1.2505 swing high to the 1.2373 low.
The RSI moved above the 65 level on the GBP/USD chart and the pair is now approaching a major hurdle at 1.2500. An upside break above the 1.2500 zone could send the pair toward 1.2550. Any more gains might open the doors for a test of 1.2620.
On the downside, the pair might find support near the 50-hour simple moving average at 1.2430. The next major support is 1.2370.
If there is a break below 1.2370, the pair could extend the decline. The next key support is near the 1.2300 level. Any more losses might call for a test of the 1.2185 support.
USD/CAD Technical Analysis
On the hourly chart of USD/CAD at FXOpen, the pair climbed toward the 1.3775 resistance zone before the bears appeared. The US Dollar formed a high near 1.3776 and recently declined below the 1.3730 support against the Canadian Dollar.
There was a break below a major bullish trend line with support near 1.3730. The pair declined below the 61.8% Fib retracement level of the upward move from the 1.3654 swing low to the 1.3775 high.
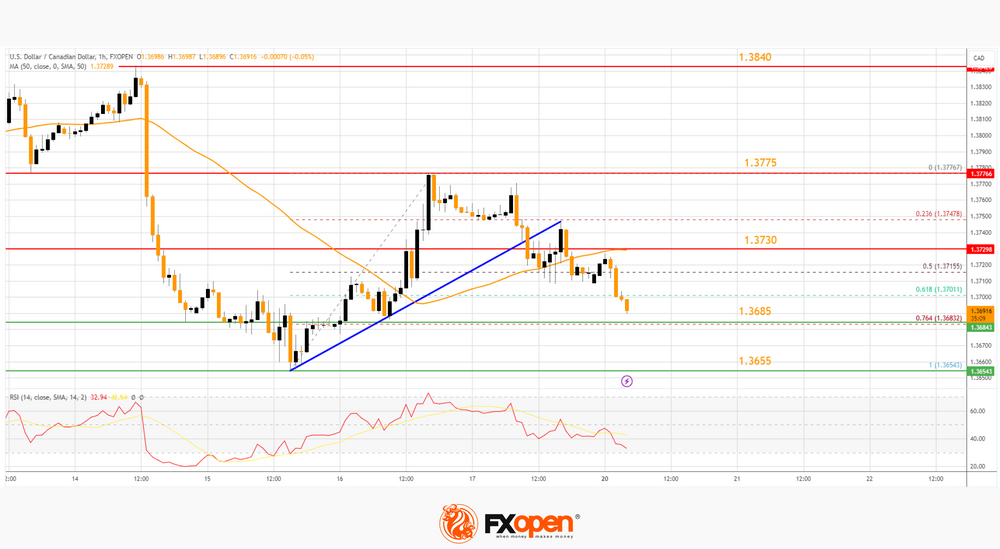
There was also a close below the 50-hour simple moving average and 1.3700. Immediate support is near the 76.4% Fib retracement level of the upward move from the 1.3654 swing low to the 1.3775 high at 1.3685.
The first major support is near 1.3665. A close below the 1.3665 level might trigger a strong decline. In the stated case, USD/CAD might test 1.3620. Any more losses may possibly open the doors for a drop toward the 1.3550 support.
If there is a fresh increase, the pair could face resistance near the 50-hour simple moving average at 1.3730. The next key resistance on the USD/CAD chart is 1.3775. If there is an upside break above 1.3775, the pair could rise toward the 1.3840 resistance.
The next major resistance is near the 1.3880 level, above which it could rise steadily toward the 1.3950 resistance zone.
This article represents the opinion of the Companies operating under the FXOpen brand only. It is not to be construed as an offer, solicitation, or recommendation with respect to products and services provided by the Companies operating under the FXOpen brand, nor is it to be considered financial advice.
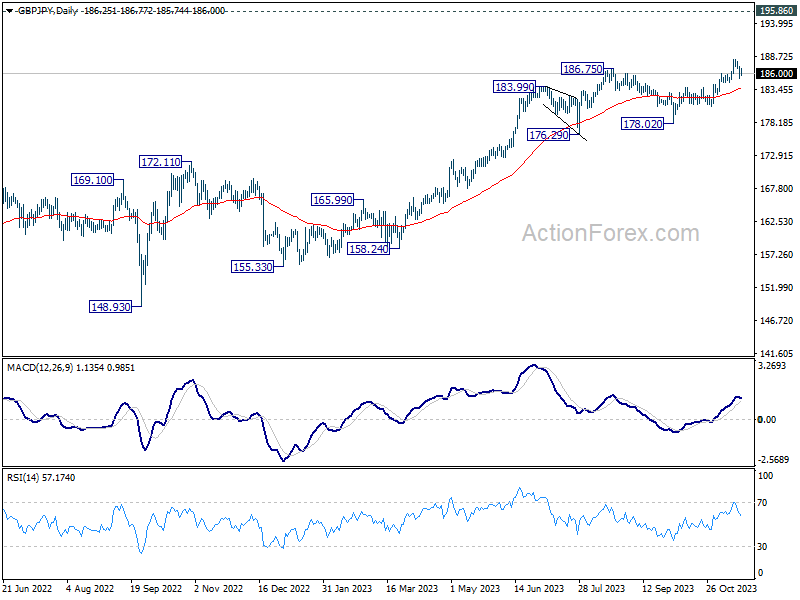
GBP/JPY Daily Outlook
Daily Pivots: (S1) 185.38; (P) 186.32; (R1) 187.31; More...
Intraday bias in GBP/JPY stays neutral at this point, and more consolidations would be seen below 188.26. Another rally will remain in favor as long as 183.79 support turned resistance holds. Break of 188.26 will resume larger up trend.
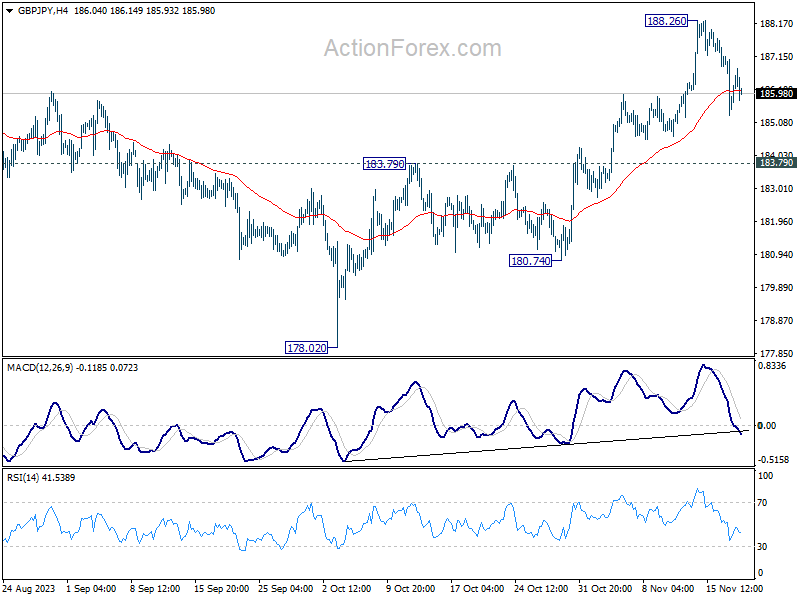
In the bigger picture, as long as 180.74 support holds, larger up trend from 123.94 (202 low) should still be in progress, next target is 195.86 (2015 high). However, firm break of 180.74 will now argue that a medium term top is formed, possibly in bearish divergence condition in D MACD, and bring deeper fall back to 178.02 support.
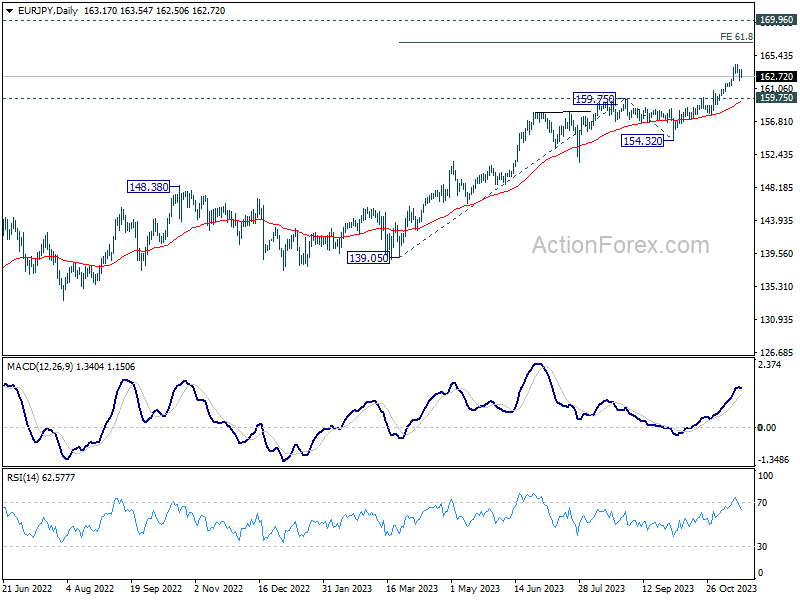
EUR/JPY Daily Outlook
Daily Pivots: (S1) 162.42; (P) 163.03; (R1) 163.89; More....
Intraday bias in EUR/JPY remains neutral as consolidation from 164.29 is extending. Downside of retreat should be contained well above 159.75 resistance turned support to bring another rally. On the upside, break of 164.29 will resume larger up trend to 61.8% projection of 139.05 to 159.75 from 154.32 at 167.11.
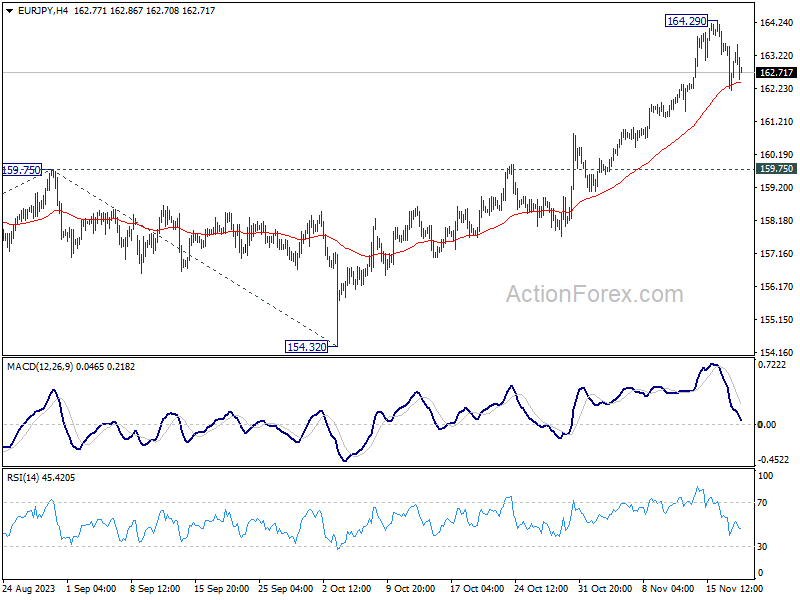
In the bigger picture, rise from 114.42 (2020 low) is in progress. Next target is 169.96 (2008 high). On the downside, break of 159.75 resistance turned support is needed to be the first sign of medium term topping. Otherwise, outlook will remain bullish even in case of deep pullback.
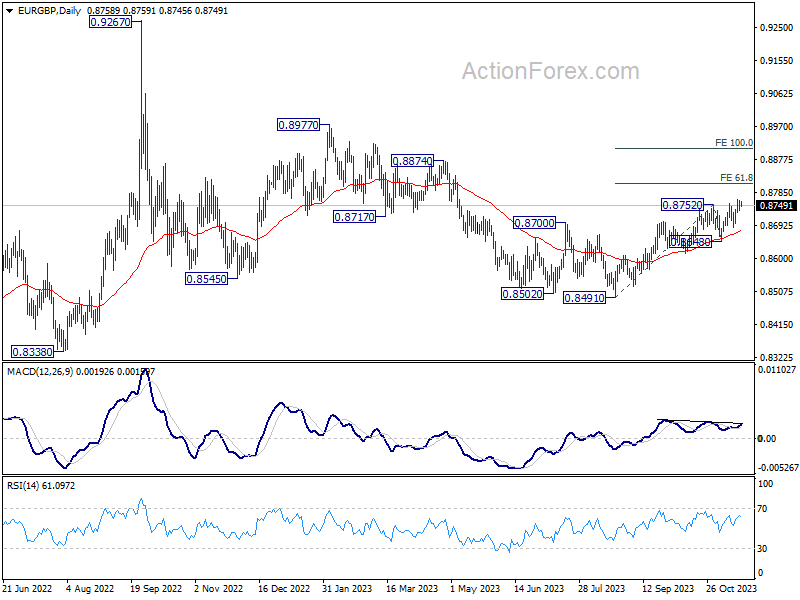
EUR/GBP Daily Outlook
Daily Pivots: (S1) 0.8741; (P) 0.8752; (R1) 0.8768; More....
Intraday bias in EUR/GBP remains mildly on the upside at this point. Current rally should target 61.8% projection of 0.8491 to 0.8752 from 0.8648 at 0.8809. On the downside, break of 0.8687 support is needed to indicate short term topping. Otherwise, further rally remains in favor in case of retreat.
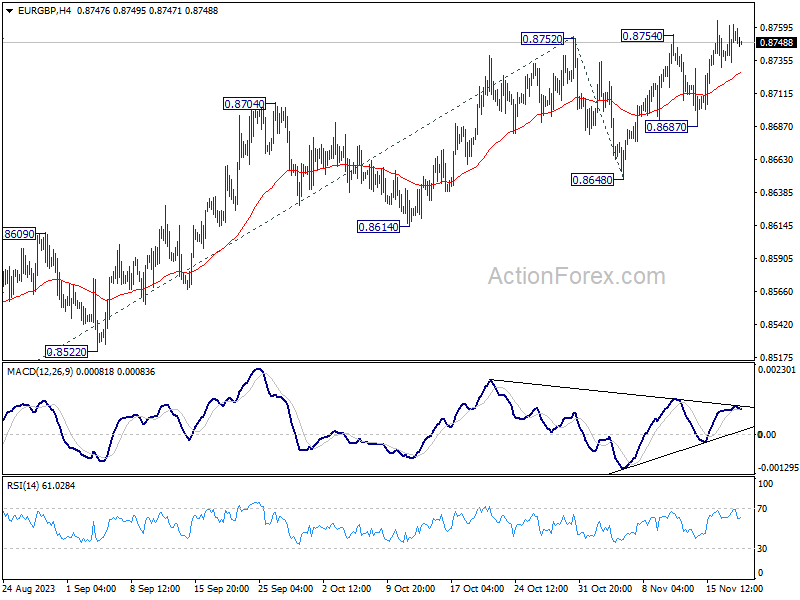
In the bigger picture, down trend from 0.9267 (2022 high) should have completed completed with three down to to 0.8491. Rise from 0.8491 is seen as another leg inside that pattern from 0.9499 (2020 high). Further rally should be seen to 0.8977 resistance and above. This will remain the favored case as long as 0.8648 support holds.
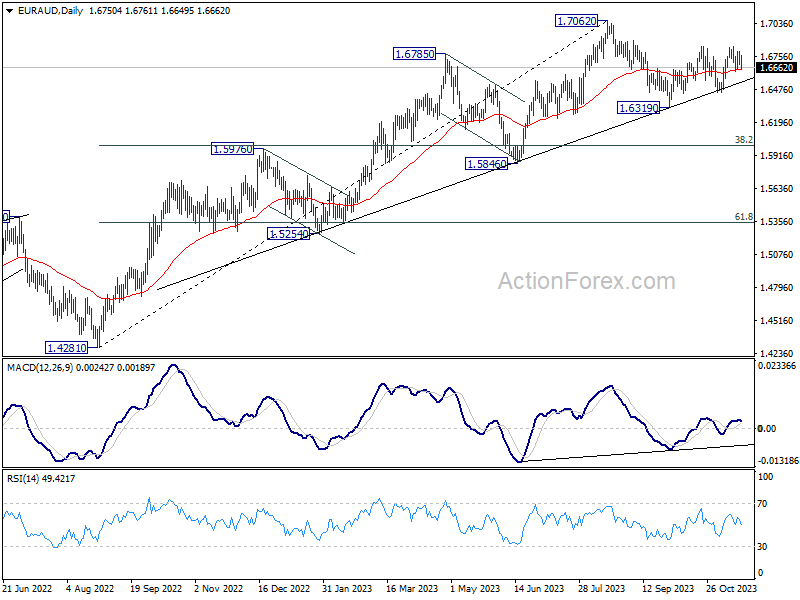
EUR/AUD Daily Outlook
Daily Pivots: (S1) 1.6692; (P) 1.6747; (R1) 1.6806; More...
Intraday bias in EUR/AUD remains neutral for the moment, and some more consolidations could be seen. On the upside, sustained break of 1.6843/4 will resume the rebound from 1.6319 for retesting 1.7062 high next. On the downside, however, below 1.6631 minor support will turn bias back to the downside for 1.6449 support instead.
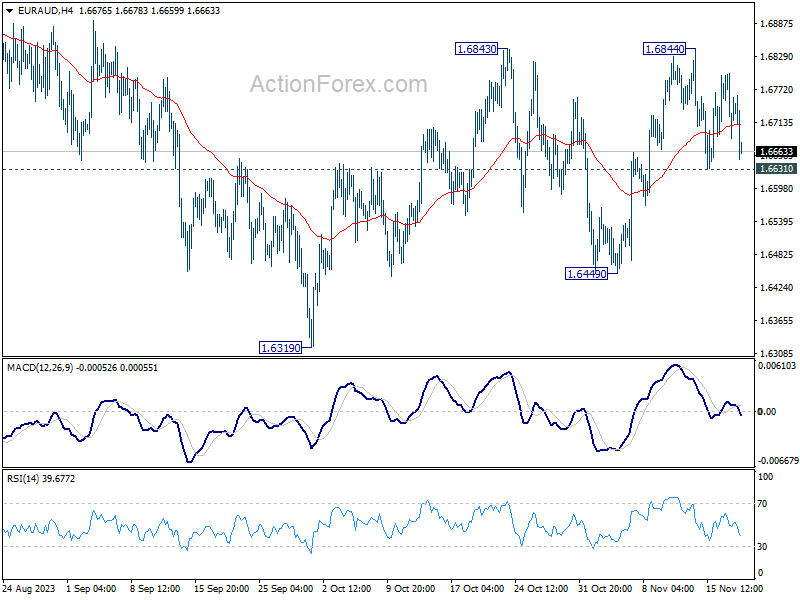
In the bigger picture, while 1.7062 is a medium term top, there is no clear sign of trend reversal as EUR/AUD continues to draw strong support from the medium term trend line. Break of 1.7062 will resume the larger up trend from 1.4281 (2022 low) to 1.7691 fibonacci level. Nevertheless, break of 1.6449 support will argue that deeper correction is underway to 38.2% retracement of 1.4281 to 1.7062 at 1.6000.
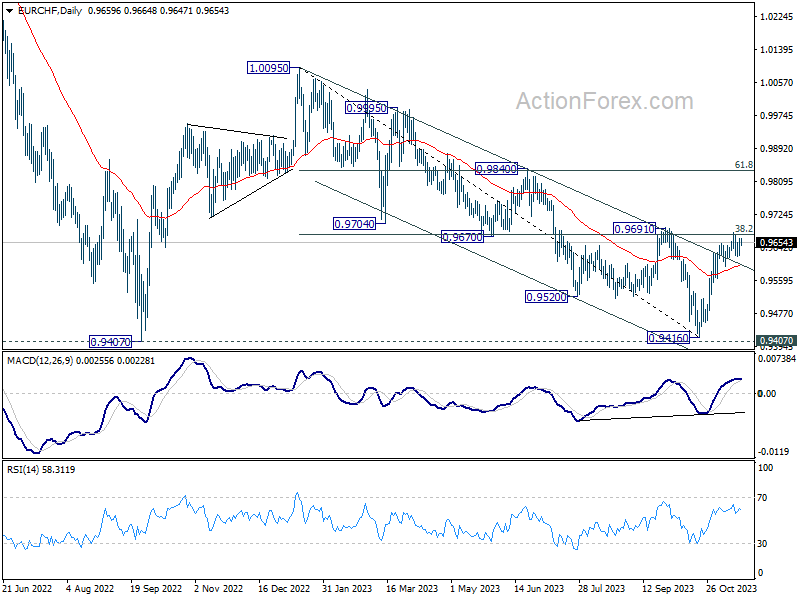
EUR/CHF Daily Outlook
Daily Pivots: (S1) 0.9637; (P) 0.9652; (R1) 0.9680; More...
Range trading continues in EUR/CHF below 0.9678 and intraday bias stays neutral. Further rally is expected as long as 0.9595 support holds. Firm break of 0.9678/91 resistance zone will carry larger bullish implication. Nevertheless, break of 0.9595 support will indicate short term topping, and turn bias back to the downside for deeper pull back.
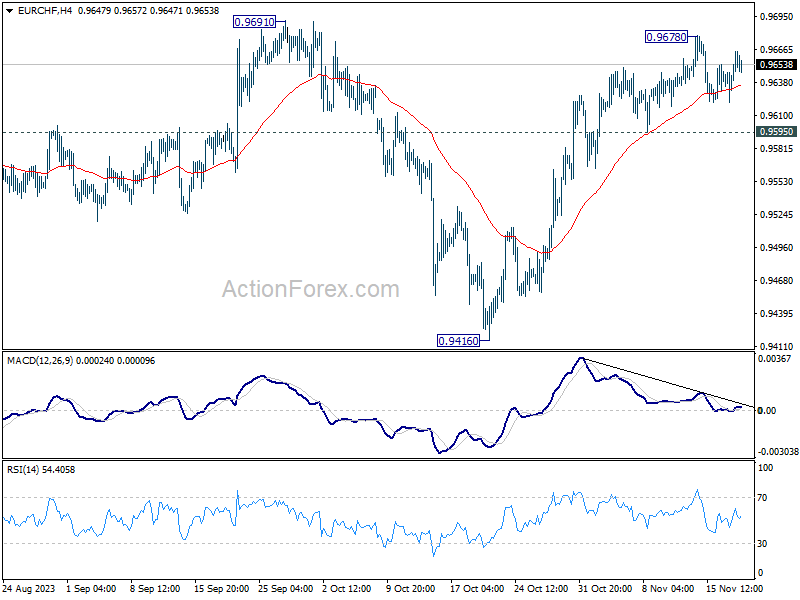
In the bigger picture, fall from 1.0095 (2023 high) might have completed at 0.9416, just ahead of 0.9407 support (2022 low). Sustained break of 0.9691 cluster resistance (38.2% retracement of 1.0095 to 0.9416 at 0.9675) will pave the way to 61.8% retracement at 0.9836 and above. However, rejection by 0.9691 will maintain medium term bearishness for another test on 0.9407 at least.
Trade-Weighted Dollar Remains in Dire Straits
Markets
The Fed’s hold at its November policy meeting ignited a corrective rally in US Treasuries (and core bonds in general). A minor positive US CPI print encouraged investors last Tuesday to add to pivot bets, circling the March 2024 policy meeting as earliest starting point of a rate cutting campaign. Last Friday’s intraday action – failing to close the week above the post-CPI highs with traders throwing the towel on better-than-expected, but second tier housing starts and building permits – suggests consolidation ahead in this holiday-shortened trading week. US markets are closed on Thursday for Thanksgiving with volumes traditionally low on (black) Friday as well. Daily changes on the US yield curve ranged between +4.8 bps (2-yr) and -2.6 bps (30-yr) with the German curve moving in parallel fashion (+1.4 bps at front end and -2.8 bps at the very long end). The (trade-weighted) dollar remains in dire straits even as the core bond rally seems to be losing some steam. DXY extends its drop this morning, falling to 103.70 which represents the lowest level since early September. Key support levels are 103.46 and 102.55 which are respectively 50% and 62% retracement on the greenback’s rally from mid-July to early October. EUR/USD is already past the 50% bar (1.0862) with the 62%-level (1.0960) nearby. Positive EU rating action (see News & Views), bullish risk sentiment on stock markets (China & South Korea doing well this morning) and still some underlying USD-weakness could force a test later on. In line with our consolidation view for core bonds, the 1.0960-level could nevertheless become a tough nut to crack. Today’s eco calendar is extremely thin. We eye tonight’s $16bn 20-yr US bond auction. During this month’s mid-month refinancing operation, the 30-yr Bond auction showed signs of weakness and also triggered an (intraday) market move (lower US Treasuries). Speeches by some ECB members and by BoE governor Bailey (after European close) are wildcards for trading. Bailey’s speech arrives as sterling is gently drifting lower and about to pop back in the broad EUR/GBP 0.8750-0.90 trading range after an extensive stay in the 0.85-0.8750 area.
News & Views
Rating agency Moody’s affirmed Italy’s rating at Baa3 and raised the outlook from negative to stable. The latter reflects a stabilization of prospects for the country's economic strength, supported by the implementation of the post-pandemic recovery plan (NRRP), the health of its banking sector and the government's debt dynamics. Growth in the next few years lowers the risk of a material and rapid deterioration in the fiscal situation. That said, fiscal strength remains constrained with the debt ratio expected at a high level in coming years of 140%. And this is highly sensitive to assumptions on growth, interest rates and the fiscal balance. Even a small deviation from the baseline could place the debt burden on more pronounced upward trajectory. Debt has an average maturity of around 7 years but because of high annual borrowing needs its affordability will still weaken relatively quickly. Moody’s does take into account the ECB’s TPI, which limits sovereign exposure to liquidity stress. Underpinning the lowest possible investment grade is the country’s large, diversified and competitive manufacturing sector, high household wealth and low private sector indebtedness. Institutional gaps however will probably prevent the country from fully profiting (through increased potential growth) from the what it calls a once-in-a-generation NRRP opportunity.
Portugal’s rating was bumped higher two notches by Moody’s from Baa2 to A3 with a stable outlook. The decision “reflects the sustained positive credit effects over the medium term of a series of economic and fiscal reforms, private sector deleveraging and ongoing strengthening of the banking sector.” Over the next few years and unlike in other ageing countries, Moody's expects the negative impact of demographic trends on potential growth to be mitigated by sustained net migration, higher participation rates and an increase in labor productivity growth. Solid growth and broadly balanced budgets mean that the - although elevated - debt burden will continue to fall (to +/-100% in 2024, lowest since 2010) at one of the fastest paces among advanced economies. More positive trends in economic and fiscal strength than currently expected are balanced against recent evidence of political risks. With the latter, the agency refers to the recent resignation of PM over corruption investigations.
Oil Gains on OPEC Speculation
The previous week marked a significant shift in market sentiment regarding Federal Reserve (Fed) rate hike expectations. The latest Consumer Price Index (CPI) update revealed a slower-than-anticipated inflation rate in the US, coupled with politicians averting a government shutdown. Despite these factors, the US 2-year yield tested 4.80% for the fourth time, while the 10-year yield briefly dipped below 4.40%. The term premium on the US 10-year paper, which surged to 50 basis points the previous month due to hawkish Fed expectations, political risks, and increased government bond supply, has nearly vanished amid the recent rally. This suggests that, at current levels, investors may require renewed conviction to sustain buying momentum.
Attention is now focused on the closely watched US 20-year bond auction, considering the recent weakness in the 10 and 30-year bond auctions. The outcome may influence a potential rebound or continuation of the rally in US bond yields. The minutes from the latest Federal Reserve (Fed) policy meeting, set for release tomorrow, will likely emphasize that the Fed's decision to pause rate hikes was influenced by the rise in US long-term yields in October. With the subsequent decrease in yields, interpretations may vary, either signaling Fed caution due to falling yields or a belief that inflationary pressures have subsided, leading to a halt in rate hikes.
All eyes on Nvidia
The S&P500 closed above the psychological level of 4500, and the Nasdaq 100 approached its summer peak ahead of Nvidia's earnings announcement. Nvidia has experienced substantial gains with expectations of a significant revenue increase in Q3. The stock price has been up 240+% since the beginning of the year, and 350+% since October 2022. The company predicted that its sales would soar to $16bn last quarter. A wide gap between demand and supply should keep Nvidia on track for extended growth. But any deviation from optimistic projections could trigger heavy profit-taking.
Elsewhere, US stock optimism extends globally, with the European Stoxx testing the 200-DMA resistance and the Japanese Nikkei reaching a 33-year high. Japan's supportive central bank, a cheap yen, and strong company earnings contribute to investor interest.
FX and energy
The USDJPY fell below the 50-DMA and the EURJPY retreated from a record high. There is one reasonable direction for the yen at the current levels: a positive correction. But no one knows when the Bank of Japan’s (BoJ) astonishing push back against normalizing policy will end. Japan is expected to announce a rise in inflation to 3% this Friday.
The EURUSD extends gains above 1.09 this morning on the back of a broad-based USD selloff. The next target for euro bulls is 1.10, contingent on sustained USD weakness. However, the US dollar index flirts with oversold conditions and tests critical 200-DMA support, indicating a potential pause in the ongoing dollar selloff absent fresh news.
In energy, US crude recovers as speculation that OPEC could extend production cuts throws a floor under the recent selloff. The next OPEC meeting is scheduled for November 26th and Saudi considers doubling its 1mbpd supply cut. It’s a risky move and it could go both ways. Oil prices are trending lower today because of a weakening global outlook. Therefore, whether this move – in hurry -attracts buyers or exacerbates the current global economic concerns remains to be seen. Monitoring this week's price action will provide insights into whether to sell a potential post-OPEC rally or seize opportunities on a bullish trend. If the excitement regarding Saudi doubling its supply cuts can’t push the price of a barrel above $80-81pb range, it’s probably better to sell the tops.