

Sample Category Title
EUR/GBP Weekly Outlook
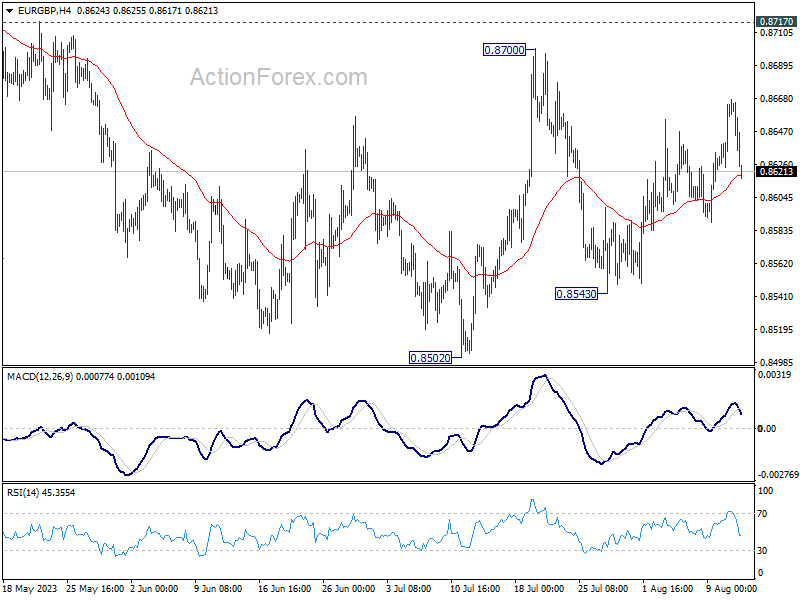
EUR/GBP stayed in sideway trading last week and outlook is unchanged. Initial bias remains neutral this week first. On the downside, below 0.8543 will target a test on 0.8502 low. Decisive break there will resume larger decline from 0.8977. On the upside firm break of 0.8717 resistance will suggest larger reversal and target 0.8874 resistance next.
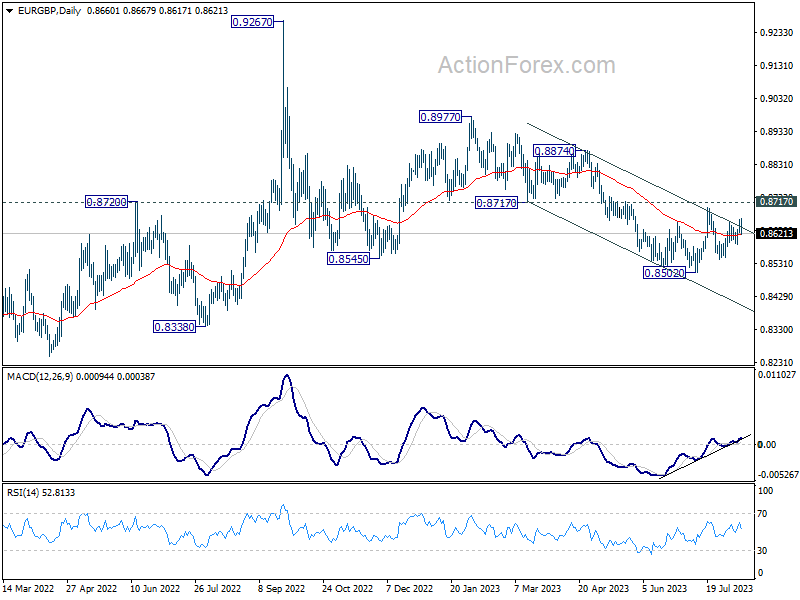
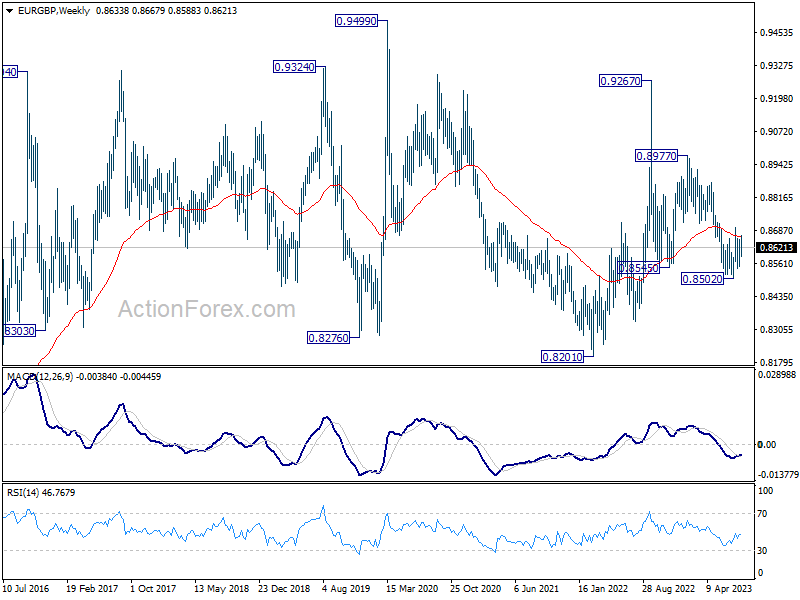
In the bigger picture, the down trend from 0.9267 (2022 high) is seen as part of the long term range pattern from 0.9499 (2020 high). Firm break of 0.8717 support turned resistance will argue that it has completed with three waves down to 0.8502. Further break of 0.8977 will bring retest of 0.9267 high. Nevertheless, rejection by 0.8717, followed by break of 0.8502 will resume the decline towards 0.8201 (2022 low).
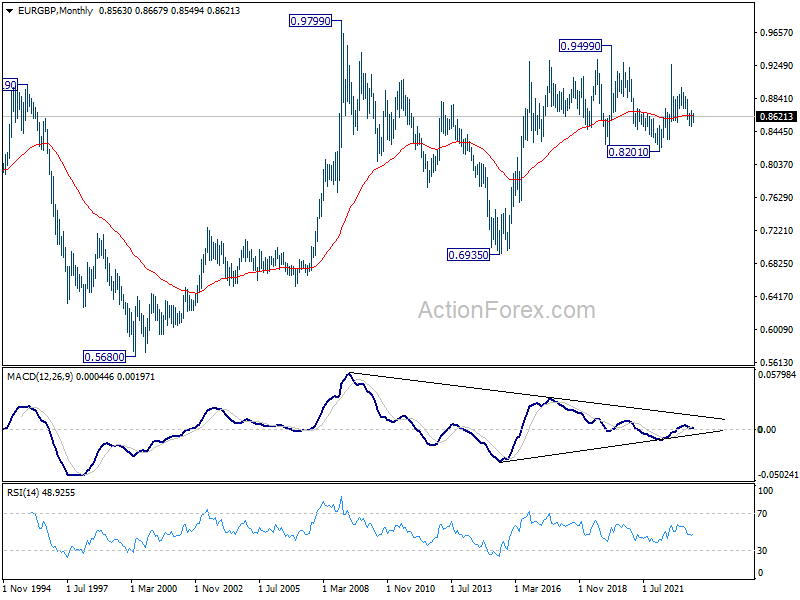
In the long term picture, long term range pattern is extending. But rise from 0.6935 (2015 low) is expected to resume at a later stage, to 0.9799 (2009 high).
EUR/AUD Weekly Outlook
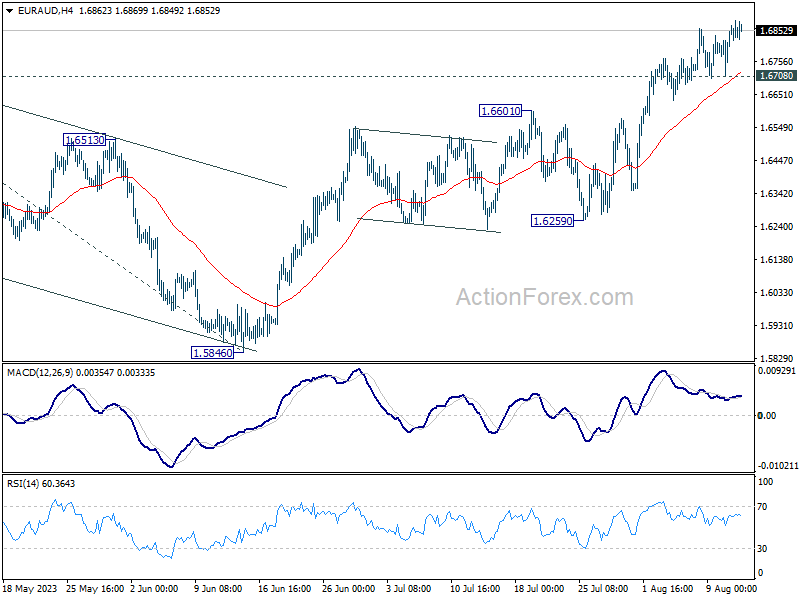
EUR/AUD's break of 1.6785 resistance last week confirmed resumption of whole up trend from 1.4281. Initial bias remains on the upside this week. Next target is 1.7377 projection level next. On the downside, below 1.6708 minor support will turn bias neutral and bring consolidations again first.
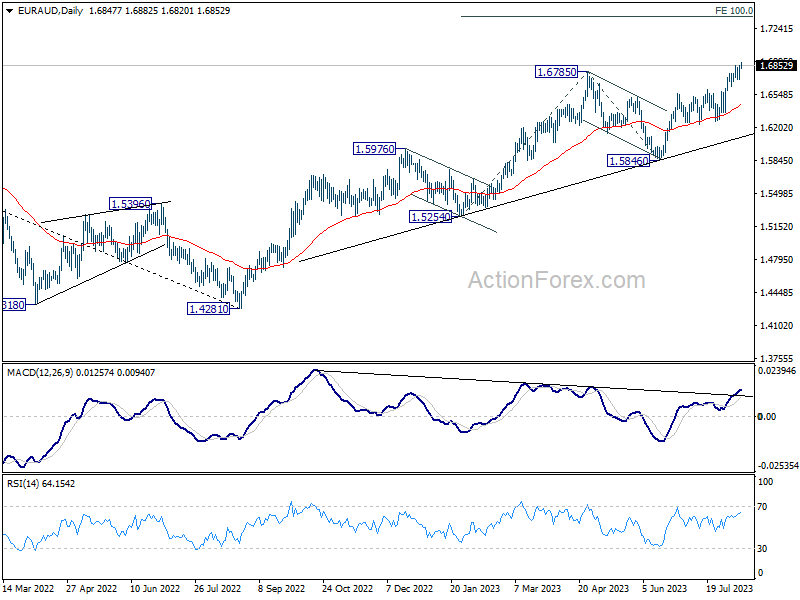
In the bigger picture, the rise from 1.4281 (2022 low) is in progress. Next target is 100% projection of 1.5254 to 1.6785 from 1.5846 at 1.7377. For now, outlook will stay bullish as long as 1.5846 support holds, even in case of another pull back.
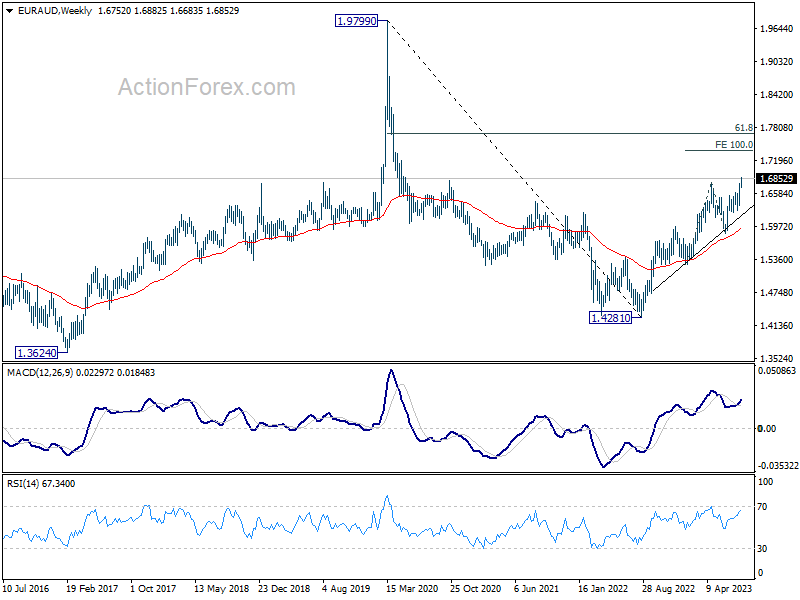
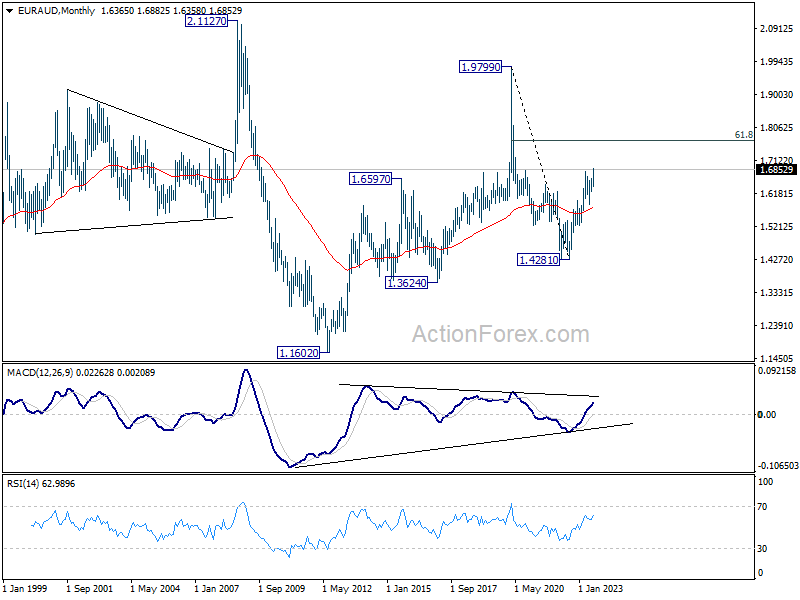
In the longer term picture, it's still early to decide if rise from 1.4281 is resuming whole up trend from 1.1602 (2012 low). But in either case, further rally is in favor as long as 1.5846 support holds. Next target is 61.8% retracement of 1.9799 to 1.4281 at 1.7691.
EUR/CHF Weekly Outlook
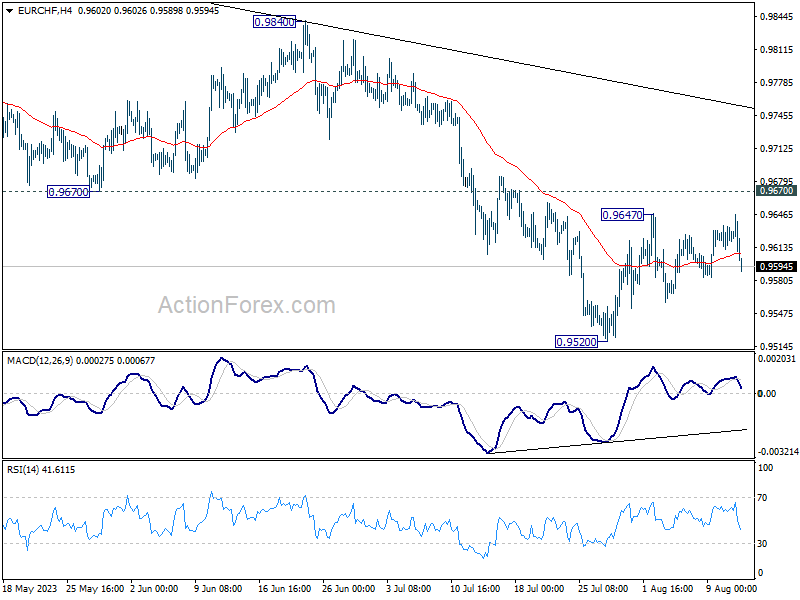
Range trading continued in EUR/CHF last week and outlook is unchanged. Initial bias remains neutral this week. On the upside, break of 0.9647 will resume the rebound from 0.9520. Further sustained break of 0.9670 will be the first sign of bullish reversal and target 0.9840 resistance for confirmation. On the downside, break of 0.9520 will resume the whole fall from 1.0095 towards 0.9407 low.
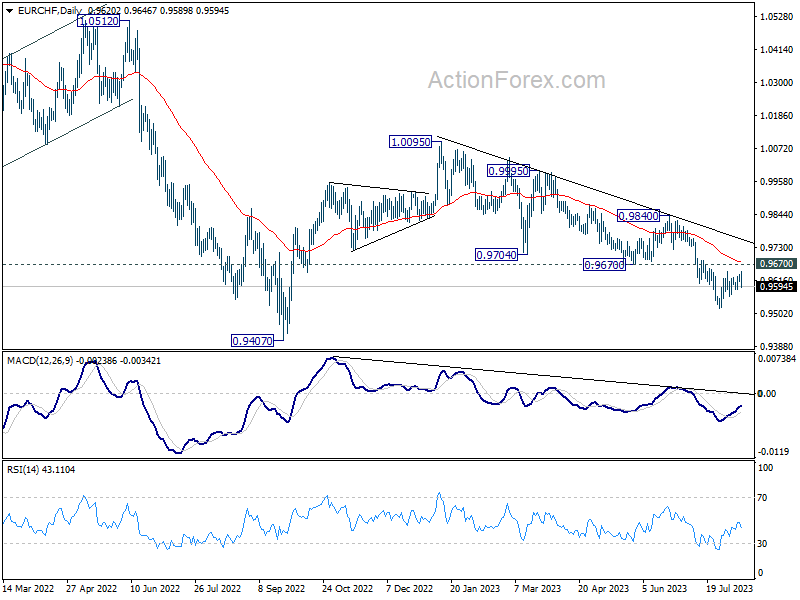
In the bigger picture, medium term outlook is staying bearish as the pair is capped well below falling 55 W EMA (now at 0.9859). Down trend from 1.2004 (2018 high) is in favor to continue. Sustained break of 0.9407 will target 61.8% projection of 1.1149 to 0.9407 from 1.0095 at 0.9018. For now, this will remain the favored case as long as 0.9840 resistance holds, in case of strong rebound.
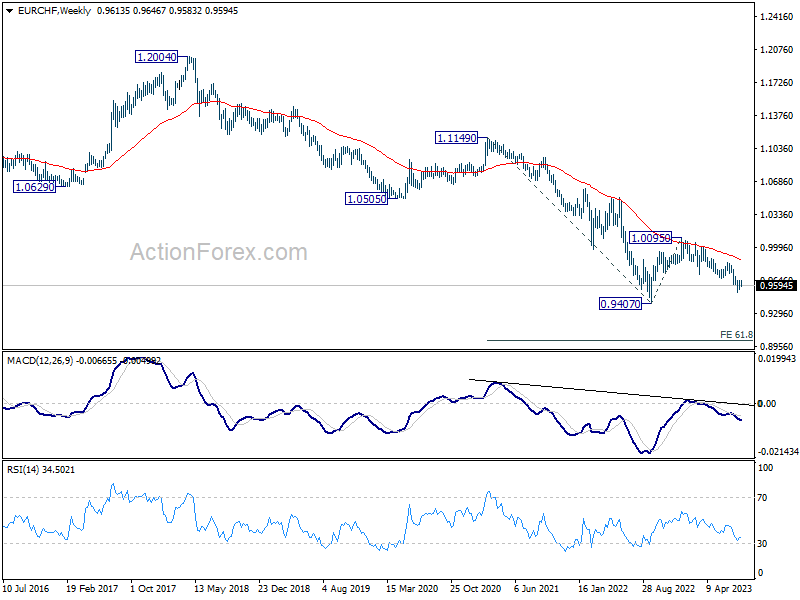
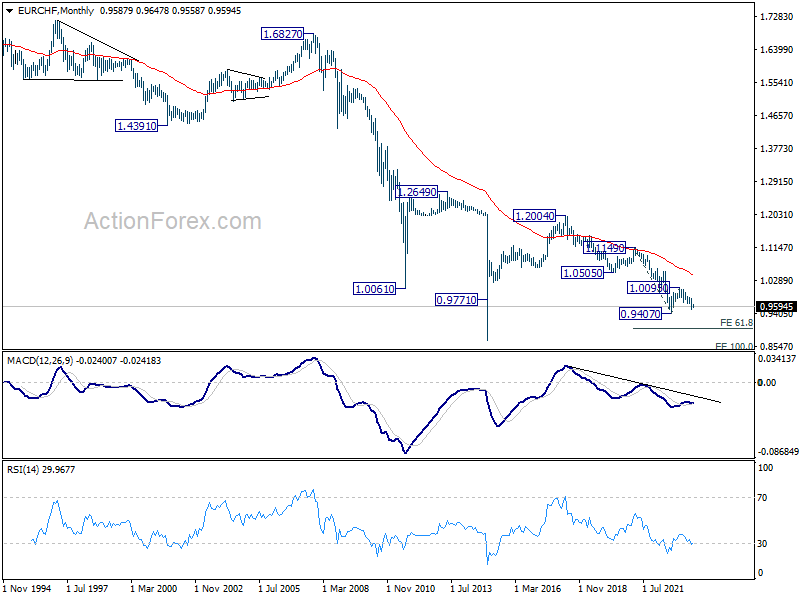
In the long term picture, outlook remains bearish as it's staying well below 55 M EMA (now at 1.0422). Break of 1.00095 resistance is needed to be the first sign of bottoming, or the multi-decade down trend is expected to continue.
Weekly Economic & Financial Commentary: Inflation Continues to Ease
Summary
United States: Inflation Continues to Ease
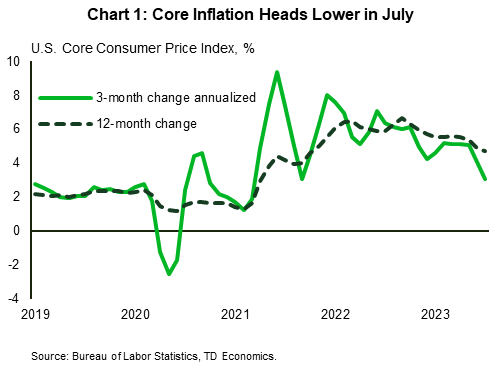
- Price pressures in the U.S. economy continue to subside. During July, both the headline and core Consumer Price Index (CPI) rose 0.2%. On a year-over-year basis, the core CPI was up 4.7% in July. Recent signs have been more encouraging, with core CPI running at a 3.1% three-month annualized pace. Furthermore, July's Producer Price Index (PPI) and NFIB Small Business Optimism Index also suggest that underlying inflation is dissipating.
- Next week: Retail Sales (Tue.), Housing Starts (Wed.), Industrial Production (Wed.)
International: U.K. Economy Shows Surprising Resilience
- The U.K. economy showed some surprising resilience in Q2, as Q2 GDP rose 0.2% quarter-over-quarter. The details showed relatively solid domestic demand, as consumer spending rose 0.7% and business investment rose 3.4%. That said, given the prior increase in inflation and interest rates over the past several quarters, we still anticipate the U.K. falling into a mild recession later this year.
- Next week: Japan GDP (Tue.), China Retail Sales & Industrial Output (Tue.), Canada CPI (Tue.)
Interest Rate Watch: Quantitative Tightening Keeps Rolling Along
- In May 2022, the FOMC announced plans to begin reducing the size of its balance sheet. At the time, the Fed's balance sheet had ballooned from roughly $4.2 trillion before the pandemic to nearly $9 trillion. Since then, the Fed's total security holdings have fallen by $900 billion amid quantitative tightening (QT), the phrase often used to describe the Fed's security runoff program.
Credit Market Insights: Household Debt Hits an All-Time High
- The Federal Reserve Bank of New York released its second quarter Household Debt and Credit Report this week, which indicated total debt balances increased by $16 billion in Q2. The uptick led household debt to notch an all-time high of just over $17 trillion.
Topic of the Week: Workforce Evolution in the World's Factory
- Known as the “world’s factory,” China has been a manufacturing powerhouse since the late 1990s. However, the ultra-cheap labor costs that facilitated China's role as a manufacturing hub are fading as rising labor costs and demographic challenges are putting pressure on China's manufacturers.
The Weekly Bottom Line: Word of the Week is Inflation
U.S. Highlights
- The U.S. economy had good news on the inflation front this week, as core inflation ticked down in July, even as unfavorable base-effects led to a marginal uptick in the headline measure.
- Some Fed speakers this week maintained a hawkish stance, suggesting September’s meeting is an open debate. Incoming inflation and labor market data will play a key role in the decision.
- Small businesses also showed signs that inflation is easing, with fewer of them raising or planning to raise prices.
Canadian Highlights
- Canada’s trade balance widened again in June as export activity slowed. Net exports are shaping up to be a net drag on Q2-2023 GDP growth, unlike previous quarters where trade activity was a tailwind for the economy.
- Next week’s inflation data for July could see prices tick up higher on the effects of elevated food costs and rising energy prices. Core inflation measures may decelerate slightly, but we expect stickiness of these prices gauges to persist until year-end.
- Canadian manufacturing sales and housing sales data will likely register contractions for June and July, respectively, after strong readings in months prior. This highlights the impacts of rate hikes delivered by the Bank of Canada (BoC) over the past couple of months.
U.S. – Word of the Week is Inflation
Since skyrocketing during the pandemic, inflation has been a key feature of the economic landscape. With both consumer and producer price data out this week there was much to add nuance to the scenery. Headline CPI inflation for July was 3.2% year-on-year (y/y), up 0.2 ppts from the previous month. The slight uptick was largely due to base-effects stemming from a notable decline in July 2022 energy prices. The monthly figure was more muted with a 0.2% increase, in line with expectations. Core prices also rose 0.2% month-on-month (m/m) contributing to a deceleration of annual core inflation from 4.8% in June to 4.7% (Chart 1).
Producer prices on the other hand rose slightly more than expected in July (0.3% m/m) due to a pickup in services inflation (0.5% m/m). The uptick in producer prices, which eventually feeds through to consumer prices, illustrates that it may still be too early for the Fed to let its guard down. Nonetheless, these inflation numbers combined with slowing labor market momentum do leave a cloud of doubt about whether the Fed will be raising rates again this year.
Comments from some voting members of the Federal Open Market Committee (FOMC) also suggest that a hike at the September meeting is not a foregone conclusion. NY Fed president Williams noted that both inflation and labor data are generally heading in the right direction, but both are still not quite there yet. He views the question of additional rate increases as still being “open”. Philadelphia Fed President Harker, contrary to his usual hawkish bent, noted that the Fed may be at the point where it can hold rates steady for a while. On the other hand, Fed Governor Bowman is of the view that additional hikes will likely be needed to tame inflation.
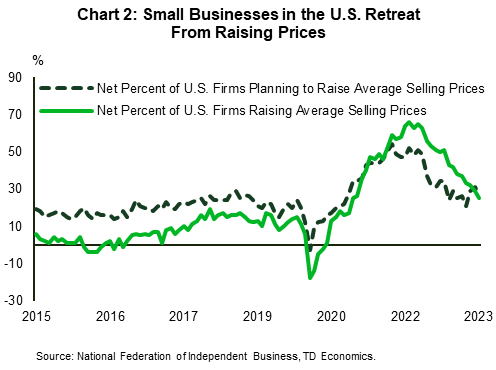
Data from the small business sector also supports the notion that price pressures are receding. The National Federation of Independent Business survey found that only about one-quarter of small business owners raised prices over the past three months, the lowest reading since January 2021 (Chart 2). Likewise, the share of owners planning to raise prices in the near-term retreated by 4 points following two consecutive monthly increases. Additionally, businesses reporting inflation as their single most important problem declined by 3 points to 21% in July. Overall, the survey suggests that price pressures are moderating, despite a still tight labor market.
One thing that could throw a kink in the downward trajectory of inflation, is rising energy prices in the face of crude oil production cuts by Saudi Arabia and Russia. While the Fed’s preferred measure excludes energy prices, rising oil prices will indirectly boost prices in most other categories.
Ultimately, core inflation should drift lower in the coming months. However, the battle is far from over given that the job market remains tight and the economy resilient. The risk that lower inflation could lift real wages and thus aggregate demand, thereby triggering another round of rising prices, means the Fed will be paying even closer attention to the evolution of jobs data.
Canada – All Eyes on Inflation Next Week
The Canadian economy booked some vacation time over the holiday-shortened week. Data updates were scarce, featuring only June's international trade figures. Financial markets were also a bit quiet, with the Canadian dollar mildly weakened by half a cent to 74.3 cents. Yields finished the week a couple basis points higher across the curve and the TSX rose half a percent on the back of rallying oil prices.
Canada's trade data for June underscored the divergence between resilient domestic demand and cooling global activity. Exports fell for a fourth time in five months, while imports remained elevated. This led to a widening of Canada's trade deficit to levels last seen in late 2020. Now, the net exports tailwind that contributed significantly to growth over the last three quarters appears to be shifting course (Chart 1). Trade activity will likely act as a net drag on second quarter GDP growth. Into Q3, trade volumes will be impacted by the B.C. port strike and Nova Scotia Floods.
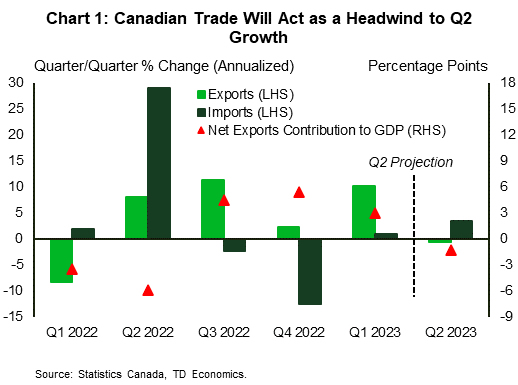
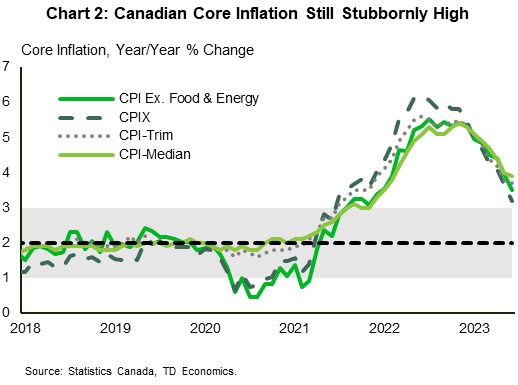
Chart 2 shows the four core measures of Canadian inflation since January 2018. CPI ex. As of June 2023, CPI ex. food and energy is at 3.5% year-on-year (y/y), with a high of 5.5% y/y in July 2022 and a low of 0.5% y/y in August 2020. Current CPIX inflation is at 3.2% y/y, with a high of 6.2% y/y in June 2022 and a low of 0.7% y/y in May 2020. CPI Trim inflation is at 3.7% y/y with a high of 5.6% in June 2022 and a low of 1.6% y/y in August 2020. Lastly, CPI median is at 3.9% y/y with a high of 5.4% y/y in November 2022 and a low of 1.8% y/y in August 2020.
Next week will be headlined by the July inflation data. We expect headline inflation to heat up a bit thanks to higher prices for food and energy. Inflation had decelerated into the upper end of the Bank of Canada's (BoC) control range in June, but the last leg of the inflation fight will prove to be more difficult. Notably, core inflation is still running at an uncomfortable pace, with all core measures clocking in above 3% (Chart 2). Overall price stickiness had forced the BoC to adjust their path back to 2.0% inflation in their July Monetary Policy Report. Policy makers had previously thought this could be achieved by the end of 2024, but this has now been pushed until mid-2025. Incoming data will ultimately inform the BoC's next move, but we believe July's quarter-point hike was the last of the rate hiking campaign that has seen 475-bps of hikes delivered since early last year.
Meanwhile, next week's monthly real manufacturing sales likely took a step back in June after rising for three consecutive months to their highest point since January this year. Canada's manufacturing sector PMI has been in contractionary territory for the months of June and July. Canadian housing sales are also set to contract after preliminary housing numbers pointed to outsized weakness in Toronto's housing market in July. The impact of further rate hikes over the past two months will put continued pressure on home sales, which we expect to decline, on average, in the second half of the year. Lastly, the release of the Senior Loan Officer Survey will inform business-lending practices of Canadian financial institutions over the second quarter.
Week Ahead – A Busy Week Ahead! FOMC Minutes, US Retail Sales, UK Jobs/CPI, RBNZ Decides and Japan GDP/CPI
US
With Wall Street very confident that the Fed won’t be raising rates in September, the focus shifts to how strong is the economy and whether it is too robust and if that could sparking fear that inflation might reaccelerate.
The economic data starts on Tuesday with a July retail sales report that should show spending picked up from a month ago, which was boosted by Amazon’s Prime Day. Also on Tuesday is the Empire manufacturing report which should show August activity remains weak and the release of July’s import price index, which should show a decent rebound, but that comes after prices have steadily plunged since the summer. On Wednesday, housing data should show both starts and building permits rebounded in July, alongside improving industrial production data. Thursday focuses on jobless claims and whether the labor market continues to cool and if the Philly Fed business outlook remains downbeat.
On Wednesday, The FOMC minutes for the July 26th policy decision will be released, but that might not be as market moving as Fed swaps are very confident that the Fed will keep rates on hold. Fed’s Kashkari has the lone scheduled appearance on Tuesday. His last comments came a month ago, emphasizing that entrenched inflation could prompt the Fed to hike further.
Earnings for the week include Home Depot, Cava Group, Target, Cisco, Walmart, Applied Materials, and Deere & Co.
Eurozone
There’s no shortage of economic releases next week but there isn’t one that stands out as a potential game-changer. The only one that has the potential to fill that role is the final HICP inflation numbers on Friday and history would suggest the numbers tend to fall largely in line with expectations which is why it isn’t considered tier one. That aside we have some surveys on Tuesday which will be of interest and GDP and employment data on Wednesday.
UK
Next week is the big data drop for the UK, with the jobs report on Tuesday, inflation on Wednesday and retail sales on Friday. There’s no doubt about which the headline act will be considering the rare and welcome surprise we were treated to last month. A below forecast reading on both the headline and core inflation readings came as a great relief and a repeat performance could see interest rate expectations pared back further. That said, there’s still a long way to go and as it stands, markets are positioned for rates not to fall in the UK until the third quarter of next year.
Russia
PPI data is released on Wednesday and follows the CPI release last week which was not as bad as feared, although it did tick higher from June. Further evidence of inflationary pressures building could tempt the CBR to raise interest rates again.
South Africa
A few data releases of note next week with unemployment on Tuesday and retail sales on Wednesday. The central bank has raised rates aggressively over the last two years which will take a toll on the economy and may show up in the figures next week. The tightening cycle may now be over but the pain may still be to come.
Turkey
No major economic releases or events next week.
Switzerland
Another quiet week with PPI data released on Tuesday the only notable event.
China
A lot of attention will remain on Country Garden, as the struggling property firm is at risk of default. It is unclear what billionaire Chair Yang Yuiyan will be willing to do.
Despite some recent soft economic data points, the PBOC might keep its one-year rate steady at 2.65% for a second straight month, following June’s 10 basis point cut. This is likely to be a tactical pause that paves the way for a September cut. Also on Tuesday, three key data releases will be watched: July industrial production will likely show activity ticked lower from a month ago to 4.3%, Retail sales is expected to increase from 3.1% to 4.0%, and investments in fixed assets are expected to hold steady at 3.8%.
On Tuesday, we will have new home prices for July.
On the earnings front, key results are expected from Tencent, CSL, CNOOC, ITC, JD.com, and HKEX.
India
The key highlight will be the July inflation report, which should so inflation heated back up over 6%. The surge in pricing pressures isn’t expected to persist, but it could keep the pressure on the RBI in delivering hawkish holds.
The release of trade data and wholesale prices are also expected this week.
Australia
The week ahead contains a few key economic reports. On Tuesday, second quarter wage price data is expected to show small increases both on a quarterly and annual basis, rising 1.0% and 3.8% respectively. Wednesday contains the release of the Westpac Leading index and Thursday has the employment report. The July employment change is expected to see softer job growth at 15,000, while the unemployment rate ticks higher to 3.6%.
New Zealand
The RBNZ is expected to keep rates steady at 5.50%, which should be the peak in this tightening cycle. Since the last policy meeting, inflation has come down, unemployment has risen, and consumer confidence has further weakened.
Japan
This will be a huge week for data in Japan as we get key GDP and inflation. Tuesday’s preliminary Q2 GDP reading should show growth improved, but mainly driven by exports and not domestic demand. The Q2 Annualized GDP q/q reading should improve from 2.7% to 3.2%, while the GDP deflator surges from 2.0% to 3.8%. Unless domestic consumption improves, any pivot from their loose monetary policy stance seems distant.
The national inflation report should show core inflation cooled in July, dropping from 3.3% to 3.1%. Upside surprises however could occur, so this release could be the headline event of the week.
The upcoming week also includes industrial production data, nationwide department sales, Core machine orders, and Tertiary industry index.
Singapore
The only key data will be the non-oil domestic exports for the month of July.
Saturday, Aug. 12
Economic Data/Events:
- Taiwanese presidential frontrunner Lai to visit US on his way to Paraguay inauguration
Sunday, Aug. 13
Economic Data/Events:
- German Chancellor Scholz summer interview on ZDF TV.
Monday, Aug. 14
Economic Data/Events:
- India wholesale prices, CPI, trade
- Finland CPI
- Poland CPI
- Arendalsuka, largest political gathering in Norway
- BOC releases Senior Loan Officer Survey.
Tuesday, Aug. 15
Economic Data/Events:
- US retail sales, empire manufacturing, business inventories, cross-border investment,
- Australia wage prices
- Canada CPI, existing home sales
- China medium-term lending, retail sales, industrial production, fixed-asset investment, FX net settlement
- Germany ZEW survey expectations
- Japan GDP, industrial production
- Mexico international reserves
- South Africa unemployment
- UK jobless claims, unemployment
- Sweden CPI
- Reserve Bank of Australia policy minutes.
- Federal Reserve Bank of Minneapolis President Neel Kashkari speaks.
Wednesday, Aug. 16
Economic Data/Events:
- US FOMC minutes, housing starts, industrial production
- Canada housing starts
- China property prices
- Eurozone industrial production, GDP
- New Zealand (RBNZ) rate decision: expected to keep rates on hold at 5.50%
- South Africa retail sales
- UK CPI
- Norway’s $1.4 trillion sovereign wealth fund publishes results.
- Thailand Constitutional Court set to review election dispute.
- Germany Scholz at business lobby congress in Duesseldorf.
Thursday, Aug. 17
Economic Data/Events:
- US initial jobless claims, US Conf. Board leading index
- Australia unemployment
- Japan core machine orders, tertiary industry index, trade
- Norway rate decision: Expected to raise rates by 25bps to 4.00%
- Singapore trade
- Spain trade
- 55th ASEAN Economic Ministers’ Meeting in Indonesia.
- Germany Chancellor Scholz hosts Danish Prime Minister Mette Frederiksen.
Friday, Aug. 18
Economic Data/Events:
- Japan CPI
- Taiwan GDP
- Eurozone CPI final July reading could confirm first drop since January
- US President Biden hosts South Korean President Yoon Suk Yeol and Japanese PM Kishida
- Germany Chancellor Scholz, Austrian Chancellor Nehammer hold news conference
Sovereign Rating Updates:
– Netherlands (Fitch)
– Switzerland (Moody’s)
AUDUSD Wave Analysis
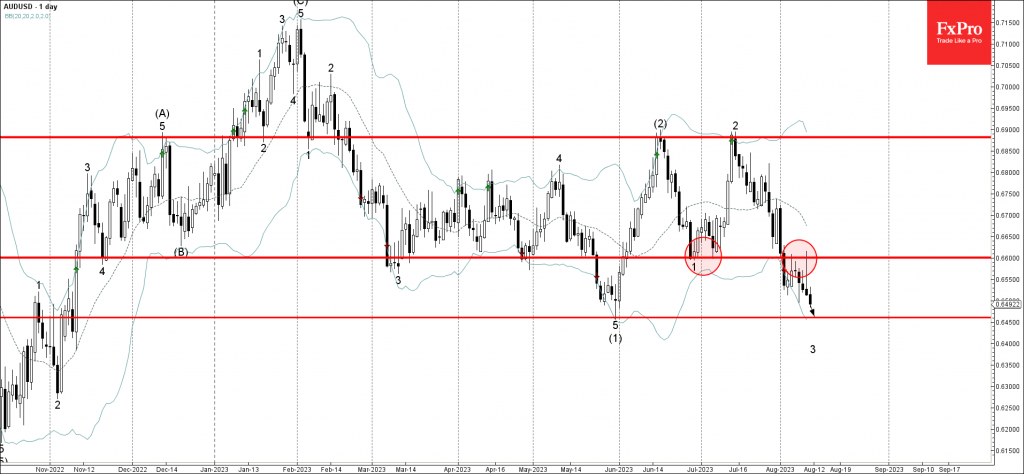
- AUDUSD reversed from resistance level 0.6600
- Likely to fall to support level 0.6460
AUDUSD currency pair recently reversed down twice from the pivotal resistance level 0.6600 (former strong support from June and July).
The downward reversal from the resistance level 0.6600 created the daily candlesticks reversal pattern Shooting Star.
Given the continued dollar gains, AUDUSD can be expected to fall further toward the next support level 0.6460 (former multi-month low from April).
EURGBP Wave Analysis
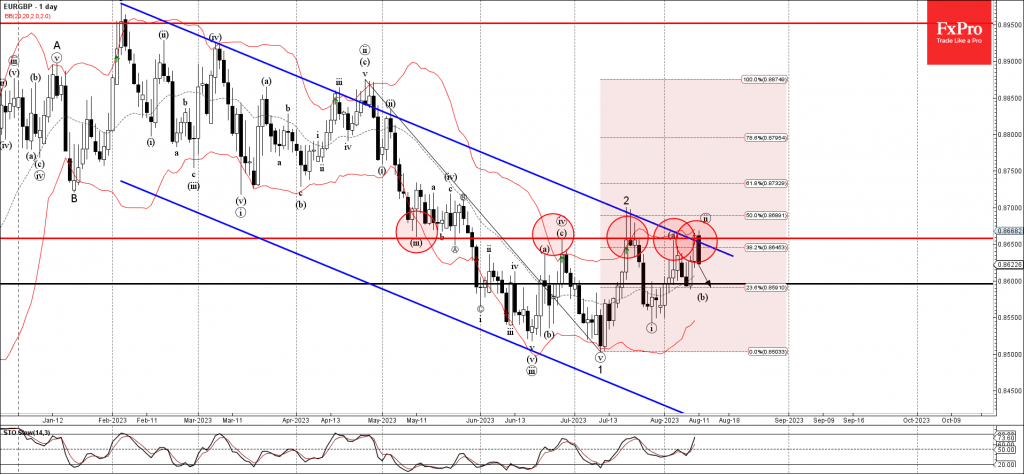
- EURGBP reversed from resistance level 0.8660
- Likely to fall to support level 0.8600
EURGBP currency pair recently reversed down from the key resistance level 0.8660 (former monthly low from May, which has been reversing the price from the end of June).
The resistance level 0.8660 was strengthened by the resistance trendline of the daily down channel from February, upper daily Bollinger Band and by the 38.2% Fibonacci correction of the downward impulse from April.
Given the clear daily downtrend, EURGBP can be expected to fall further toward the next support level 0.8600.
Summary 8/14 – 8/18
Monday, Aug 14, 2023
| GMT | Ccy | Events | Consensus | Previous |
|---|---|---|---|---|
| 22:30 | NZD | Business NZ PSI Jul | 50.1 | |
| 06:00 | EUR | Germany Wholesale Price Index M/M Jul | -0.20% | |
| 23:50 | JPY | GDP Q/Q Q2 P | 0.70% | 0.70% |
| 23:50 | JPY | GDP Deflator Y/Y Q2 P | 2% | 2% |
| GMT | Ccy | Events | |
|---|---|---|---|
| 22:30 | NZD | Business NZ PSI Jul | |
| Forecast: | Previous: 50.1 | ||
| 06:00 | EUR | Germany Wholesale Price Index M/M Jul | |
| Forecast: | Previous: -0.20% | ||
| 23:50 | JPY | GDP Q/Q Q2 P | |
| Forecast: 0.70% | Previous: 0.70% | ||
| 23:50 | JPY | GDP Deflator Y/Y Q2 P | |
| Forecast: 2% | Previous: 2% | ||
Tuesday, Aug 15, 2023
| GMT | Ccy | Events | Consensus | Previous |
|---|---|---|---|---|
| 01:30 | AUD | RBA Meeting Minutes | ||
| 01:30 | AUD | Wage Price Index Q/Q Q2 | 1.00% | 0.80% |
| 02:00 | CNY | Industrial Production Y/Y Jul | 4.30% | 4.40% |
| 02:00 | CNY | Retail Sales Y/Y Jul | 4.20% | 3.10% |
| 02:00 | CNY | Fixed Asset Investment YTD Y/Y Jul | 3.80% | 3.80% |
| 04:30 | JPY | Industrial Production M/M Jun F | 2.00% | 2.00% |
| 06:00 | GBP | Claimant Count Change Jul | 25.7K | |
| 06:00 | GBP | ILO Unemployment Rate (3M) Jun | 4.00% | 4.00% |
| 06:00 | GBP | Average Earnings Including Bonus 3M/Y Jun | 6.90% | |
| 06:00 | GBP | Average Earnings Excluding Bonus 3M/Y Jun | 7.40% | 7.30% |
| 06:30 | CHF | Producer and Import Prices M/M Jul | 0.20% | 0.00% |
| 06:30 | CHF | Producer and Import Prices Y/Y Jul | -0.50% | -0.60% |
| 09:00 | EUR | Germany ZEW Economic Sentiment Aug | -15 | -14.7 |
| 09:00 | EUR | Germany ZEW Current Situation Aug | -63 | -59.5 |
| 09:00 | EUR | Eurozone ZEW Economic Sentiment Aug | -12 | -12.2 |
| 09:00 | EUR | EU Economic Forecasts | ||
| 12:30 | CAD | Manufacturing Sales M/M Jun | -2.10% | 1.20% |
| 12:30 | CAD | CPI M/M Jul | 0.30% | 0.10% |
| 12:30 | CAD | CPI Y/Y Jul | 3.00% | 2.80% |
| 12:30 | CAD | CPI Media Y/Y Jul | 3.70% | 3.90% |
| 12:30 | CAD | CPI Trimmed Y/Y Jul | 3.50% | 3.70% |
| 12:30 | CAD | CPI Common Y/Y Jul | 5.00% | 5.10% |
| 12:30 | USD | Empire State Manufacturing Index Aug | -0.3 | 1.1 |
| 12:30 | USD | Retail Sales M/M Jul | 0.40% | 0.20% |
| 12:30 | USD | Retail Sales ex Autos M/M Jul | 0.40% | 0.20% |
| 12:30 | USD | Import Price Index M/M Jul | 0.20% | -0.20% |
| 14:00 | USD | Business Inventories Jun | 0.20% | 0.20% |
| 14:00 | USD | NAHB Housing Market Index Aug | 56 | 56 |
| GMT | Ccy | Events | |
|---|---|---|---|
| 01:30 | AUD | RBA Meeting Minutes | |
| Forecast: | Previous: | ||
| 01:30 | AUD | Wage Price Index Q/Q Q2 | |
| Forecast: 1.00% | Previous: 0.80% | ||
| 02:00 | CNY | Industrial Production Y/Y Jul | |
| Forecast: 4.30% | Previous: 4.40% | ||
| 02:00 | CNY | Retail Sales Y/Y Jul | |
| Forecast: 4.20% | Previous: 3.10% | ||
| 02:00 | CNY | Fixed Asset Investment YTD Y/Y Jul | |
| Forecast: 3.80% | Previous: 3.80% | ||
| 04:30 | JPY | Industrial Production M/M Jun F | |
| Forecast: 2.00% | Previous: 2.00% | ||
| 06:00 | GBP | Claimant Count Change Jul | |
| Forecast: | Previous: 25.7K | ||
| 06:00 | GBP | ILO Unemployment Rate (3M) Jun | |
| Forecast: 4.00% | Previous: 4.00% | ||
| 06:00 | GBP | Average Earnings Including Bonus 3M/Y Jun | |
| Forecast: | Previous: 6.90% | ||
| 06:00 | GBP | Average Earnings Excluding Bonus 3M/Y Jun | |
| Forecast: 7.40% | Previous: 7.30% | ||
| 06:30 | CHF | Producer and Import Prices M/M Jul | |
| Forecast: 0.20% | Previous: 0.00% | ||
| 06:30 | CHF | Producer and Import Prices Y/Y Jul | |
| Forecast: -0.50% | Previous: -0.60% | ||
| 09:00 | EUR | Germany ZEW Economic Sentiment Aug | |
| Forecast: -15 | Previous: -14.7 | ||
| 09:00 | EUR | Germany ZEW Current Situation Aug | |
| Forecast: -63 | Previous: -59.5 | ||
| 09:00 | EUR | Eurozone ZEW Economic Sentiment Aug | |
| Forecast: -12 | Previous: -12.2 | ||
| 09:00 | EUR | EU Economic Forecasts | |
| Forecast: | Previous: | ||
| 12:30 | CAD | Manufacturing Sales M/M Jun | |
| Forecast: -2.10% | Previous: 1.20% | ||
| 12:30 | CAD | CPI M/M Jul | |
| Forecast: 0.30% | Previous: 0.10% | ||
| 12:30 | CAD | CPI Y/Y Jul | |
| Forecast: 3.00% | Previous: 2.80% | ||
| 12:30 | CAD | CPI Media Y/Y Jul | |
| Forecast: 3.70% | Previous: 3.90% | ||
| 12:30 | CAD | CPI Trimmed Y/Y Jul | |
| Forecast: 3.50% | Previous: 3.70% | ||
| 12:30 | CAD | CPI Common Y/Y Jul | |
| Forecast: 5.00% | Previous: 5.10% | ||
| 12:30 | USD | Empire State Manufacturing Index Aug | |
| Forecast: -0.3 | Previous: 1.1 | ||
| 12:30 | USD | Retail Sales M/M Jul | |
| Forecast: 0.40% | Previous: 0.20% | ||
| 12:30 | USD | Retail Sales ex Autos M/M Jul | |
| Forecast: 0.40% | Previous: 0.20% | ||
| 12:30 | USD | Import Price Index M/M Jul | |
| Forecast: 0.20% | Previous: -0.20% | ||
| 14:00 | USD | Business Inventories Jun | |
| Forecast: 0.20% | Previous: 0.20% | ||
| 14:00 | USD | NAHB Housing Market Index Aug | |
| Forecast: 56 | Previous: 56 | ||
Wednesday, Aug 16, 2023
| GMT | Ccy | Events | Consensus | Previous |
|---|---|---|---|---|
| 00:30 | AUD | Westpac Leading Index M/M Jul | 0.12% | |
| 02:00 | NZD | RBNZ Interest Rate Decision | 5.50% | 5.50% |
| 03:00 | NZD | RBNZ Press Conference | ||
| 06:00 | GBP | CPI M/M Jul | -0.50% | 0.10% |
| 06:00 | GBP | CPI Y/Y Jul | 6.80% | 7.90% |
| 06:00 | GBP | Core CPI Y/Y Jul | 6.80% | 6.90% |
| 06:00 | GBP | RPI M/M Jul | -0.70% | 0.30% |
| 06:00 | GBP | RPI Y/Y Jul | 9.00% | 10.70% |
| 06:00 | GBP | PPI Input M/M Jul | -1.30% | |
| 06:00 | GBP | PPI Input Y/Y Jul | -5.10% | -2.70% |
| 06:00 | GBP | PPI Output M/M Jul | -0.40% | -0.30% |
| 06:00 | GBP | PPI Output Y/Y Jul | -1.20% | 0.10% |
| 06:00 | GBP | PPI Core Output M/M Jul | -0.30% | -0.20% |
| 06:00 | GBP | PPI Core Output Y/Y Jul | 1.60% | 3.00% |
| 09:00 | EUR | Eurozone GDP Q/Q Q2 P | 0.30% | 0.30% |
| 09:00 | EUR | Employment Change Q/Q Q2 P | 0.40% | 0.60% |
| 09:00 | EUR | Eurozone Industrial Production M/M Jun | 0.10% | 0.20% |
| 12:15 | CAD | Housing Starts Y/Y Jul | 260K | 281.4K |
| 12:30 | CAD | Wholesale Sales M/M Jun | -4.40% | 3.50% |
| 12:30 | USD | Housing Starts Jul | 1.45M | 1.43M |
| 12:30 | USD | Building Permits Jul | 1.47M | 1.44M |
| 13:15 | USD | Industrial Production M/M Jul | 0.30% | -0.50% |
| 13:15 | USD | Capacity Utilization Jul | 79.00% | 78.90% |
| 14:30 | USD | Crude Oil Inventories | 5.9M | |
| 18:00 | USD | FOMC Minutes | ||
| 22:45 | NZD | PPI Input Q/Q Q2 | 0.20% | |
| 22:45 | NZD | PPI Output Q/Q Q2 | 0.30% | |
| 23:50 | JPY | Trade Balance (JPY) Jul | -0.44T | -0.55T |
| 23:50 | JPY | Machinery Orders M/M Jun | 3.60% | -7.60% |
| GMT | Ccy | Events | |
|---|---|---|---|
| 00:30 | AUD | Westpac Leading Index M/M Jul | |
| Forecast: | Previous: 0.12% | ||
| 02:00 | NZD | RBNZ Interest Rate Decision | |
| Forecast: 5.50% | Previous: 5.50% | ||
| 03:00 | NZD | RBNZ Press Conference | |
| Forecast: | Previous: | ||
| 06:00 | GBP | CPI M/M Jul | |
| Forecast: -0.50% | Previous: 0.10% | ||
| 06:00 | GBP | CPI Y/Y Jul | |
| Forecast: 6.80% | Previous: 7.90% | ||
| 06:00 | GBP | Core CPI Y/Y Jul | |
| Forecast: 6.80% | Previous: 6.90% | ||
| 06:00 | GBP | RPI M/M Jul | |
| Forecast: -0.70% | Previous: 0.30% | ||
| 06:00 | GBP | RPI Y/Y Jul | |
| Forecast: 9.00% | Previous: 10.70% | ||
| 06:00 | GBP | PPI Input M/M Jul | |
| Forecast: | Previous: -1.30% | ||
| 06:00 | GBP | PPI Input Y/Y Jul | |
| Forecast: -5.10% | Previous: -2.70% | ||
| 06:00 | GBP | PPI Output M/M Jul | |
| Forecast: -0.40% | Previous: -0.30% | ||
| 06:00 | GBP | PPI Output Y/Y Jul | |
| Forecast: -1.20% | Previous: 0.10% | ||
| 06:00 | GBP | PPI Core Output M/M Jul | |
| Forecast: -0.30% | Previous: -0.20% | ||
| 06:00 | GBP | PPI Core Output Y/Y Jul | |
| Forecast: 1.60% | Previous: 3.00% | ||
| 09:00 | EUR | Eurozone GDP Q/Q Q2 P | |
| Forecast: 0.30% | Previous: 0.30% | ||
| 09:00 | EUR | Employment Change Q/Q Q2 P | |
| Forecast: 0.40% | Previous: 0.60% | ||
| 09:00 | EUR | Eurozone Industrial Production M/M Jun | |
| Forecast: 0.10% | Previous: 0.20% | ||
| 12:15 | CAD | Housing Starts Y/Y Jul | |
| Forecast: 260K | Previous: 281.4K | ||
| 12:30 | CAD | Wholesale Sales M/M Jun | |
| Forecast: -4.40% | Previous: 3.50% | ||
| 12:30 | USD | Housing Starts Jul | |
| Forecast: 1.45M | Previous: 1.43M | ||
| 12:30 | USD | Building Permits Jul | |
| Forecast: 1.47M | Previous: 1.44M | ||
| 13:15 | USD | Industrial Production M/M Jul | |
| Forecast: 0.30% | Previous: -0.50% | ||
| 13:15 | USD | Capacity Utilization Jul | |
| Forecast: 79.00% | Previous: 78.90% | ||
| 14:30 | USD | Crude Oil Inventories | |
| Forecast: | Previous: 5.9M | ||
| 18:00 | USD | FOMC Minutes | |
| Forecast: | Previous: | ||
| 22:45 | NZD | PPI Input Q/Q Q2 | |
| Forecast: | Previous: 0.20% | ||
| 22:45 | NZD | PPI Output Q/Q Q2 | |
| Forecast: | Previous: 0.30% | ||
| 23:50 | JPY | Trade Balance (JPY) Jul | |
| Forecast: -0.44T | Previous: -0.55T | ||
| 23:50 | JPY | Machinery Orders M/M Jun | |
| Forecast: 3.60% | Previous: -7.60% | ||
Thursday, Aug 17, 2023
| GMT | Ccy | Events | Consensus | Previous |
|---|---|---|---|---|
| 01:30 | AUD | Employment Change Jul | 15.2K | 32.6K |
| 01:30 | AUD | Unemployment Rate Jul | 3.60% | 3.50% |
| 04:30 | JPY | Tertiary Industry Index M/M Jun | -0.10% | 1.20% |
| 09:00 | EUR | Eurozone Trade Balance (EUR) Jun | 2.3B | -0.9B |
| 12:30 | USD | Initial Jobless Claims (Aug 11) | 240K | 248K |
| 12:30 | USD | Philadelphia Fed Manufacturing Survey Aug | -9.5 | -13.5 |
| 14:30 | USD | Natural Gas Storage | 29B | |
| 23:30 | JPY | National CPI Y/Y Jul | 3.30% | |
| 23:30 | JPY | National CPI ex-Fresh Food Y/Y Jul | 3.10% | 3.30% |
| 23:30 | JPY | National CPI ex Food Energy Y/Y Jul | 4.20% |
| GMT | Ccy | Events | |
|---|---|---|---|
| 01:30 | AUD | Employment Change Jul | |
| Forecast: 15.2K | Previous: 32.6K | ||
| 01:30 | AUD | Unemployment Rate Jul | |
| Forecast: 3.60% | Previous: 3.50% | ||
| 04:30 | JPY | Tertiary Industry Index M/M Jun | |
| Forecast: -0.10% | Previous: 1.20% | ||
| 09:00 | EUR | Eurozone Trade Balance (EUR) Jun | |
| Forecast: 2.3B | Previous: -0.9B | ||
| 12:30 | USD | Initial Jobless Claims (Aug 11) | |
| Forecast: 240K | Previous: 248K | ||
| 12:30 | USD | Philadelphia Fed Manufacturing Survey Aug | |
| Forecast: -9.5 | Previous: -13.5 | ||
| 14:30 | USD | Natural Gas Storage | |
| Forecast: | Previous: 29B | ||
| 23:30 | JPY | National CPI Y/Y Jul | |
| Forecast: | Previous: 3.30% | ||
| 23:30 | JPY | National CPI ex-Fresh Food Y/Y Jul | |
| Forecast: 3.10% | Previous: 3.30% | ||
| 23:30 | JPY | National CPI ex Food Energy Y/Y Jul | |
| Forecast: | Previous: 4.20% | ||
Friday, Aug 18, 2023
| GMT | Ccy | Events | Consensus | Previous |
|---|---|---|---|---|
| 06:00 | GBP | Retail Sales M/M Jul | -0.40% | 0.70% |
| 09:00 | EUR | Eurozone CPI Y/Y Jul F | 5.30% | 5.30% |
| 09:00 | EUR | Eurozone Core CPI Y/Y Jul F | 5.50% | 5.50% |
| 12:30 | CAD | Industrial Product Price M/M Jul | -0.60% | |
| 12:30 | CAD | Raw Material Price Index Jul | -1.50% |
| GMT | Ccy | Events | |
|---|---|---|---|
| 06:00 | GBP | Retail Sales M/M Jul | |
| Forecast: -0.40% | Previous: 0.70% | ||
| 09:00 | EUR | Eurozone CPI Y/Y Jul F | |
| Forecast: 5.30% | Previous: 5.30% | ||
| 09:00 | EUR | Eurozone Core CPI Y/Y Jul F | |
| Forecast: 5.50% | Previous: 5.50% | ||
| 12:30 | CAD | Industrial Product Price M/M Jul | |
| Forecast: | Previous: -0.60% | ||
| 12:30 | CAD | Raw Material Price Index Jul | |
| Forecast: | Previous: -1.50% | ||
US Production Prices Growth Unnerves Markets
US producer prices, both including and excluding food and energy, rose 0.3% m/m in July. This is the first positive surprise for the indicator in six months – before this, prices had regularly missed average forecasts, supporting expectations of a rapid easing of price pressures.
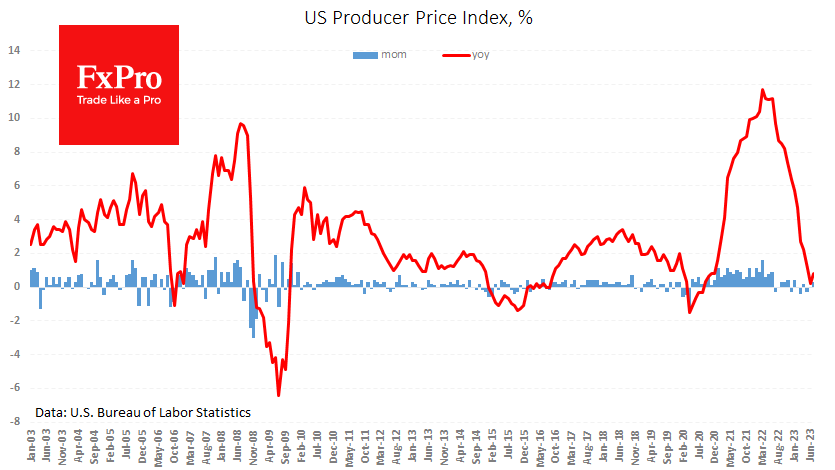
The annualised growth rate for the headline index rose from 0.2% to 0.8%. The core price index maintained its growth rate of 2.4% y/y. The main driver of price growth in July was higher service prices, among which distributive trades (+0.7% m/m) stood out. Among the goods groups, food was the main price driver.
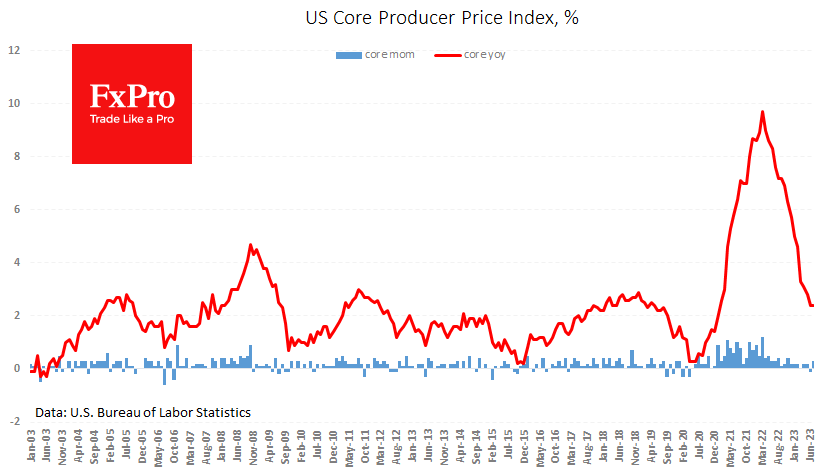
This report may reinforce expectations of a second wave of inflation, this time linked to the strength of the economy, which is pushing up prices of services and several commodities.
Such data may not be enough to seriously reinforce expectations of a Fed rate hike in September, with the odds now estimated at 13.5%. However, interest rate futures are pricing in a 33% chance of a hike before the end of the year, up from 25% a week ago.
In other words, markets continue to move away from their initial assumption that a rapid cut would follow a sharp hike. And this idea is not sitting well with the equity indices, as the most interest rate sensitive Nasdaq100 fell 0.8% on the latest report, taking its losses for the day to 1.2%. This dip below the 50-day moving average suggests a growing chance of a correction to the year-to-date gains.