

Sample Category Title
EUR/GBP Daily Outlook
Daily Pivots: (S1) 0.8637; (P) 0.8651; (R1) 0.8678; More...
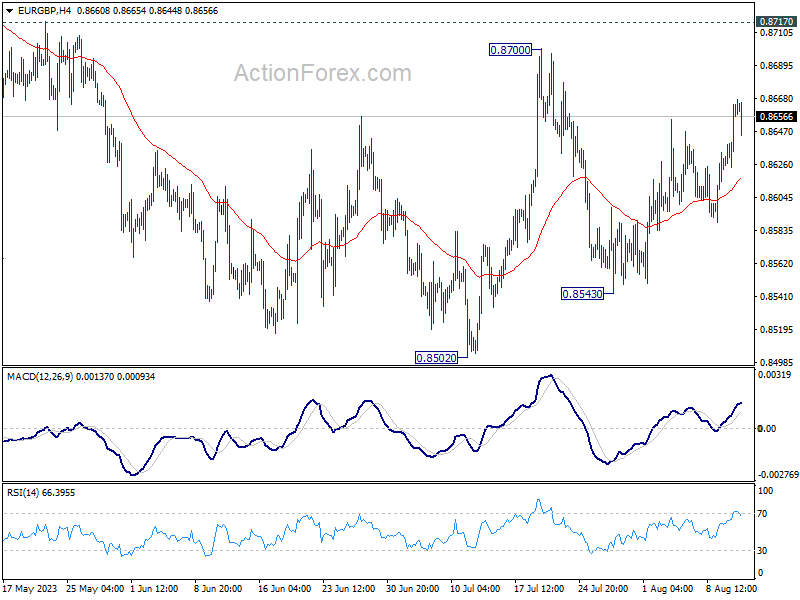
Intraday bias in EUR/GBP remains neutral as sideway trading is extending. On the downside, below 0.8543 will target a test on 0.8502 low. Decisive break there will resume larger decline from 0.8977. On the upside firm break of 0.8717 resistance will suggest larger reversal and target 0.8874 resistance next.
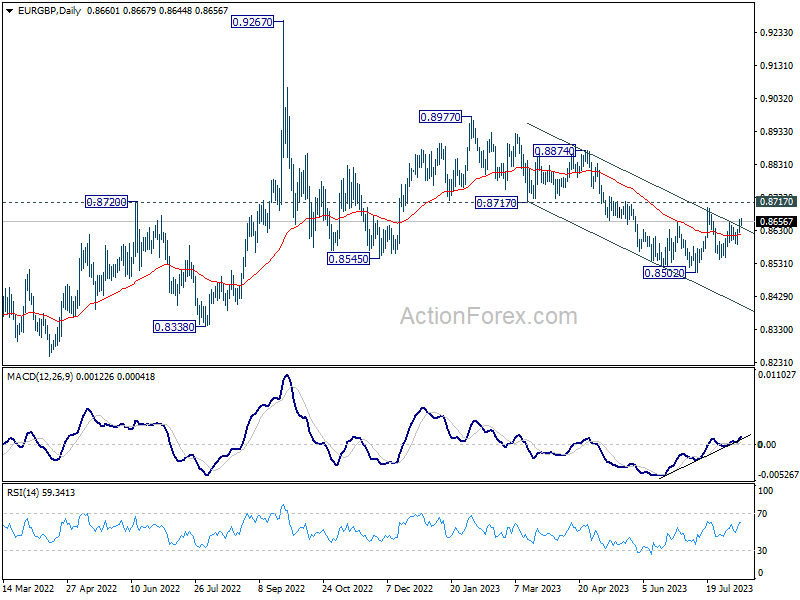
In the bigger picture, the down trend from 0.9267 (2022 high) is seen as part of the long term range pattern from 0.9499 (2020 high). Firm break of 0.8717 support turned resistance will argue that it has completed with three waves down to 0.8502. Further break of 0.8977 will bring retest of 0.9267 high. Nevertheless, rejection by 0.8717, followed by break of 0.8502 will resume the decline towards 0.8201 (2022 low).
EUR/CHF Daily Outlook
Daily Pivots: (S1) 0.9616; (P) 0.9627; (R1) 0.9640; More...
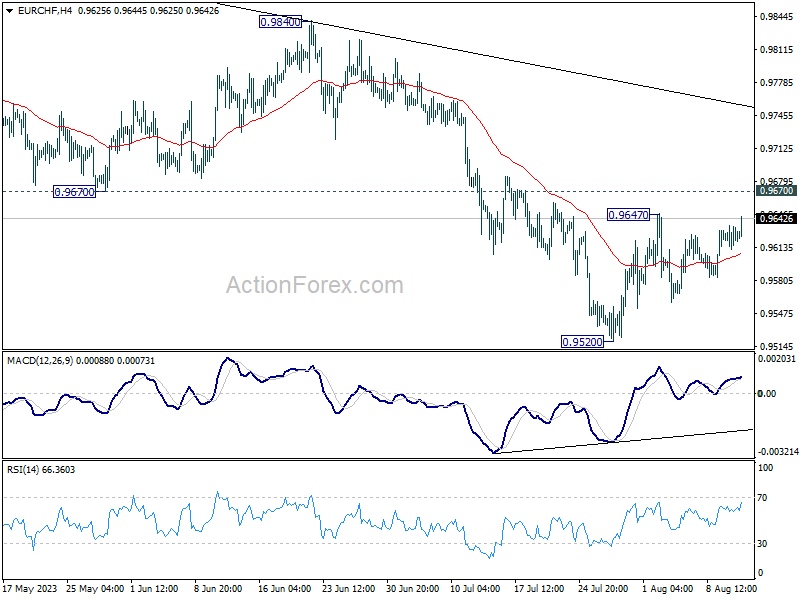
Intraday bias in EUR/CHF remains neutral first. On the upside, break of 0.9647 will resume the rebound form 0.9520. Further sustained break of 0.9670 will be the first sign of bullish reversal and target 0.9840 resistance for confirmation. On the downside, break of 0.9520 will resume the whole fall from 1.0095 towards 0.9407 low.
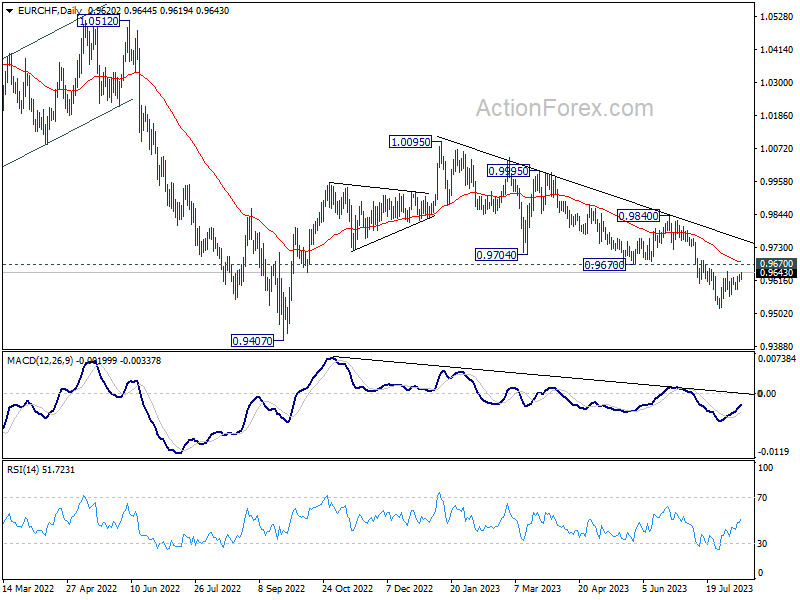
In the bigger picture, medium term outlook is staying bearish as the pair is capped well below falling 55 W EMA (now at 0.9860). Down trend from 1.2004 (2018 high) is in favor to continue. Sustained break of 0.9407 will target 61.8% projection of 1.1149 to 0.9407 from 1.0095 at 0.9018. For now, this will remain the favored case as long as 0.9840 resistance holds, in case of strong rebound.
EUR/USD Technical Analysis
On the hourly chart of EUR/USD at FXOpen, the pair started a recovery wave from the 1.0930 region. The Euro traded above the 1.0970 resistance zone against the US Dollar.
The pair settled above the 50-hour simple moving average and tested 1.1000. It is now consolidating above a connecting bullish trend line with support at 1.0990. Immediate resistance is near the 1.1015 level.
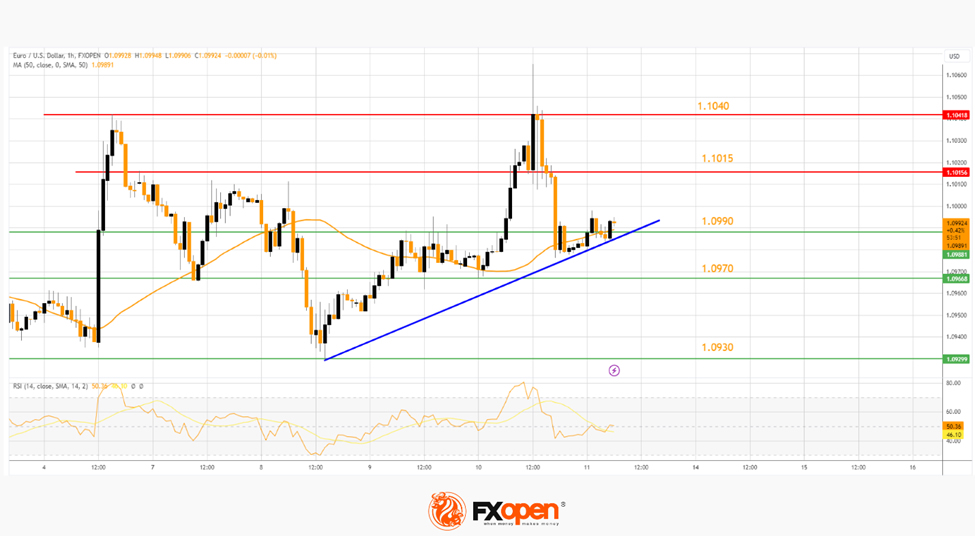
The next major resistance is near 1.1040. Any more gains might send the pair toward 1.1080 or even 1.1120 in the near term.
Conversely, the pair might start a fresh decline below the trend line. The next key support is near 1.0970, below which EUR/USD could test 1.0930. Any more losses could send the pair toward the 1.0920 support zone.
This article represents the opinion of the Companies operating under the FXOpen brand only. It is not to be construed as an offer, solicitation, or recommendation with respect to products and services provided by the Companies operating under the FXOpen brand, nor is it to be considered financial advice.
USD/CAD Daily Outlook
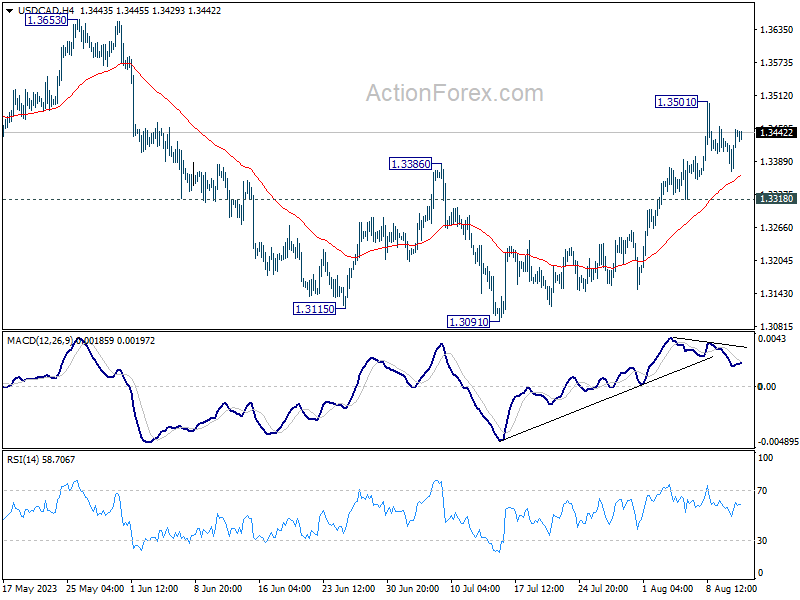
Daily Pivots: (S1) 1.3396; (P) 1.3424; (R1) 1.3475; More....
Intraday bias in USD/CAD remains neutral for the moment. Further rally is expected as long as 1.3318 support holds. Current development argues that correction from 1.3976 has completed with three waves down to 1.3091. Above 1.3501 will resume the rise from 1.3091 to 1.3653 resistance next. Break there will further confirm this case and target 1.3976 high.
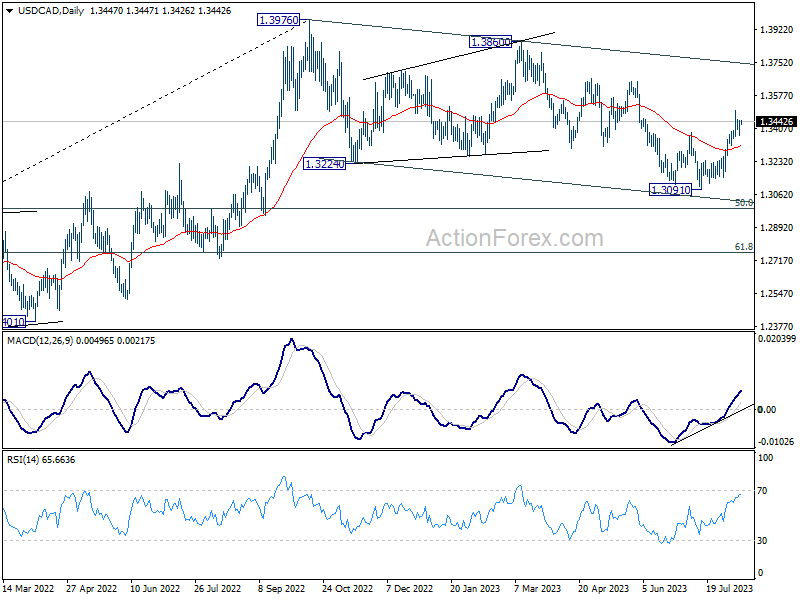
In the bigger picture, price actions from 1.3976 are viewed as a corrective fall only. Upon completion, rise from 1.2005 (2021 low) would resume through 1.3976 towards 1.4667/89 long term resistance zone. In case of another fall, downside should be contained by 61.8% retracement of 1.2005 to 1.3976 at 1.2758.
AUD/USD Daily Report
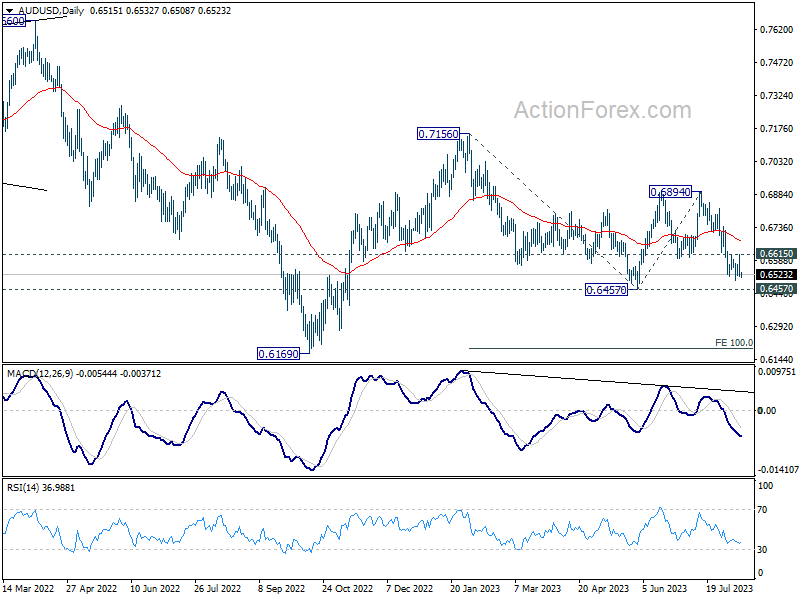
Daily Pivots: (S1) 0.6481; (P) 0.6548; (R1) 0.6583; More...
Intraday bias in AUD/USD stays neutral for the moment. On the downside, decisive break of 0.6457 support will confirm resumption of whole fall from 0.7156. Next target is 100% projection of 0.7156 to 0.6457 from 0.6894 at 0.6195. Nevertheless, firm break of 0.6615 minor resistance will dampen this view, and turn bias back to the upside for stronger rebound.
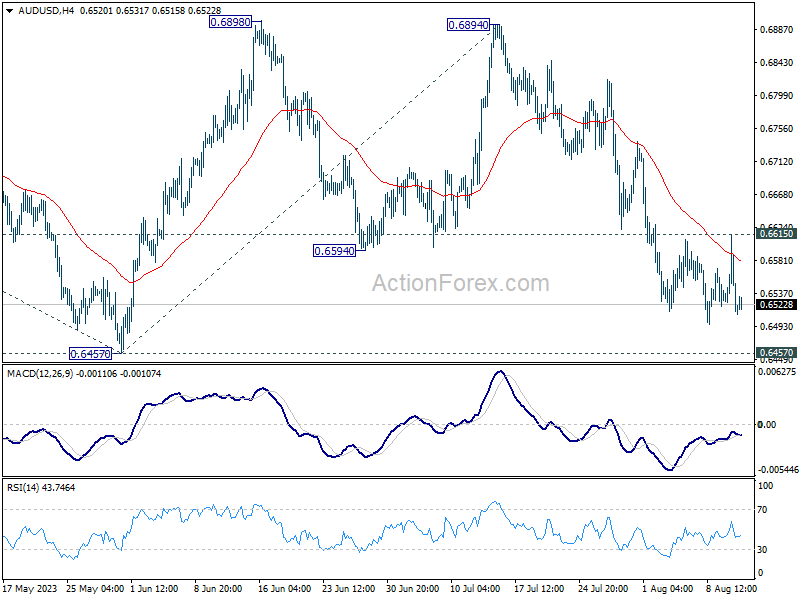
In the bigger picture, outlook is mixed for now as AUD/USD failed to sustain above both 55 D EMA (now at 0.6686) and 55 W EMA (now at 0.6769). On the upside, break of 0.6894 resistance will solidify the case that down trend from 0.8006 (2021 high) has already completed, and target 0.7156 resistance for confirmation. However, break of 0.6457 will likely resume the down trend through 0.6169 (2022 low).
USD/JPY Daily Outlook
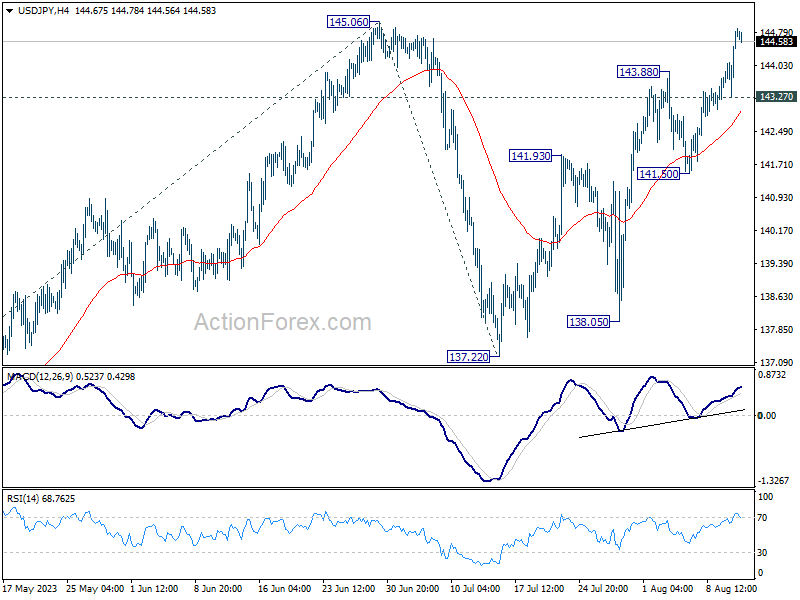
Daily Pivots: (S1) 143.75; (P) 144.28; (R1) 145.29; More...
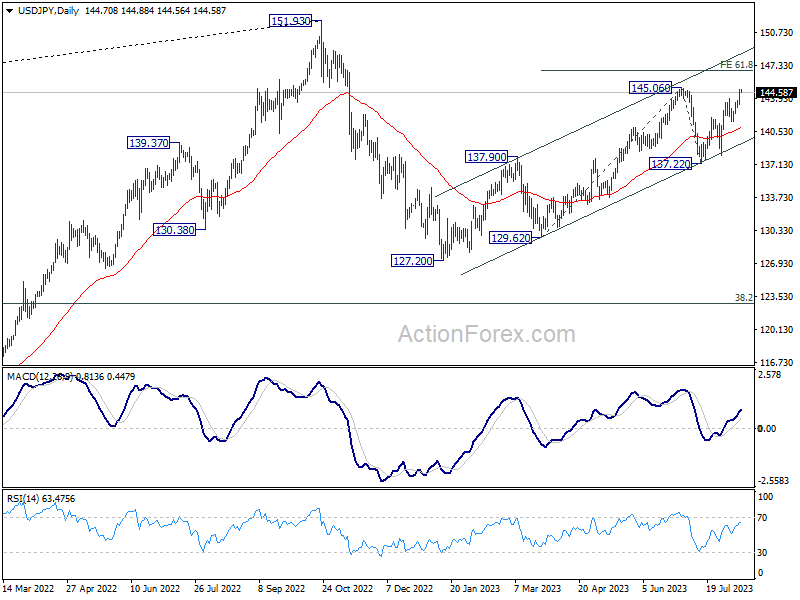
Intraday bias in USD/JPY stays on the upside at this point. Decisive break of 145.06 will resume whole rally from 127.20. Next target is 61.8% projection of 129.62 to 145.06 from 137.22 at 146.76. On the downside, however, below 143.27 minor support will delay the bullish case and turn intraday bias neutral again.
In the bigger picture, overall price actions from 151.93 (2022 high) are views as a corrective pattern. Rise from 127.20 is seen as the second leg of the pattern and could still be in progress. But even in case of extended rise, strong resistance should be seen from 151.93 to limit upside. Meanwhile, break of 137.22 support should confirm the start of the third leg to 127.20 (2023 low) and below.
USD/CHF Daily Outlook
Daily Pivots: (S1) 0.8713; (P) 0.8746; (R1) 0.8800; More....
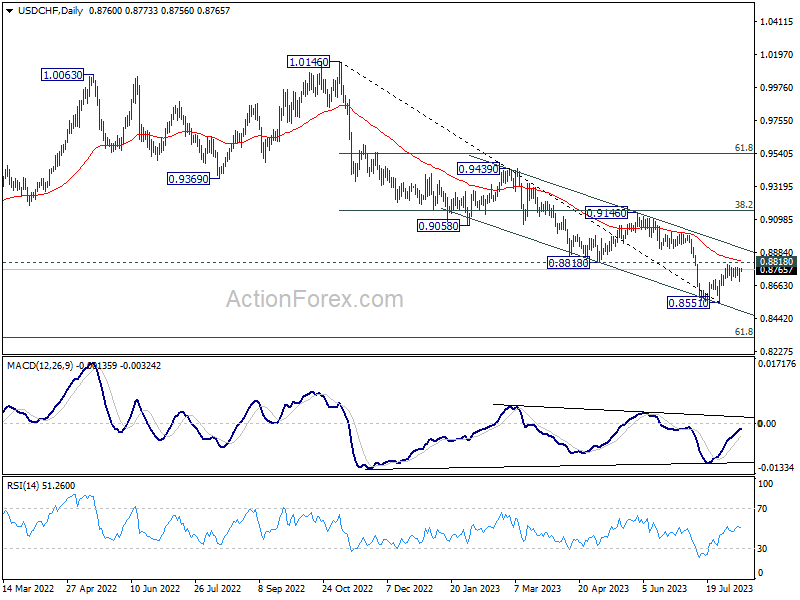
Intraday bias in USD/CHF stays neutral at this point. On the downside break of 0.8663 minor support should confirm rejection by 0.8818 and turn intraday bias back to the downside for retesting 0.8551 first. Nevertheless, decisive break of 0.8818 will carry larger bullish implication, and target 0.9146 cluster resistance next.
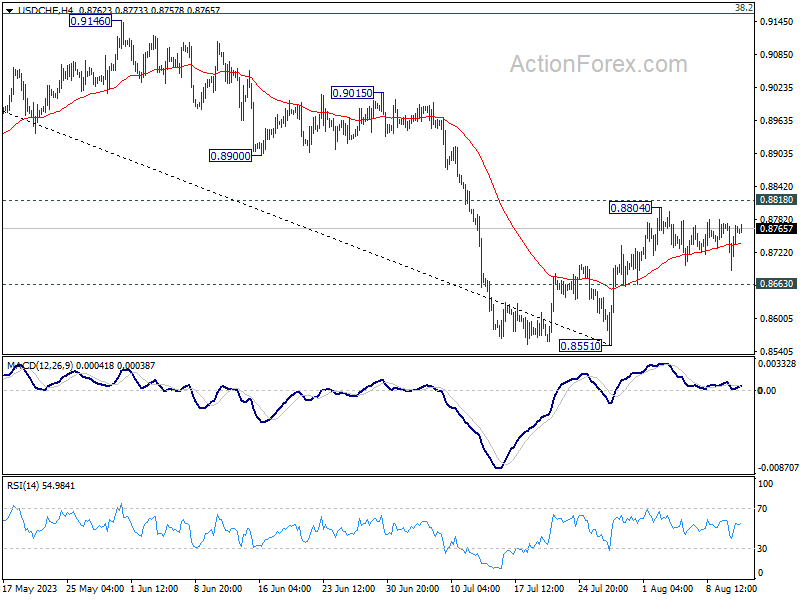
In the bigger picture, down trend from 1.0146 is seen as in progress as long as 0.8188 support turned resistance holds. Next target is 61.8% retracement of 0.7065 (2011 low) to 1.0342 (2016 high) at 0.8317. However, sustained break of 0.8818 should indicate medium term bottoming, and bring stronger rise back to 0.9146 cluster resistance (38.2% retracement of 1.0146 to 0.8551 at 0.9160), even as a correction.
EUR/USD Daily Outlook
Daily Pivots: (S1) 1.0944; (P) 1.1004; (R1) 1.1042; More...
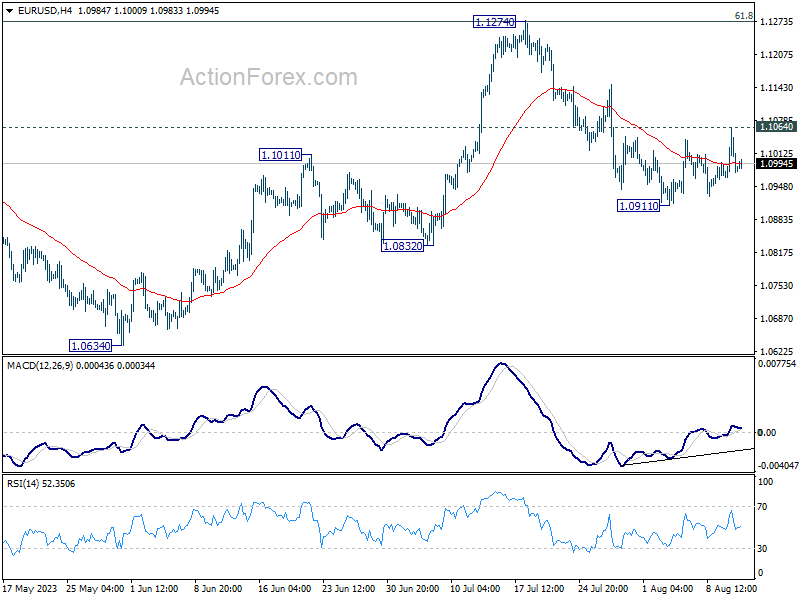
Intraday bias in EUR/USD stays neutral at this point. On the downside, break of 1.0911 will resume the fall from 1.1274 to 1.0832 support. Sustained trading below there will target 1.0609/34 cluster support. However, firm break of 1.1064 minor resistance will argue that pull back from 1.1274 has completed, and bring stronger rebound.
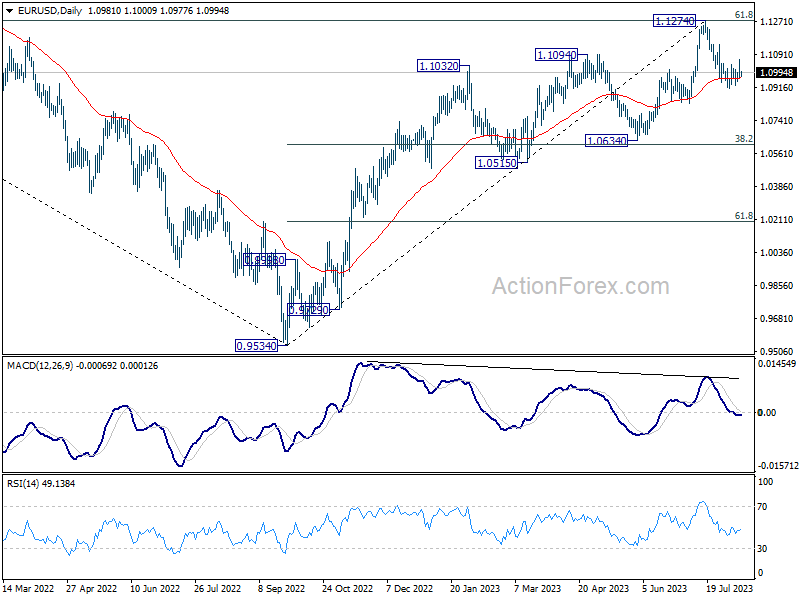
In the bigger picture, a medium term top could be formed at 1.1274, after failing to break through 61.8% retracement of 1.2348 (2021 high) to 0.9534 at 1.1273 decisively, on bearish divergence condition in D MACD. Sustained trading below 55 D EMA (now at 1.0966) will bring deeper correction to 1.0634 cluster support (38.2% retracement of 0.9534 to 1.1274 at 1.0609). Strong support could be seen there, at least on first attempt, to set the range for consolidation.
GBPJPY Close to New 2023 High as Bears Appear Powerless
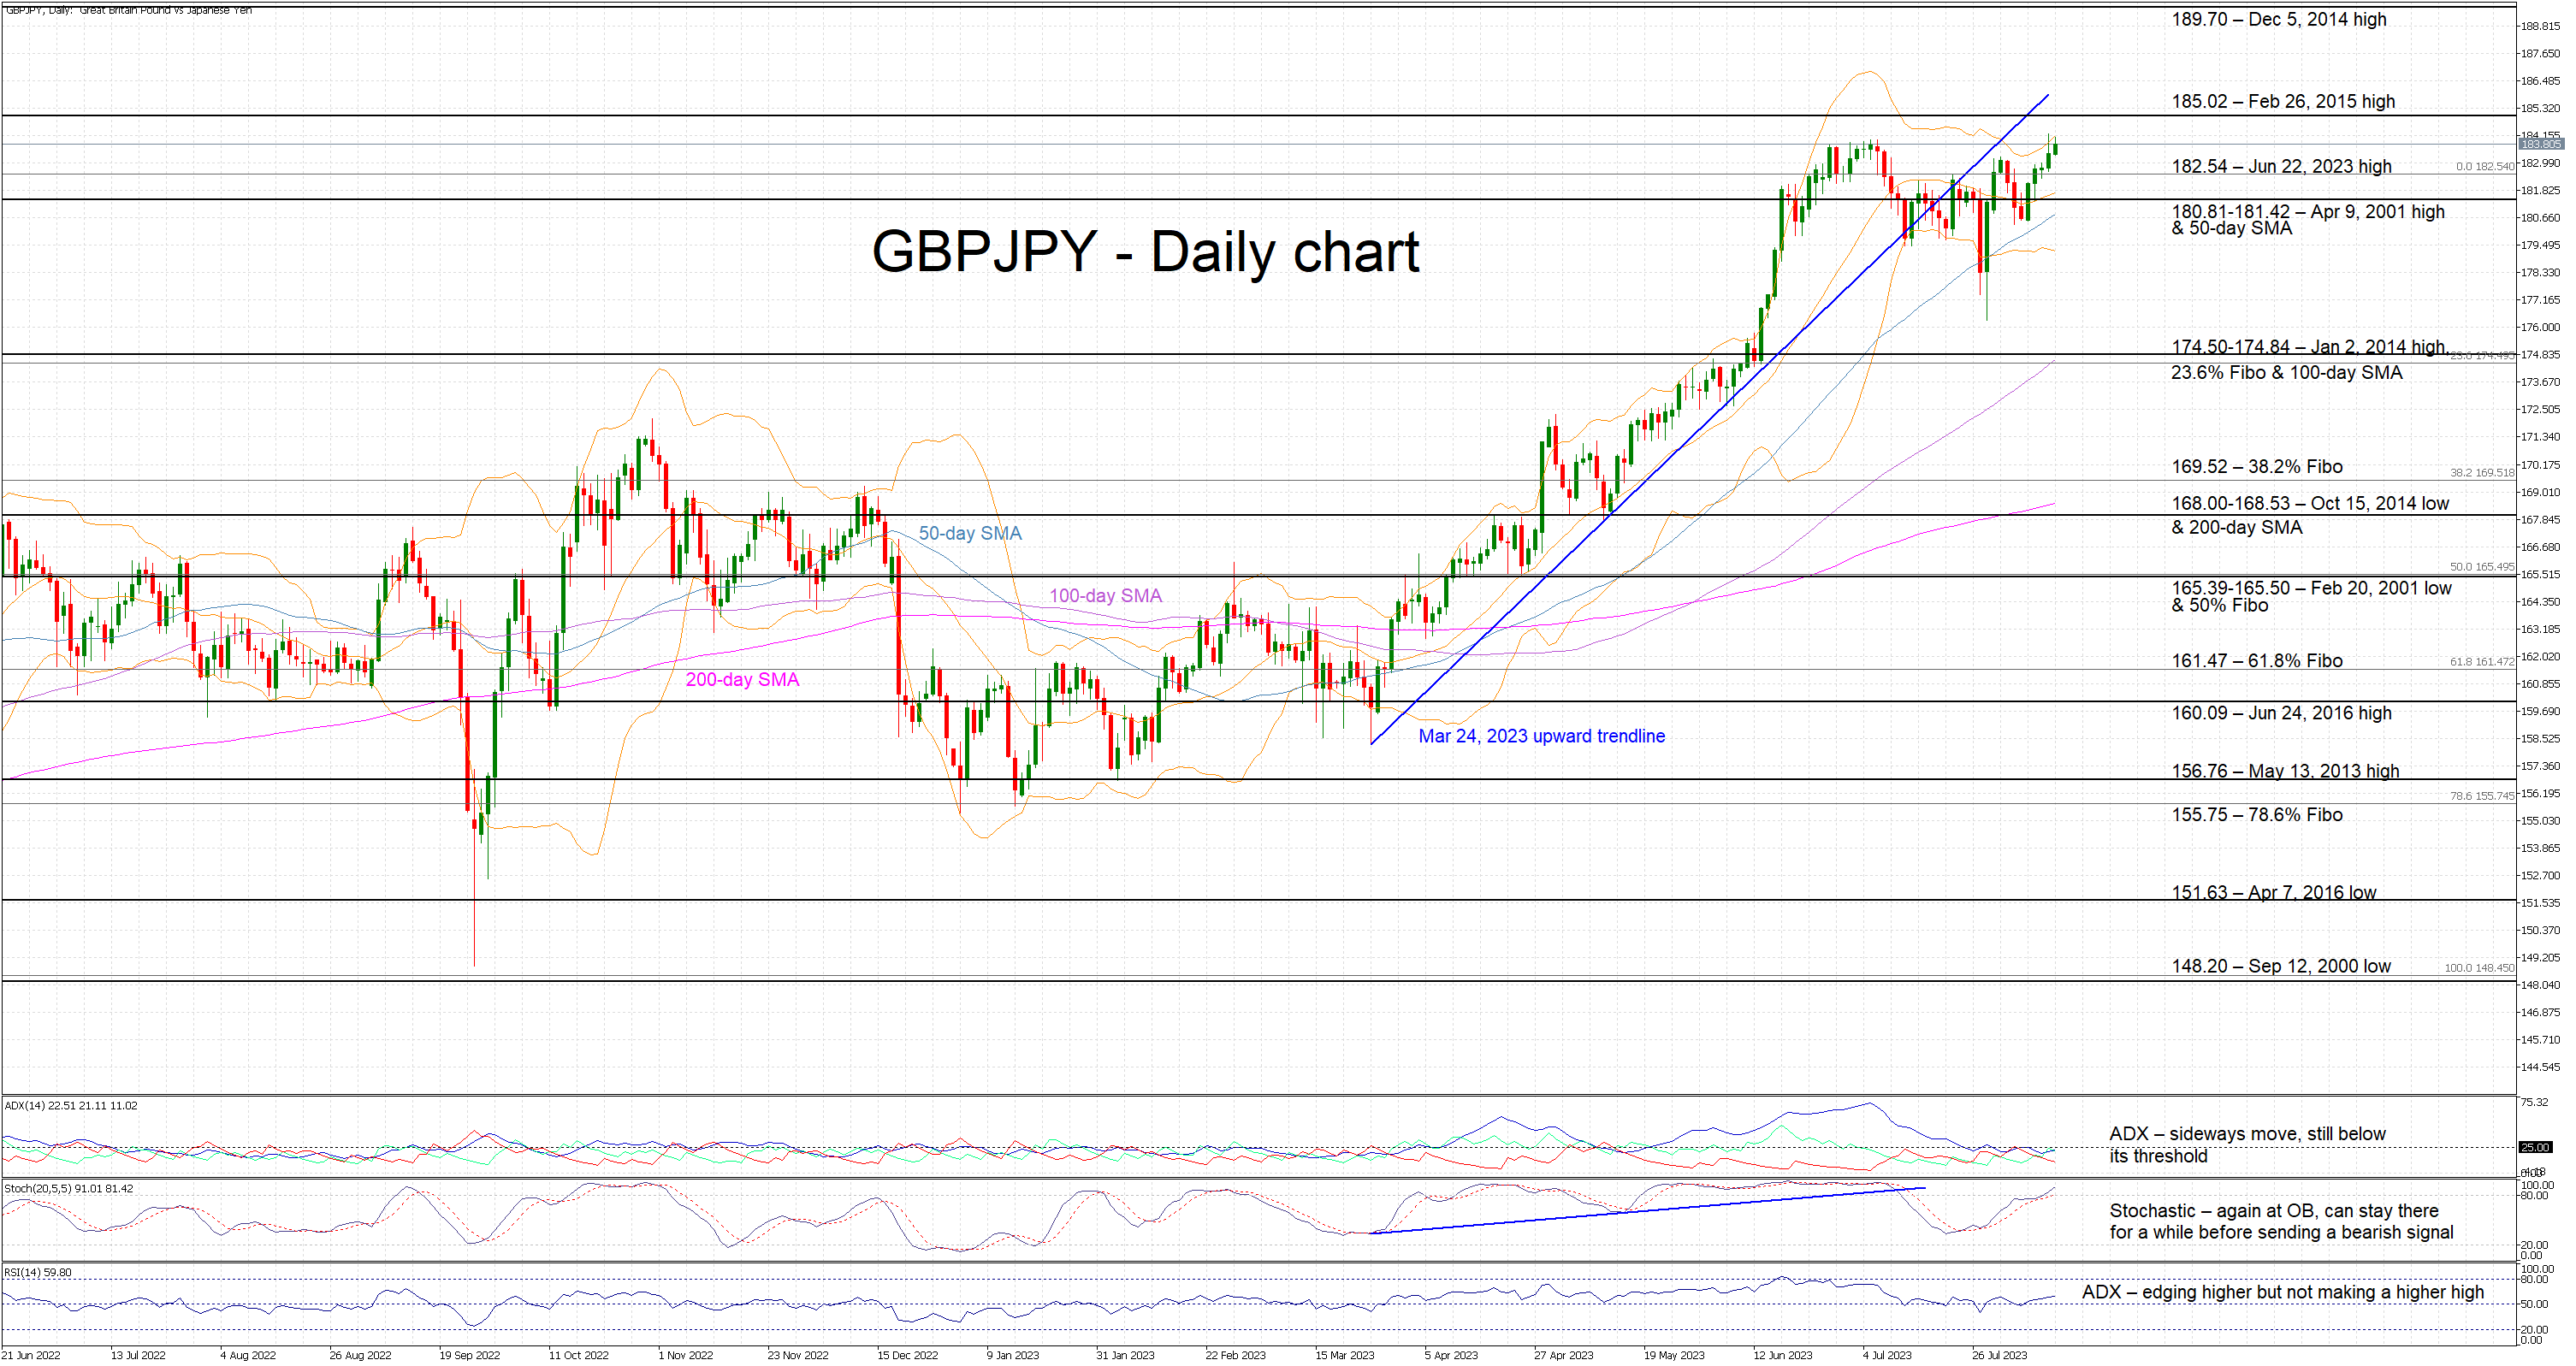
GBPJPY is trading higher again today, registering its fifth consecutive green candle. The bears tried to take advantage of the July 28 events, but the bulls quickly took control of the market and never looked back. They are currently trying to make a new 8-year high despite the mixed momentum indicators’ picture.
In more detail, the Average Directional Movement Index (ADX) remains uninterested in the current upleg as it continues to trade below its 25-threshold, and thus signaling a range-trading market. Additionally, the RSI is edging gradually higher but has failed, up to now, to record a higher high and support the current upleg in GBPJPY. More importantly, the stochastic oscillator has just entered its overbought territory. This is usually seen as an early rally exhaustion signal, but stronger confirmation is needed to energize the bears.
Should the bulls remain thirsty, they would try to test the resistance set by the February 26, 2015 high at 185.02. If successful, the path would then be clear until the next key level, the December 5, 2014 high at 189.70.
On the other hand, the bears are desperately trying to stage a pullback. They are keen on a move below the June 22, 2023 high at 182.54, and a retest of the busy 180.81-181.42 range populated by the April 9, 2001 high and the 50-day simple moving average (SMA). The door would then be wide open for a more sizeable sell-off as the next key support area resides in the 147.50-174.84 range.
To sum up, despite the mixed momentum indicators, GBPJPY bulls are again firmly in control as the bears appear unable to stage another sell-off similar to the July 27 drop.
AUD/USD and NZD/USD Could Extend Losses
AUD/USD declined below the 0.6560 and 0.6540 support levels. NZD/USD is gaining bearish momentum below the 0.6030 support zone.
Important Takeaways for AUD/USD and NZD/USD Analysis Today
- The Aussie Dollar started a fresh decline from well above the 0.6600 level against the US Dollar.
- There was a break below a key bullish trend line with support near 0.6540 on the hourly chart of AUD/USD at FXOpen.
- NZD/USD declined heavily from the 0.6120 resistance zone.
- There was a break below a major rising channel with support near 0.6060 on the hourly chart of NZD/USD at FXOpen.
AUD/USD Technical Analysis
On the hourly chart of AUD/USD at FXOpen, the pair struggled to stay above the 0.6600 level. The Aussie Dollar started a fresh decline below the 0.6560 support against the US Dollar.
There was a break below a key bullish trend line with support near 0.6540. The pair even settled below 0.6540 and the 50-hour simple moving average. A low is formed near 0.6509 and the pair is now consolidating losses.
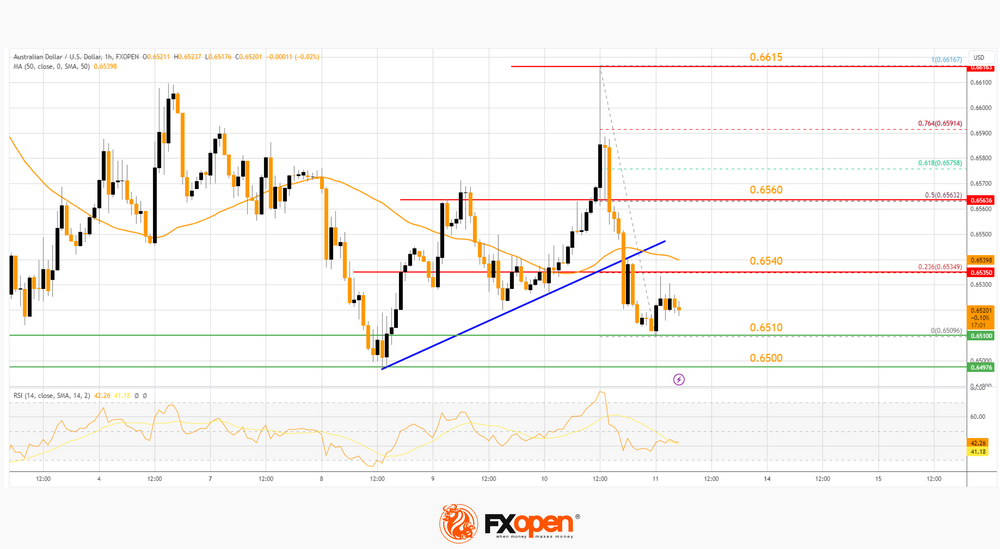
Immediate resistance on the upside is near the 23.6% Fib retracement level of the downward move from the 0.6616 swing high to the 0.6509 low at 0.6540.
The next major resistance is near the 50% Fib retracement level of the downward move from the 0.6616 swing high to the 0.6509 low at 0.6560, above which the price could rise toward 0.6600. Any more gains might send the pair toward 0.6615.
A close above the 0.6615 level could start another steady increase in the near term. The next major resistance on the AUD/USD chart could be 0.6650.
On the downside, initial support is near the 0.6510 level. The next support could be the 0.6500 level. If there is a downside break below 0.6500, the pair could extend its decline toward the 0.6450 region. Any more losses might send the pair toward the 0.6420 support.
NZD/USD Technical Analysis
On the hourly chart of NZD/USD on FXOpen, the pair also followed a similar pattern and declined from the 0.6120 zone. The New Zealand Dollar gained bearish momentum and traded below 0.6080 against the US Dollar.
There was a break below a major rising channel with support near 0.6060 and the 50-hour simple moving average. Finally, the bulls appeared near the 0.6000 zone. A low is formed near 0.6002 and the pair is still showing a few bearish signs.
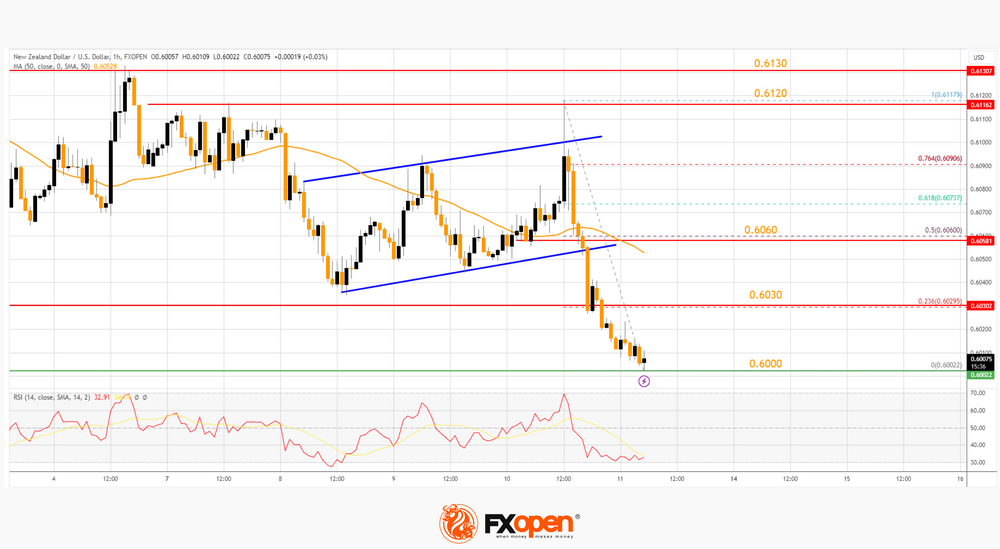
Immediate resistance on the upside is near the 23.6% Fib retracement level of the downward move from the 0.6117 swing high to the 0.6002 low at 0.6030.
If there is a move above 0.6030, the pair could rise toward the 50-hour simple moving average at 0.6060. It is close to the 50% Fib retracement level of the downward move from the 0.6117 swing high to the 0.6002 low.
Any more gains might open the doors for a move toward the 0.6120 resistance zone in the coming days. On the downside, immediate support on the NZD/USD chart is near the 0.6000 level. The first major support is near the 0.5965 zone. If there is a downside break below 0.5965, the pair could extend its decline toward the 0.5920 level. The next key support is near 0.5850.
This article represents the opinion of the Companies operating under the FXOpen brand only. It is not to be construed as an offer, solicitation, or recommendation with respect to products and services provided by the Companies operating under the FXOpen brand, nor is it to be considered financial advice.