Sample Category Title
Dollar Up on PPI Data, But Strong Enough for Breakout?
Dollar is making slight gains in early US session, buoyed by slightly better-than-expected PPI data release. Adding to its strength are mild risk aversion sentiments and continued rebound in Treasury yields. If this buying momentum sustains, the greenback could well close out the week as the top performer. The remaining question is whether its momentum is strong enough to break out from the near term range against European majors.
Speaking of European currencies, British Pound is the standout, drawing strength from an upbeat UK GDP data report released earlier in the day. However, the enthusiasm seems to be waning, with no evident sustained buying. Yen, meanwhile, is on track to finish at the bottom of the performance chart, showing no signs of a rebound. Commodity-linked currencies are trailing closely behind Yen, while Euro and Swiss Franc are managing to hold firmer ground.
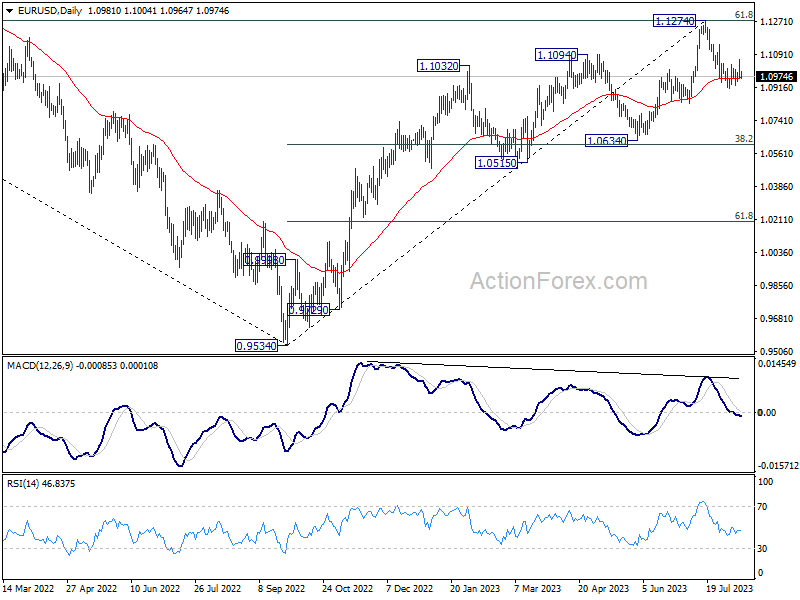
Technically, the support from 55 D EMA looks insufficient to prompt a stronger rebound in EUR/USD. Break of last week's low at 1.0911, and sustained trading below the EMA will set up deeper fall to 1.0634 support, even as a correction to the up trend from 0.9534. Let's see if we'll know the answer today, or next week.
In Europe, at the time of writing, FTSE is down -1.40%. DAX -1.10%. CAC is down -1.47%. Germany 10-year yield is up 0.0091 at 2.619. Earlier in Asia, Nikkei rose 0.84%. Hong Kong HSI fell -0.90%. China Shanghai SSE dropped 2.01%. Singapore Strait Times lost -0.86%. Japan 10-year JGB yield rose 0.0241 to 0.589.
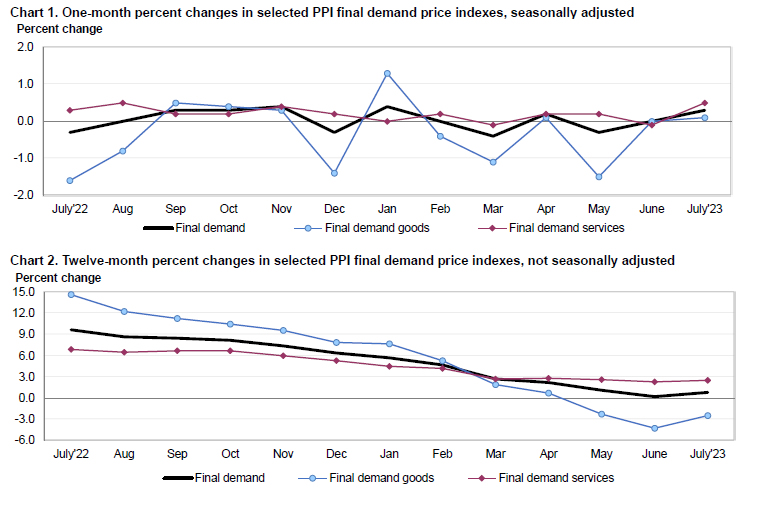
US PPI up 0.3% mom in Jul, services rose 0.5% mom, goods rose 0.1% mom
US PPI for final demand rose 0.3% mom in July, above expectation of 0.2% mom. PPI services rose 0.5% mom while PPI goods edged up 0.1% mom. PPI ex-food, energy, and trade services rose 0.2% mom.
For the 12 months ended in July, PPI rose 0.8% yoy, above expectation of 0.7% yoy. PPI ex-foods, energy and trade services rose 2.7% yoy.
UK GDP rose 0.5% mom in Jun, up 0.2% qoq in Q2
UK GDP grew 0.5% mom in June, well above expectation of 0.2% mom. Production grew 1.8% mom. Services was up 0.2% mom. Construction also rose 1.6% mom.
For Q1, GDP grew 0.2% qoq, above expectation of 0.0% qoq. But the level of quarterly GDP was -0.2% below its pre-pandemic level in Q4 2019. Services grew 0.1% on the quarter. Production grew by 0.7% with 1.6% growth in manufacturing. Construction rose 0.3%.
The implied price of GDP rose by 2.1% in Q2, which was primarily driven by higher price pressures for household consumption (1.5%) and government consumption (3.1%).
Also released, industrial production was up 1.8% mom, 0.7% yoy in June. Manufacturing production was up 2.4% mom, 3.1% yoy. Goods trade deficit narrowed to GBP -15.5B.
RBA Lowe: Possible that some further tightening will be required
Addressing the House of Representatives Standing Committee on Economics today, outgoing RBA Governor, Philip Lowe stated that the purpose behind the pauses in July and August was "to provide time to assess the impact of the (rates) increases to date and the economic outlook and the associated risks."
He reiterated that "it is possible that some further tightening of monetary policy will be required". But the decision would be largely based on incoming data and the Board's evolving analysis of economic forecast and potential risks.
Lowe expressed optimism about recent economic data, remarking, "It is encouraging that the recent data are consistent with inflation returning to target over the next couple of years."
But he also pinpointed two risks that RBA is closely monitoring. "The first is the outlook for household consumption," he said, attributing this concern to the myriad of factors currently influencing household finances and expenditures.
The second risk highlighted was the potential persistence of high services price inflation which could lead to "prolonging the period of inflation being above target."
Lowe emphasized the RBA's forecast, which assumes a resurgence in productivity rates, aligning with levels seen pre-pandemic. Such growth, he suggested, would help in moderating the unit labour costs and subsequently, inflation. Yet, he cautioned, "If this pick-up in productivity does not occur, all else constant, high inflation is likely to persist, which would be problematic."
New Zealand BNZ manufacturing slumps to Post-GFC low in July
New Zealand's BusinessNZ Performance of Manufacturing Index has experienced a drop in July, declining from 47.4 to 46.3. Digging into the details, there was a notable dip in Production, which plummeted from 47.3 to 42.9, and Employment wasn't far behind, decreasing from 46.8 to 44.3. On a slightly brighter note, New Orders saw a modest increase, moving from 43.8 to 45.0, and Finished Stocks slightly ticked up from 52.3 to 52.6. However, Deliveries took a sharp hit, falling from 49.9 to 42.3.
Feedback from the manufacturing sector portrayed a gloomy picture. Negative comments in July stood at 72%, a slight decrease from June's 74.5%, but higher than May's 66.7% and April's 70.3%. The core concerns cited by manufacturers revolved around general market uncertainty, escalating costs, and inclement weather affecting demand, particularly during July.
Catherine Beard, BusinessNZ's Director of Advocacy, remarked on the PMI's July figures, indicating that they "showed very little signs of potential improvements for the sector as a whole." Echoing this sentiment, BNZ Senior Economist, Doug Steel, highlighted the gravity of the situation, noting that "the July result was the fifth consecutive monthly sub-50 reading and, outside of Covid lockdown periods, the lowest reading since the GFC days back in June 2009."
USD/CHF Mid-Day Outlook
Daily Pivots: (S1) 0.8713; (P) 0.8746; (R1) 0.8800; More....
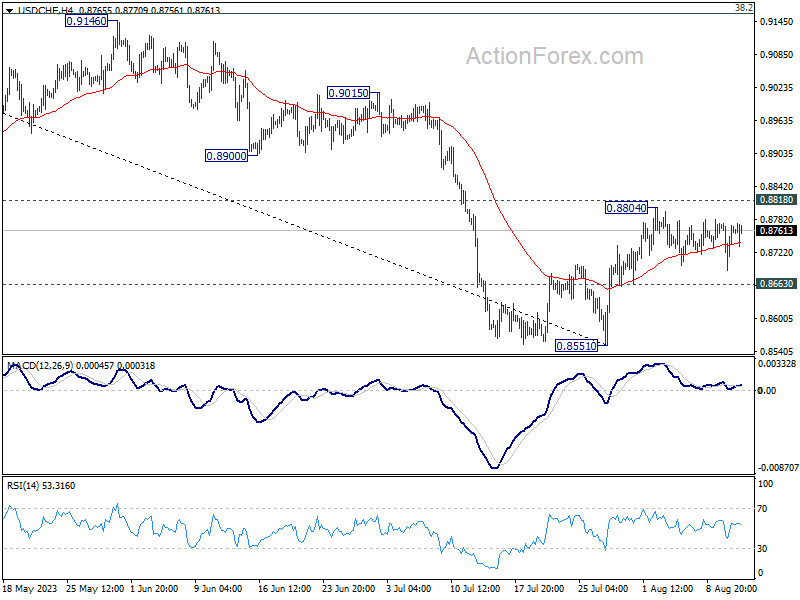
Sideway trading continues in USD/CHF and intraday bias stays neutral. On the downside break of 0.8663 minor support should confirm rejection by 0.8818 and turn intraday bias back to the downside for retesting 0.8551 first. Nevertheless, decisive break of 0.8818 will carry larger bullish implication, and target 0.9146 cluster resistance next.
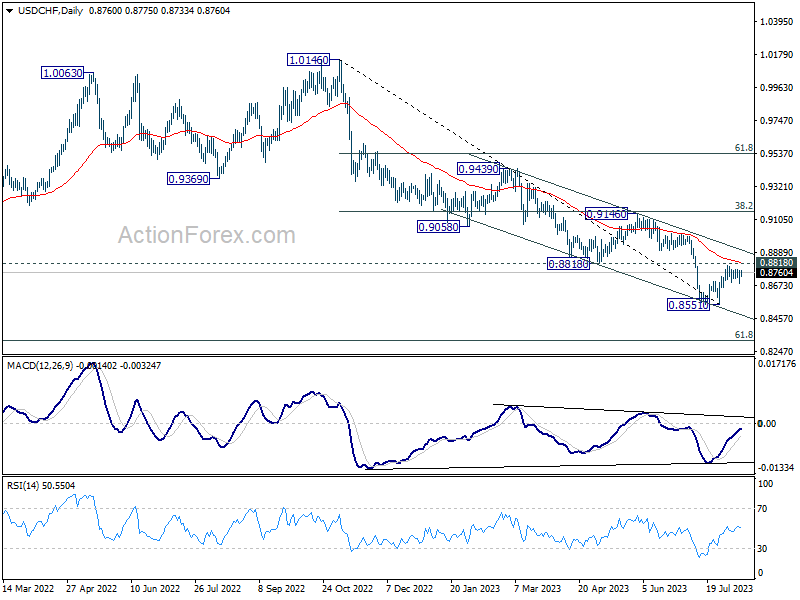
In the bigger picture, down trend from 1.0146 is seen as in progress as long as 0.8188 support turned resistance holds. Next target is 61.8% retracement of 0.7065 (2011 low) to 1.0342 (2016 high) at 0.8317. However, sustained break of 0.8818 should indicate medium term bottoming, and bring stronger rise back to 0.9146 cluster resistance (38.2% retracement of 1.0146 to 0.8551 at 0.9160), even as a correction.
Economic Indicators Update
| GMT | Ccy | Events | Actual | Forecast | Previous | Revised |
|---|---|---|---|---|---|---|
| 22:30 | NZD | Business NZ PMI Jul | 46.3 | 47.5 | 47.4 | |
| 06:00 | GBP | GDP Q/Q Q2 P | 0.20% | 0.00% | 0.10% | |
| 06:00 | GBP | GDP M/M Jun | 0.50% | 0.20% | -0.10% | |
| 06:00 | GBP | Industrial Production M/M Jun | 1.80% | -0.10% | -0.60% | |
| 06:00 | GBP | Industrial Production Y/Y Jun | 0.70% | -2.10% | -2.30% | -2.10% |
| 06:00 | GBP | Manufacturing Production M/M Jun | 2.40% | 0.10% | -0.20% | -0.10% |
| 06:00 | GBP | Manufacturing Production Y/Y Jun | 3.10% | -1.00% | -1.20% | -0.60% |
| 06:00 | GBP | Goods Trade Balance (GBP) Jun | -15.5B | -16.2B | -18.7B | -18.4B |
| 08:00 | EUR | Italy Trade Balance (EUR) Jun | 7.72B | 4.23B | 4.71B | 4.77B |
| 11:00 | GBP | NIESR GDP Estimate (3M) Jul | 0.30% | 0.00% | ||
| 12:30 | USD | PPI M/M Jul | 0.30% | 0.20% | 0.10% | 0.00% |
| 12:30 | USD | PPI Y/Y Jul | 0.80% | 0.70% | 0.10% | 0.20% |
| 12:30 | USD | PPI Core M/M Jul | 0.30% | 0.20% | 0.10% | -0.10% |
| 12:30 | USD | PPI Core Y/Y Jul | 2.40% | 2.30% | 2.40% | |
| 14:00 | USD | Michigan Consumer Sentiment Index Aug P | 70.9 | 71.6 |
US PPI up 0.3% mom in Jul, services rose 0.5% mom, goods rose 0.1% mom
US PPI for final demand rose 0.3% mom in July, above expectation of 0.2% mom. PPI services rose 0.5% mom while PPI goods edged up 0.1% mom. PPI ex-food, energy, and trade services rose 0.2% mom.
For the 12 months ended in July, PPI rose 0.8% yoy, above expectation of 0.7% yoy. PPI ex-foods, energy and trade services rose 2.7% yoy.
New Zealand Dollar Poised to Break Below Key 0.60 Level
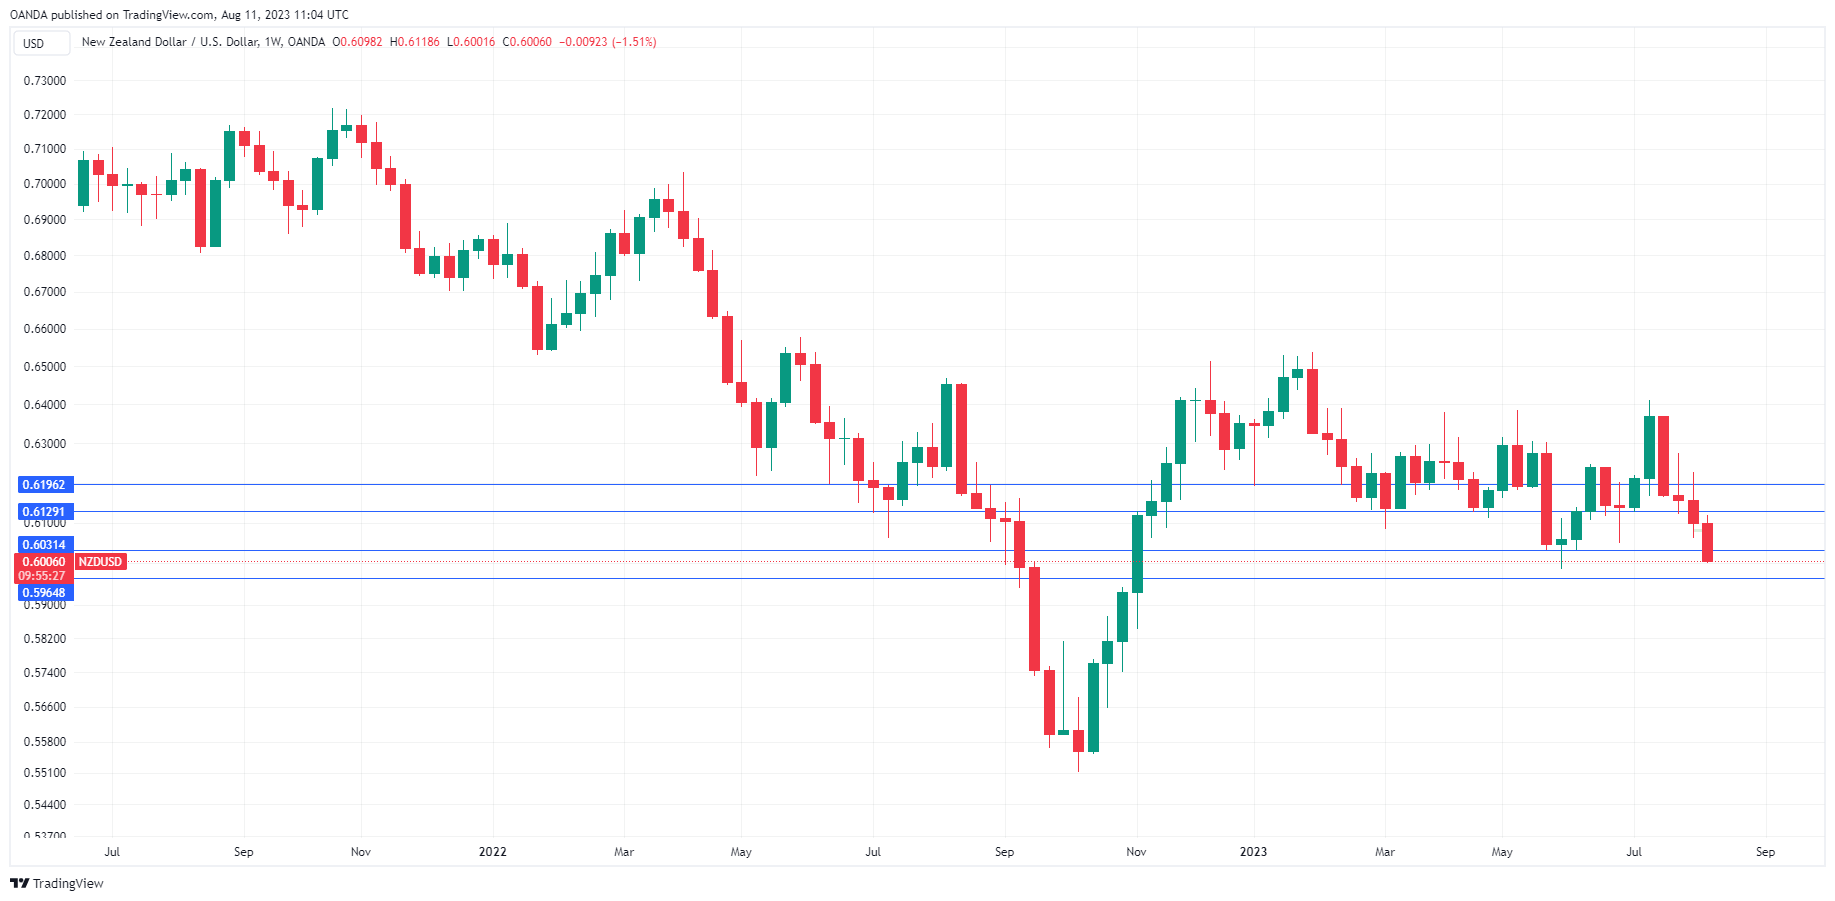
The New Zealand dollar has extended its slide for a fourth straight day. In the European session, NZD/USD is trading at 0.6005, down 0.26%. New Zealand
It’s been an awful ride for the New Zealand currency, which is down 1.50% this week. NZD/USD hasn’t posted a winning week since early July and has plunged 270 basis points since then. The latest setback for the New Zealand dollar is the soft data out of China, which is New Zealand’s biggest trading partner.
China’s highly-touted recovery has been a bust. The government abruptly shifted its Covid policy from zero tolerance to reopening the economy, and the hope was that economic activity would soar. Instead, domestic demand has been weak and a soft global economy has meant less demand for Chinese goods. This week’s trade release indicated in a decline in China’s exports and imports. The economy has slowed to such an extent that the country is officially in a deflation phase – CPI for July declined for the first time since February 2021.
A slowdown in China is especially bad news for commodity currencies like the New Zealand dollar, which has fallen sharply this week due to the soft trade and inflation reports out of China. If the Chinese economy weakens further, I would expect the New Zealand dollar to lose even more ground.
The Reserve Bank of New Zealand meets on August 16th and there is a strong likelihood that it will hold rates for a second straight month. The RBNZ has been signalling that its rate-tightening cycle is over but that it will maintain rates in restrictive territory. This could well mean an extended pause until the central bank feels that conditions are ripe for rate cuts.
New Zealand inflation has been moving in the right direction, but the current 6% clip is much too high. The key question is whether high rates will filter into the economy and continue to push inflation lower without the need for additional rate hikes. The RBNZ will be keeping a close eye on inflation and employment numbers in order to determine its future rate path.
US inflation rises, but Fed expected to pause
US headline inflation rose in July to 3.2%, above the June gain of 3.0% but below the 3.3% consensus estimate. Core CPI nudged lower to 4.7% in July compared to the June reading of 4.8% which was also the estimate. The report was within expectations and should cement a pause in rates in September, with the odds of a rate hike at just 10%, according to the CME FedWatch.
NZD/USD Technical
- NZD/USD is testing support at 0.6031. Below, there is support at 0.5964
- 0.6129 and 0.6196 are the next resistance lines
British Pound Edges Higher after GDP Surprise
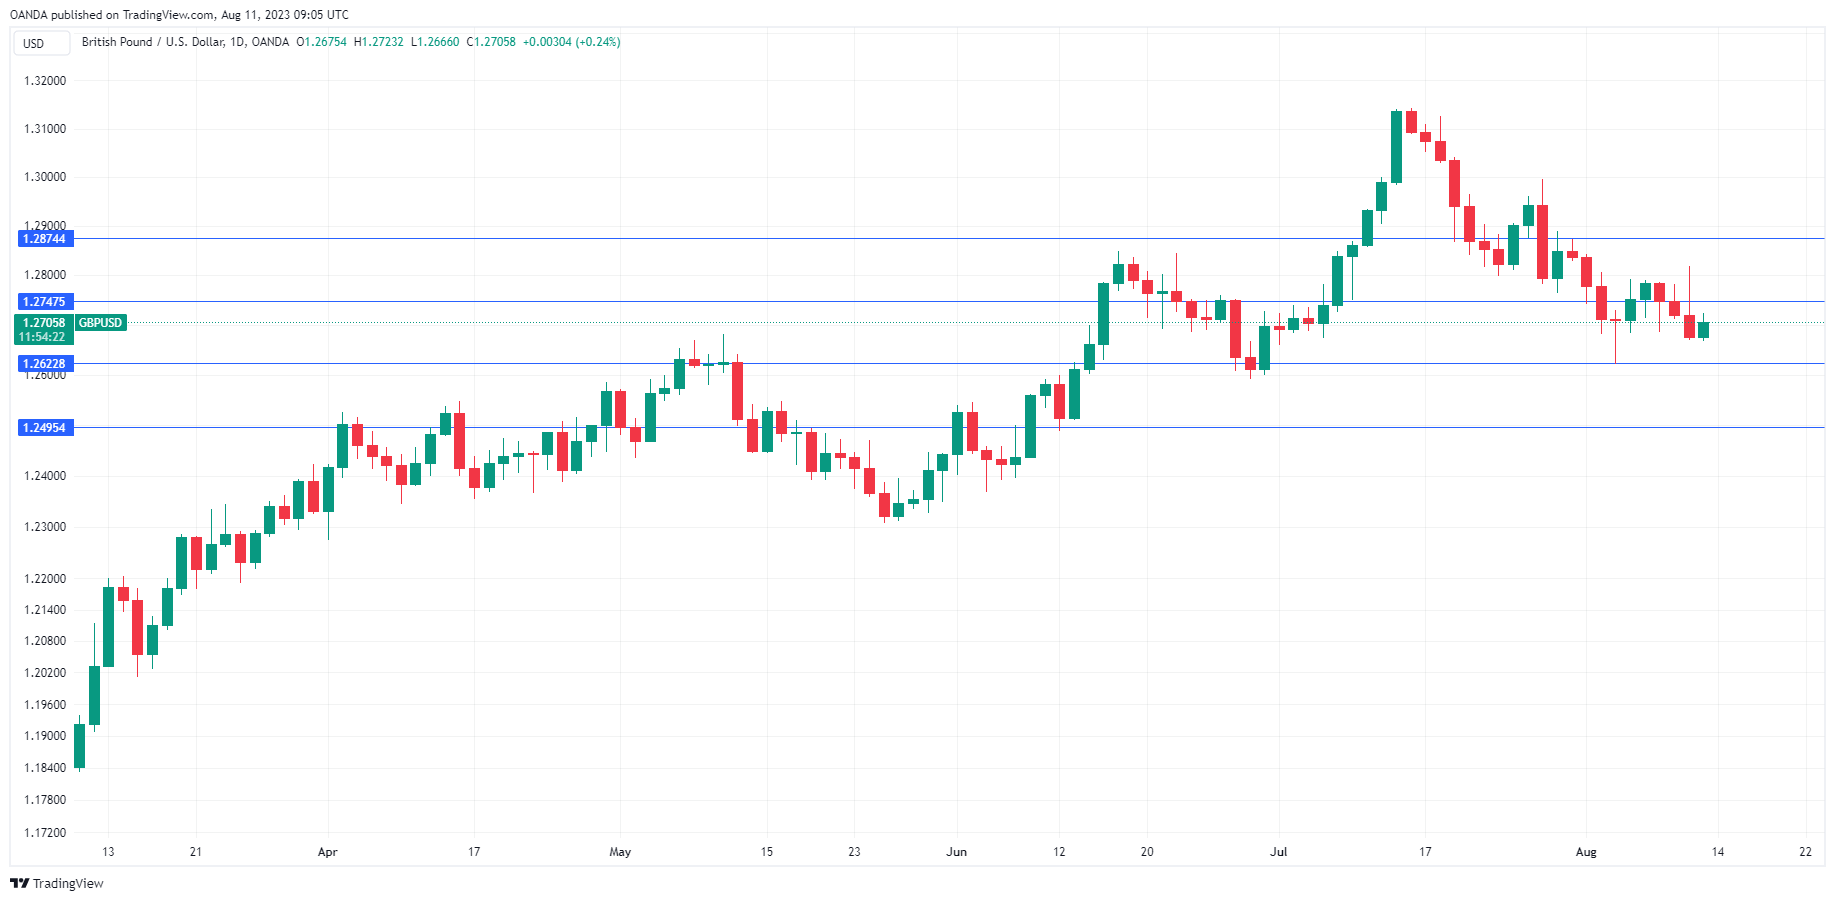
The British pound is slightly higher earlier on Friday. In the European session, GBP/USD is trading at 1.2706, up 0.24%.
UK GDP surprises to the upside
The week wrapped up on a high note in the UK, as the economy grew by 0.2% q/q in the second quarter. The gain was indeed modest, but it beat the consensus estimate of zero growth and the first quarter reading of 0.1%. The struggling UK economy thus managed to elude stagnation. Another good piece of news was that June GDP climbed 0.5% m/m, above the estimate of 0.2% and rebounding from the May reading of -0.1%. This is the highest monthly growth rate since October 2022.
The Bank of England has had a rough time in its battle with inflation, despite raising interest rates to 5.25%, the highest level since February 2008. Inflation stands at 7.9%, the highest in the G7 club and nowhere near the BoE’s target of 2%. The slight improvement in economic growth will be welcome news at the Bank as there is a real concern that the combination of rising rates and a weak economy could result in a recession.
The market’s reaction to the GDP release was muted. The British pound rose about 40 basis points after the GDP release but pared most of these gains.
US inflation report likely cements Fed pause
The July US inflation report was an interesting mix. Headline CPI accelerated for the first time in 13 months, with a reading of 3.2%. This was higher than the 3.0% gain in May and just shy of the consensus estimate of 3.3%. The upswing didn’t result in any swings from the US dollar or the equity markets, as CPI was expected to rise due to base effects.
Core CPI, which is more important for the Fed than the headline indicator, ticked lower to 4.7% in July, down from 4.8% in June. On a monthly basis, the core rate climbed by 0.2% for a second straight month. If this trend continues, core inflation will fall significantly.
Perhaps the most important takeaway from the inflation report is that it should cement a pause from the Fed in September. The odds of a rate hike fell to just 10% after the inflation release, down from 0.14% prior to the release, according to the CME FedWatch tool. Is the Fed’s rate-tightening campaign finally over? That question is yet to be answered, but a pause in September will lead to increased expectations about rate cuts in 2024.
GBP/USD Technical
- There is resistance at 1.2747 and 1.2874
- 1.2622 and 1.2495 are providing support
USDCAD Bullish Reversal Faces Major Test
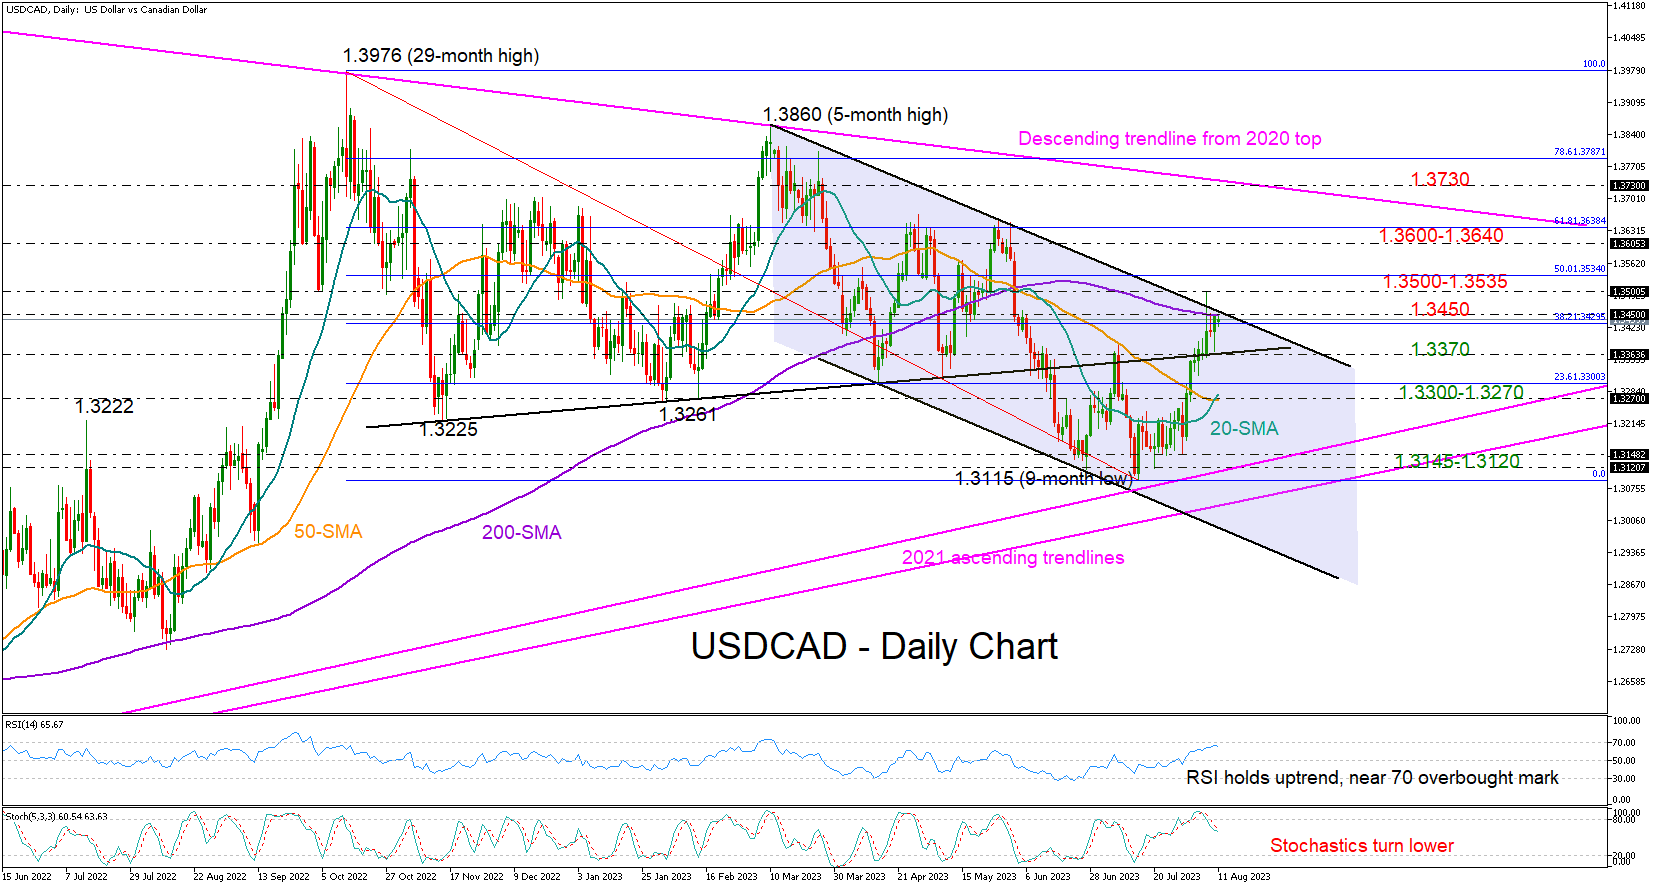
USDCAD has been fighting for a close above the 200-day simple moving average (SMA) at 1.3450 and the five-month-old bearish channel without success over the past few days despite the recent spike to 1.3500.
The pair is exhibiting its best monthly performance since February, and this week’s bounce off 1.3370 helped the pair to stay in the green area. However, the chances of a market correction are now looking larger because the RSI is closer to its 70 overbought mark and the stochastic oscillator has already turned south.
An obvious extension above the channel could reduce negative risks, but only a sustainable rally above the 1.3500-1.3535 zone, which includes the 50% Fibonacci retracement of the 1.3976-1.3115 downtrend, could bolster buying confidence. If the latter materializes, the ascent could speed up towards the 61.8% Fibonacci of 1.3640. Beyond that, buyers would like to see a durable uptrend above the 2020 resistance line at 1.3730, which caused the bearish reversal in March.
Looking for support levels, the 38.2% Fibonacci mark is currently under examination at 1.3430. A move lower could immediately halt around the 1.3370 base, a break of which could see a continuation towards the 23.6% Fibonacci of 1.3300 and the 20- and 50-day SMAs. Should the bears dominate there, the price could experience an aggressive decline towards the 1.3120-1.3145 base.
In brief, USDCAD traders may consider taking some profits from long positions in the coming sessions as the ongoing bullish wave in the price has finally reached the upper boundary of the bearish channel.
Slight Weakening of Crypto
Market picture
There are weak changes in the crypto market, with a slight drop in the capitalisation of 0.13% to $1.173 trillion. Bitcoin loses 0.4%, and Ethereum loses 0.2%, mainly due to lower risk appetite in equity markets. The top altcoins are multidirectional, ranging from a 0.65% decline (BNB) to a 1% gain (Solana).
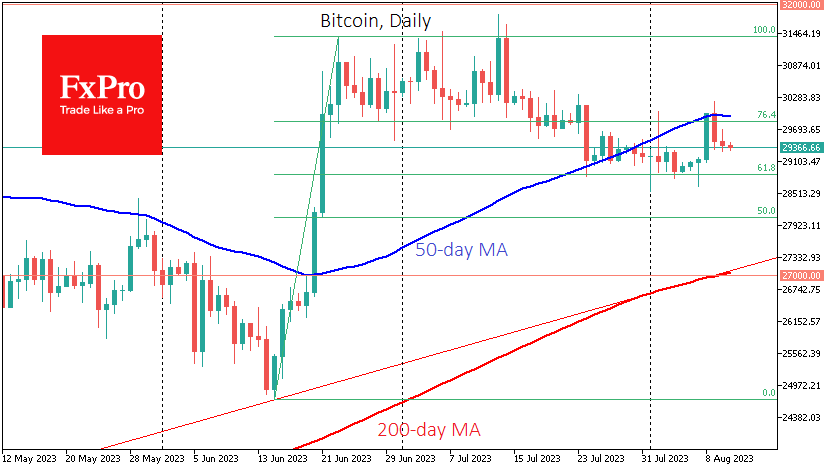
Bitcoin volatility remains well below average and lower than most equities. There remains a delicate balance of range-bound moves with slightly higher downside risks as BTCUSD falls further behind its 50-day average. Medium-term speculators are likely waiting for the end of the consolidation to enter the activity in case of a move out of the recent range. The movement could become one-sided, with a break above $30.1K or below $28.9K.
News Background
The SEC has informed the Southern District of New York court that it will appeal the partial loss in its ongoing litigation with Ripple. The agency will file an interlocutory appeal of Judge Analisa Torres’ ruling and seek to continue the case on a summary judgment basis. The regulator cited the ongoing litigation against Terraform Labs, where the judge rejected Torres’ approach.
The launch of PayPal’s stablecoin has caused “deep concern” in the US Congress. Maxine Waters, a US House of Representatives member, pointed to the lack of a regulatory framework for such assets.
The Block notes that the total capitalisation of stablecoins has been declining for more than a year. However, many positive things are happening in the industry for the stablecoin cryptocurrency space.
Tier 1 blockchain developer Aptos has entered a multi-year partnership with Microsoft to implement Web3 solutions. The Aptos token (APT) jumped 7%.
XAU/USD Price Analysis: Bears Approach Important Support
Yesterday, fresh values of the CPI index were published, which testified to a moderate slowdown in inflation in the US. The actual value was 3.2% in annual terms (expected 3.3%, a month earlier = 3.0%, a year earlier = 9.1%).
In reaction to the news, the price of gold fell from a daily high around USD 1,930 an ounce to renew the August low. Such behavior can be interpreted as a decrease in the value of the precious metal, as it loses its relevance as a protective asset against inflation.
Earlier we wrote that August began for the gold market in a bearish way. The trend continues.
Technical analysis of the XAU/USD chart on the 4-hour timeframe shows that:
→ the price develops dynamics within the descending channel, which has been operating since May of this year;
→ yesterday there was a test of resistance at the level of USD 1,930, which served as support in early August. This is a bearish sign;
→ the price of gold is approaching an important support at the psychological level of USD 1,900 per ounce;
→ a series of lower highs is formed on the chart;
→ the RSI indicator rose from the oversold zone, forming a bullish divergence pattern.
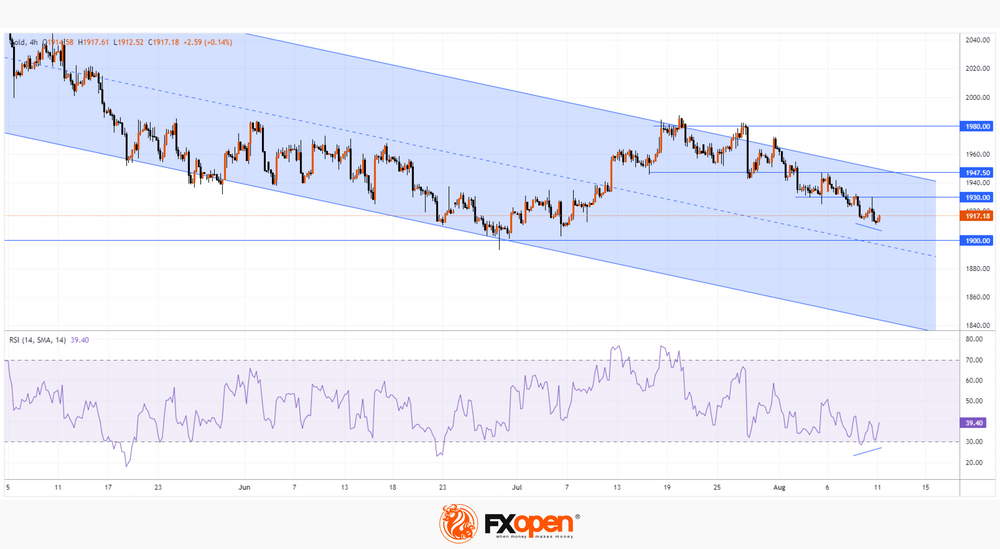
It is reasonable to assume that when approaching psychological support, the bears in the gold market will lose confidence, and therefore rebounds are possible. But in order for them to develop into a sustainable rally, it will probably take the impact of important news.
This article represents the opinion of the Companies operating under the FXOpen brand only. It is not to be construed as an offer, solicitation, or recommendation with respect to products and services provided by the Companies operating under the FXOpen brand, nor is it to be considered financial advice.
EUR/JPY Daily Outlook
Daily Pivots: (S1) 157.99; (P) 158.60; (R1) 159.56; More....
Intraday bias in EUR/JPY stays on the upside for the moment. Current up trend is in progress for 61.8% projection of 139.05 to 157.99 from 151.39 at 163.09 next. On the downside, below 157.73 minor support will turn intraday bias neutral and bring consolidations again first.
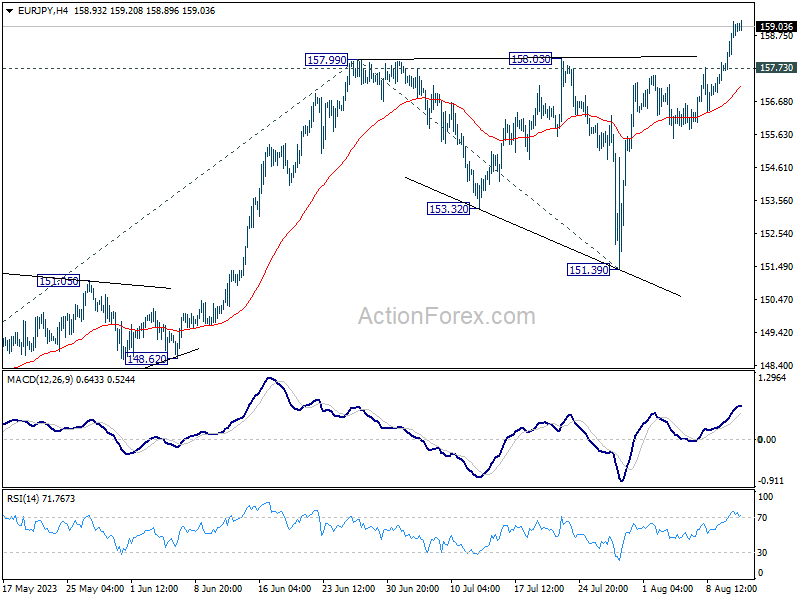
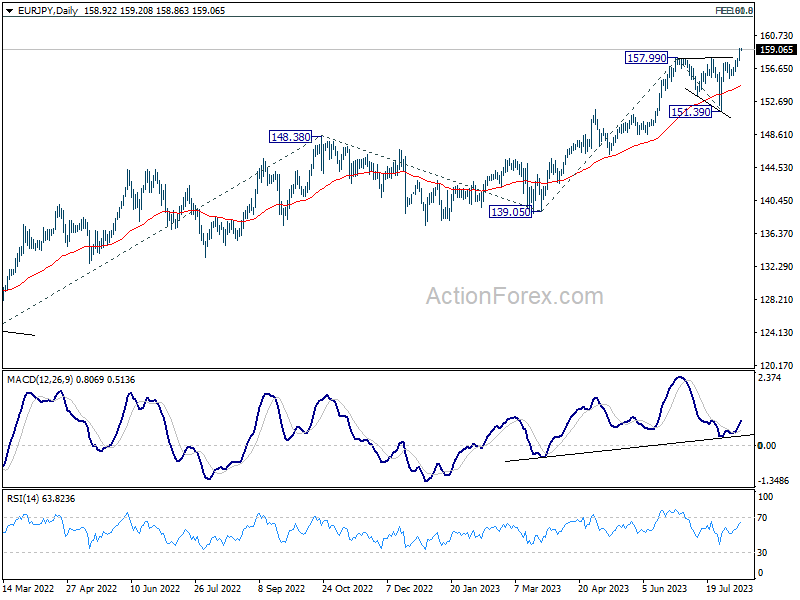
In the bigger picture, rise from 114.42 (2020 low) is in progress. Next target is 100% projection of 124.37 to 148.38 from 139.05 at 163.06. Sustained break there will pave the way to retest long term resistance at 169.96. This will now remain the favored case as long as 151.39 support holds, even in case of deep pull back.
GBP/JPY Daily Outlook
Daily Pivots: (S1) 182.70; (P) 183.47; (R1) 184.26; More...
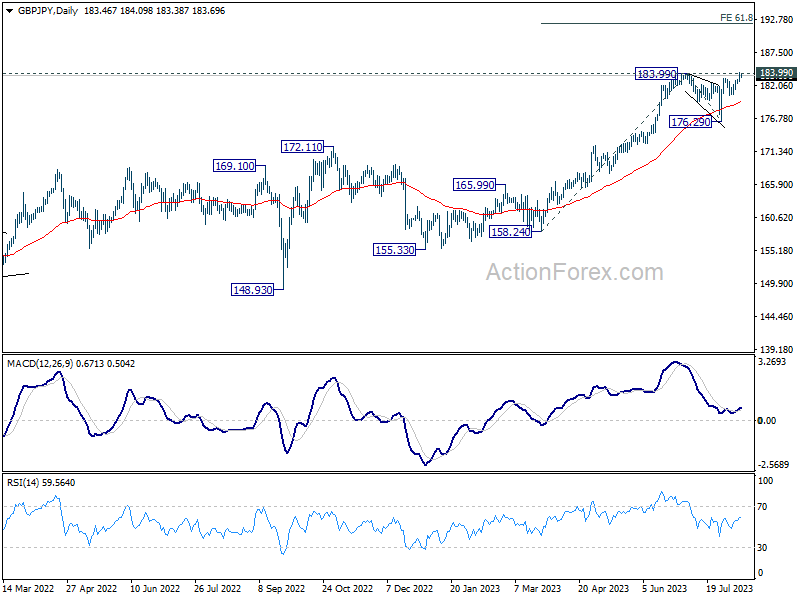
Intraday bias in GBP/JPY stays on the upside at this point. Decisive break of 183.99 will confirm larger up trend resumption. Next target is 61.8% projection of 158.24 to 183.99 from 176.29 at 192.20. For now, near term outlook will stay bullish as long as 180.41 support holds, in case of retreat.
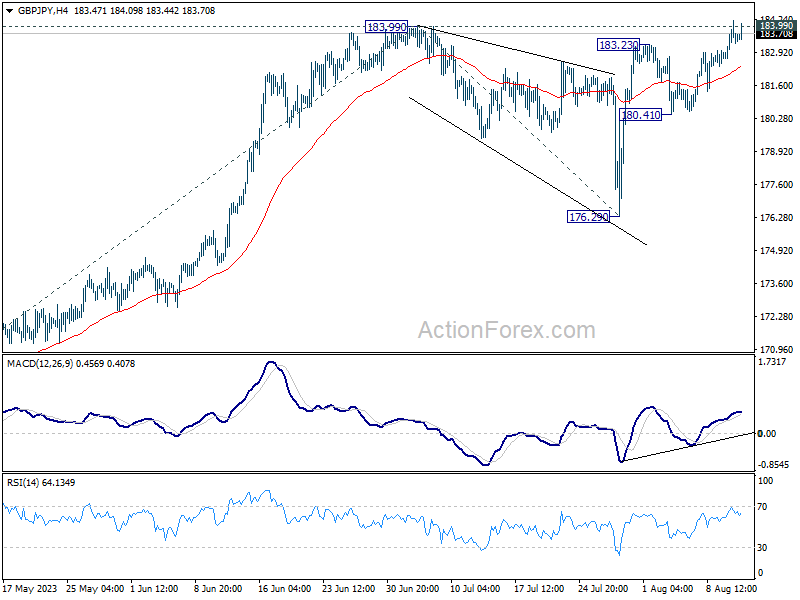
In the bigger picture, as long as 172.11 resistance turned support holds, up trend from 123.94 (2020 low) is expected to continue through 183.99 at a later stage, towards 195.86 (2015 high). Nevertheless, firm break of 172.11 will argue that larger correction is already underway.
EUR/AUD Daily Outlook
Daily Pivots: (S1) 1.6760; (P) 1.6808; (R1) 1.6903; More...
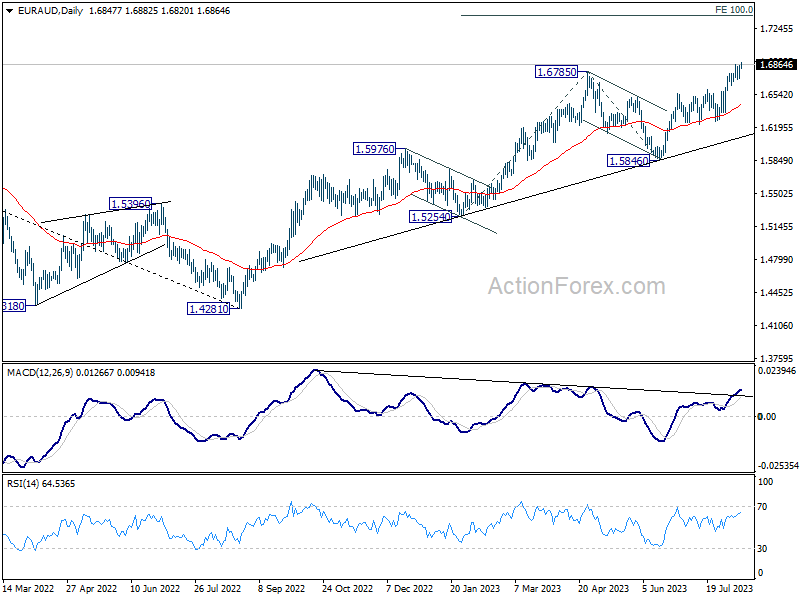
EUR/AUD's rally resumed by breaking through 1.6858 and intraday bias is back on the upside. Current rise from 1.4281 should target 1.7377 projection level next. On the downside, below 1.6708 minor support will turn bias neutral and bring consolidations again first.
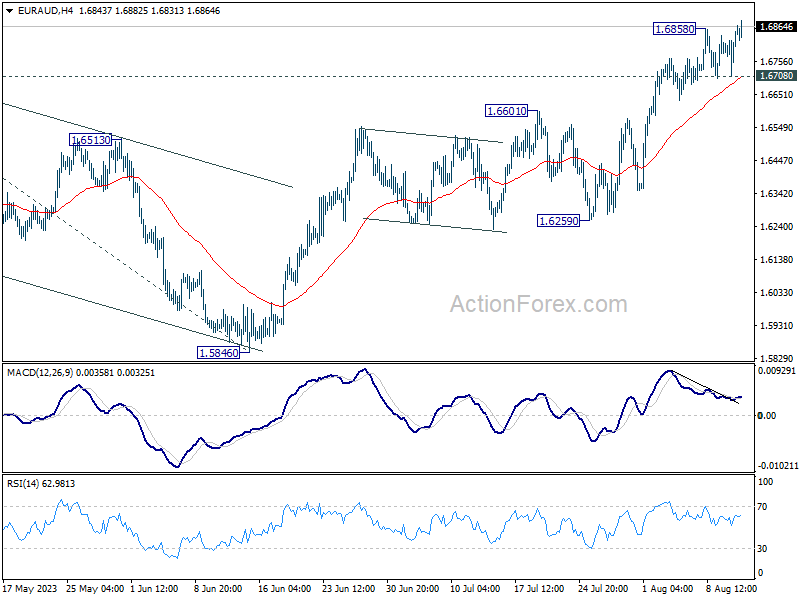
In the bigger picture, the rise from 1.4281 (2022 low) is in progress. Next target is 100% projection of 1.5254 to 1.6785 from 1.5846 at 1.7377. For now, outlook will stay bullish as long as 1.5846 support holds, even in case of another pull back.