Sample Category Title
Cliff Notes: Consumers Yet to Feel Relief
Key insights from the week that was.
Despite the RBA leaving policy unchanged for a second consecutive month, Westpac-MI Consumer Sentiment fell by 0.4% in August. At 81.0, the headline index suggests extreme pessimism remains firmly entrenched, with confidence at levels only seen during periods of major economic dislocation over the survey’s near fifty-year history.
With no constructive response to the RBA pause, it remains clear that fears around the interest rate outlook and cost-of-living pressures are continuing to weigh heavily. This is evident across many of the survey’s sub-indexes, with households’ assessment of economic conditions, family finances and spending intentions on ‘major household items’ all well below their long-run averages. Housing affordability is also a major concern, with house price expectations rising to a cycle-high whilst ‘time to buy a dwelling’ held at historic lows. This pressing reality will weigh on the housing market recovery into the medium-term.
The latest NAB business survey provided further confirmation of a slowdown in business conditions, the headline index down 1pt to +10 in July. An area of growing concern has been the deterioration in forward orders. Having remained in contraction for three consecutive months (–5 in May; –2 in June; –1 in July), the survey points to a subdued near-term outlook, particularly for retail. That said, the trends in overall business conditions look to be broad-based by industry and state. Given these circumstances, it is unsurprising that business confidence is soft and fragile, with a sustained reprieve unlikely in the months ahead.
Offshore, the key data for the week came from the US and China.
US CPI inflation met the market’s expectation in July, headline and core consumer prices rising a benign 0.2%. Annual headline inflation ticked higher given July 2022’s flat print, from 3.0%yr to 3.2%yr; but annual core inflation edged down, from 4.8%yr to 4.7%yr. The detail of the report was also constructive. Having been broadly unchanged April to May, the price of ‘food at home’ rose 0.3% in July, but this uptick was offset by a deceleration in ‘food away from home’ from 0.4% to 0.2%, signalling less pressure from wages growth.
Core prices meanwhile signalled a further softening in discretionary demand. For a second consecutive month, core goods prices declined, led lower by used car prices and as apparel prices held steady. For services, ‘lodging away from home’ fell 0.3% following a 2.0% decline in June. And airfares dropped 8.1% for a fourth consecutive decline. Helpfully, June’s step-down in shelter inflation was sustained in July; although, at almost 5% annualised, shelter inflation remains much higher than the pre-pandemic average near 3%.
In August, headline inflation is likely to be higher given the recent energy prices uptrend. And, over the next few months, core prices may also strengthen given the recent sizeable falls in a number of key sub-categories. But the trend into year-end continues to point towards six-month annualised inflation being around 2% at December, and annual inflation returning to target over the first half of 2024. Such an outturn would set the stage for rate cuts beginning March 2024 as per our forecast.
Turning the clock back to June, the US trade deficit narrowed to US$65.5bn largely due to a US$3.1bn drop in imports as exports slipped US$0.3bn. Slowing consumer demand saw most import categories tick down; however, there was notable strength in car imports as order backlogs are filled.
Over in Asia, China's annual inflation rate fell to –0.3%yr in July, the first annual deflation print outside of COVID since 2009. On a monthly basis, prices did rise 0.2% in July, but this followed five consecutive negative outcomes. Food prices were responsible for the annual decline, food prices falling 1.7%yr while CPI ex food was flat and CPI ex food and energy up 0.8%yr. The perspective given by services inflation is also constructive, the annual rate accelerating to 1.2%yr in July having averaged 0.9%yr the three months prior.
Still, a rapid reversal of recent weakness is highly unlikely. Excess capacity in the economy has meant that the reopening has not led to price pressures. With producer prices –4.4%yr, further disinflation for consumers in China and, via exports, across the world is still to come. The uptick in the input prices component of the manufacturing PMI to an expansionary 52.4 in July however suggests downside risks regards inflation and activity are receding.
The July trade surplus also received a lot of coverage this week as export and import growth plunged, respectively –14.5%yr and –12.4%yr (from –12.4%yr and –6.8%yr in June). Note though that the trade surplus actually widened from $70.6bn in June to $80.6bn in July. This is a striking outcome, only $20bn inside the peak trade surplus of mid-2022 and almost three times the average surplus of 2017-2019. Weakness in exports is broadly-based across all goods except transport, but stronger demand from Asian trade partners is compensating for weaker demand from Europe and the US.
CADCHF Wave Analysis
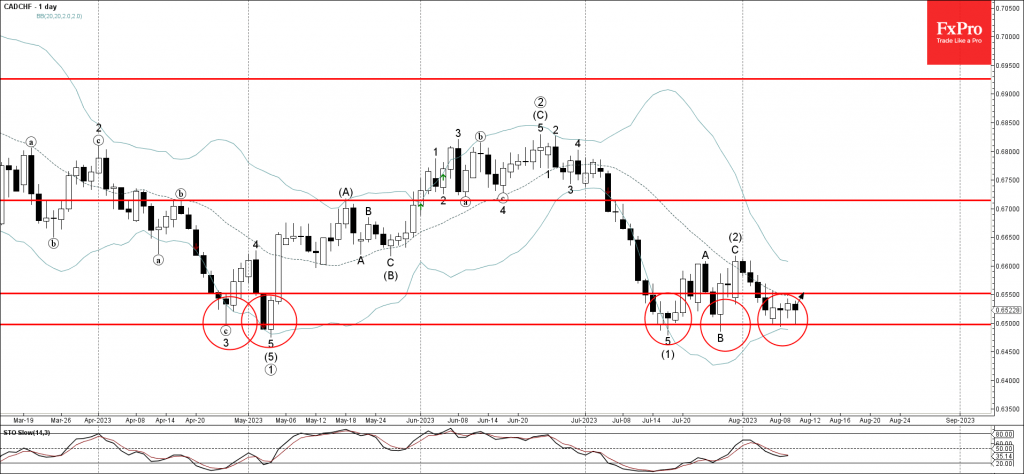
- CADCHF reversed from support level 0.6500
- Likely to rise to resistance level 0.6550
CADCHF currency pair today reversed up from the key support level 0.6500, which has been steadily reversing the price from the end of April.
The support level 0.6500 was strengthened by the nearby lower daily Bollinger Band.
Given the strength of the support level 0.6500, CADCHF can be expected to rise further toward the next resistance level 0.6550.
USDJPY Wave Analysis
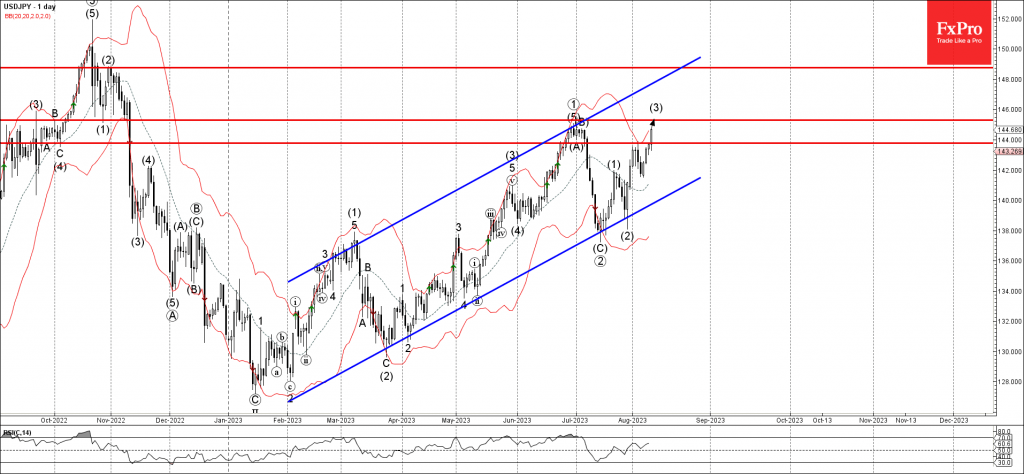
- USDJPY broke resistance level 143.80
- Likely to rise to resistance level 145.30
USDJPY currency pair recently broke the resistance level 143.80, which reversed the price strongly with the daily Evening Star at the start of this month.
The breakout of the resistance level 143.80 accelerated the active intermediate impulse wave (3).
Given the clear daily uptrend, USDJPY can be expected to rise further toward the next resistance level 145.30 (former monthly high from June).
Another Soft US Inflation Report, But Energy Costs in the Spotlight
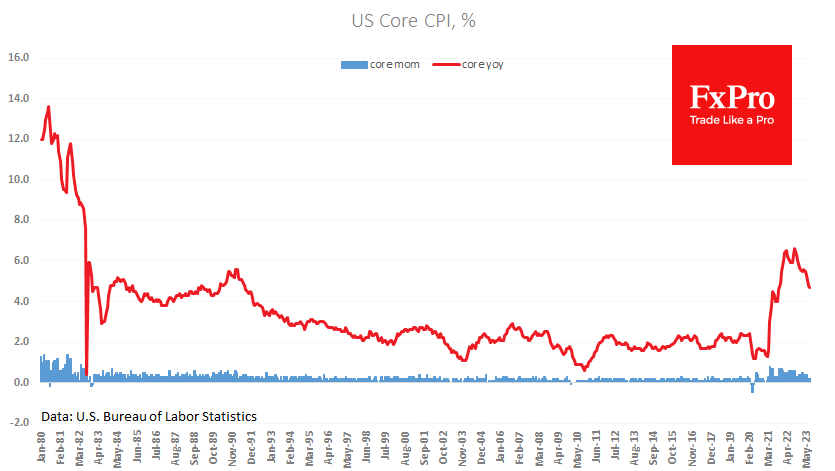
US CPI rose 3.2% y/y, slightly weaker than the 3.3% y/y expected. Core inflation slowed to 4.7% y/y, although analysts, on average, were looking for it to maintain its 4.8% y/y pace.
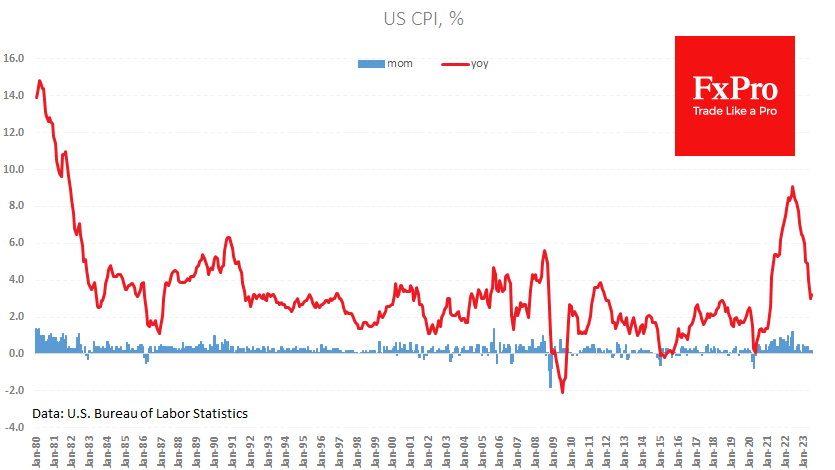
This is negative news for the USD and positive for equities as it allows the Fed to soften its rhetoric. The odds of a rate hike at the end of September fell to 7.5% immediately after the report, down from 14% the day before and over 22% two weeks ago.
The Dollar Index is down 0.4% on the day and briefly dipped to 101.6, repeating last Friday’s lows. US stock indexes accelerated their recovery amid the release, with S&P500 futures adding 0.3% to close above 4,500.
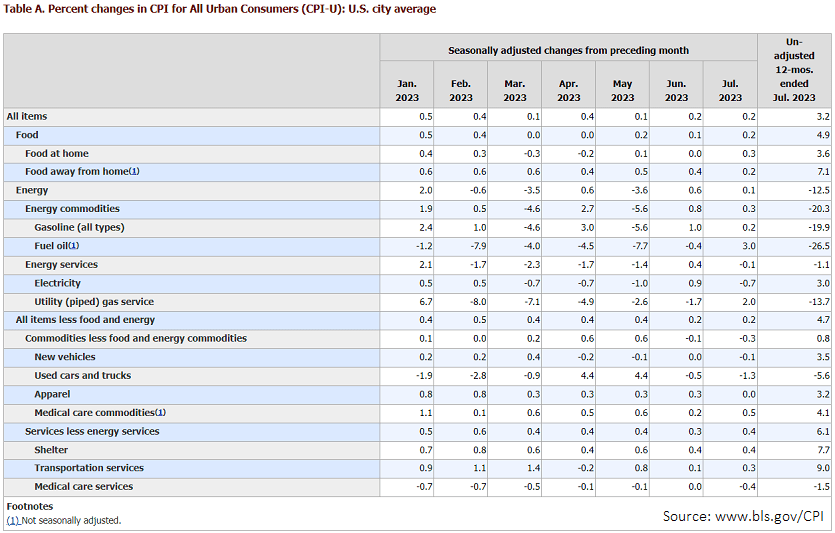
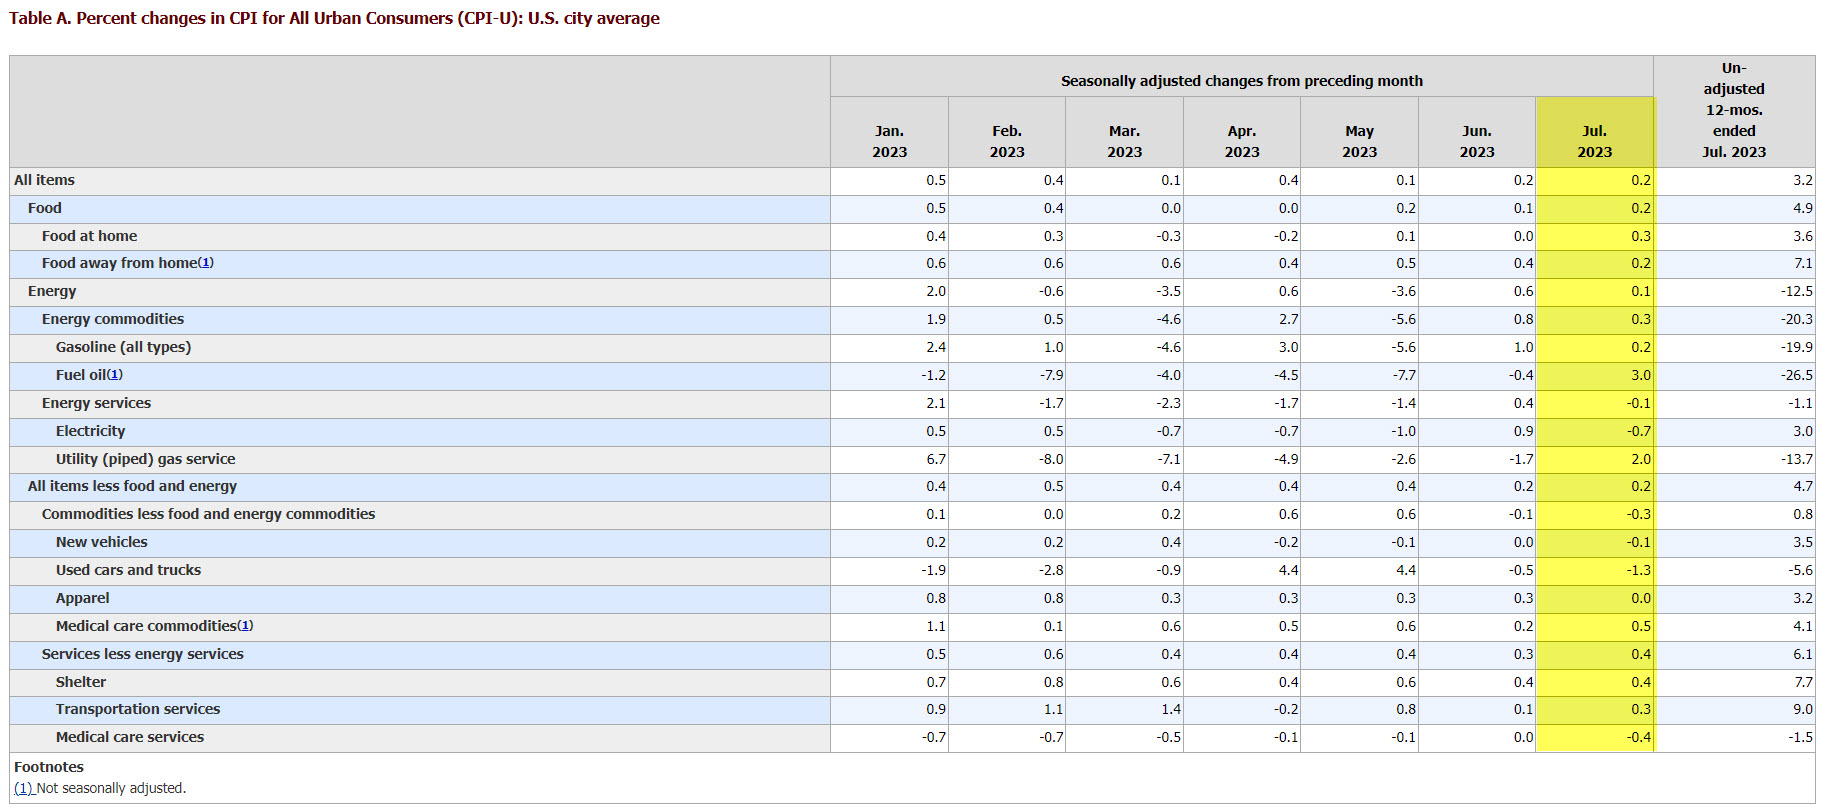
Annual inflation continues to be pushed up by services prices (+6.1% y/y), with housing costs up 7.7% y/y and transportation costs up 9.0%. Eating out is up by 7.1%, almost twice as much as eating in (3.6%). Price increases have been tempered by declines in fuel prices (-20.3% y/y), used cars (-5.6%) and medical expenses (-1.5%). However, fuel prices show signs of a turnaround, with the index up 3.0% m/m after a 16% jump in WTI last month.
Stocks have yet to prove their ability to rally and buck the downward trend since early August. The Nasdaq100, which is a more subtle reflection of fluctuations in risk appetite, has lost over 5% from its peak on the 19th of July to the lows on the 9th of August and is now trying to cling to an uptrend in the form of its 50-day moving average.
Dollar Drops as Inflation Continues to Cool; Fed September Skip Confirmed
- Dollar falls as Fed rate hike odds soften to 10% for September and 20.2% in November
- US Annual CPI rose from 3.0% in June to 3.2% in July, snapping a streak of 12 consecutive declines
- Core CPI (ex-food/energy) fell to 4.7% year-over-year, lowest reading since October 2021
No surprises from the July CPI report
After a roughly in-line inflation report, Wall Street remained optimistic that the Fed won’t need to raise rates in September. Headline inflation rose but that was mainly due to the large drop we saw last month from the base effects. Traders focused on the monthly readings and both headline and core saw gains held steady at 0.2%. Markets are growing confident that the Fed is done raising rates as risk appetite remains intact as stocks rally and the dollar drops. It doesn’t seem likely that we will see a reacceleration with prices given the weakening labor market and as lending takes a hit. The so-called super core services inflation gauge posted a 0.19% rise from a flat reading in June, but still well below last year’s half-percentage point pace.
Weekly jobless claims also came in higher than expected, which clearly supports the idea that the labor slowdown continues. The weekly first-time filings for unemployment reading rose from 227,000 to 248,000, while continuing claims edged lower from 1.692 million to 1.684 million.
The Fed will have an easy time at Jackson Hole as there wasn’t anything from both the NFP and CPI report that would move members to tightening in September. The focus for the market will shift to rate cuts becoming aggressively priced in for next year, something the Fed will try to push against.
Economic resilience
EUR/USD
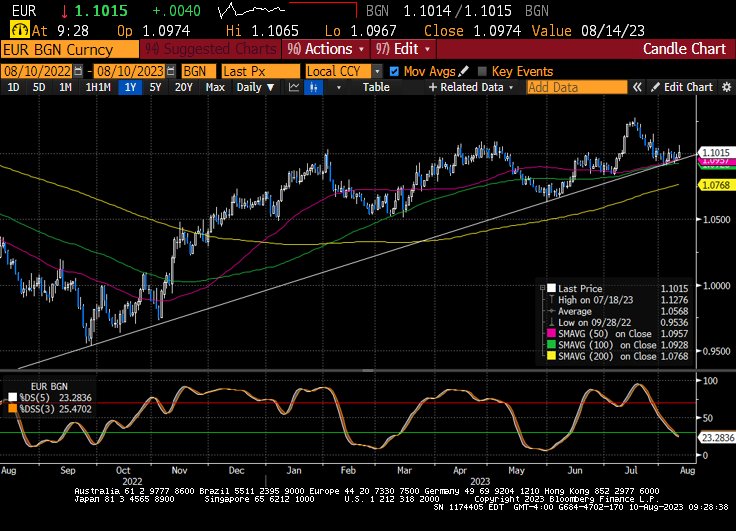
The euro pullback might be over as the risk of more Fed tightening will get pushed back a couple of months. The recent EUR/USD slide is hovering around a confluence of support that includes the 50- and -100 day SMAs and an uptrend support line that extends back to September 2022. If bullish momentum emerges, upside targets include the 1.1250 region. To the downside, 1.0928 provides initial support.
Markets Cheer Softening US Inflation
Risk assets are pointing to a positive US open after the just-released July CPI report. The subdued core print is especially encouraging, as it raises hopes that further Fed rate hikes are now off the table. US stock futures and gold are up, while the US dollar is threatening to erase all of this week’s gains.
Beyond this initial reaction, markets are cognizant that another set of jobs and inflation data are due prior to the Fed’s next rate decision in September. There is also the small matter of the Jackson Hole symposium at the end of this month where markets get to hear from Fed Chair Powell.
If the tier-one data for August continue to demonstrate that Fed policy tightening is having the desired effect of further subduing inflation, that should be cause for further rejoicing in the markets, as hopes for a “soft landing” will be fortified.
However, should the inflationary pulse threaten to make a comeback in the world’s largest economy, that may force the Fed into yet another hike later this year, a decision that would further curtail risk-taking in global financial markets.
USD/JPY Mid-Day Outlook
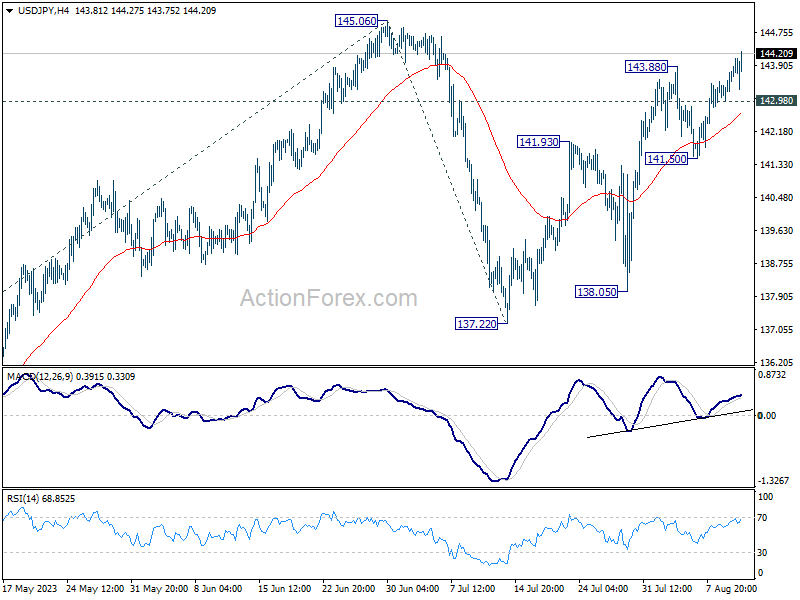
Daily Pivots: (S1) 143.24; (P) 143.49; (R1) 143.99; More...
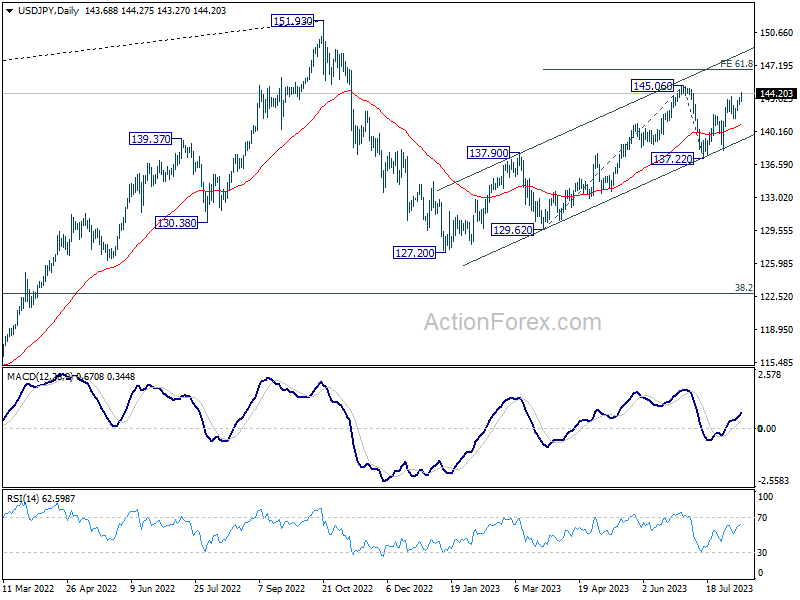
Intraday bias in USD/JPY remains on the upside for retesting 145.06. Decisive break there will resume whole rally from 127.20 and target 61.8% projection of 129.62 to 145.06 from 137.22 at 146.76. On the downside, however, below 142.92 minor support will turn intraday bias neutral again.
In the bigger picture, overall price actions from 151.93 (2022 high) are views as a corrective pattern. Rise from 127.20 is seen as the second leg of the pattern and could still be in progress. But even in case of extended rise, strong resistance should be seen from 151.93 to limit upside. Meanwhile, break of 137.22 support should confirm the start of the third leg to 127.20 (2023 low) and below.
USD/CHF Mid-Day Outlook
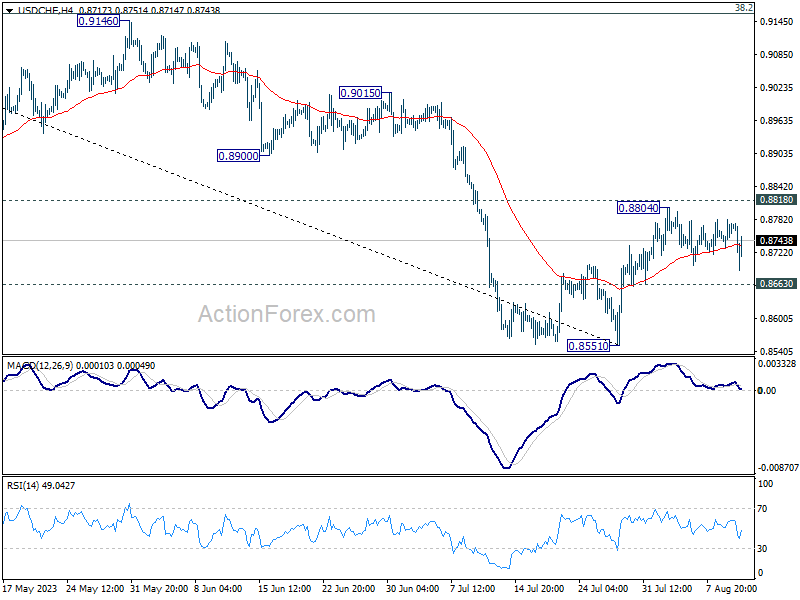
Daily Pivots: (S1) 0.8742; (P) 0.8762; (R1) 0.8793; More....
USD/CHF is extending sideway trading and intraday bias remains neutral. On the downside break of 0.8663 minor support should confirm rejection by 0.8818 and turn intraday bias back to the downside for retesting 0.8551 first. Nevertheless, decisive break of 0.8818 will carry larger bullish implication, and target 0.9146 cluster resistance next.
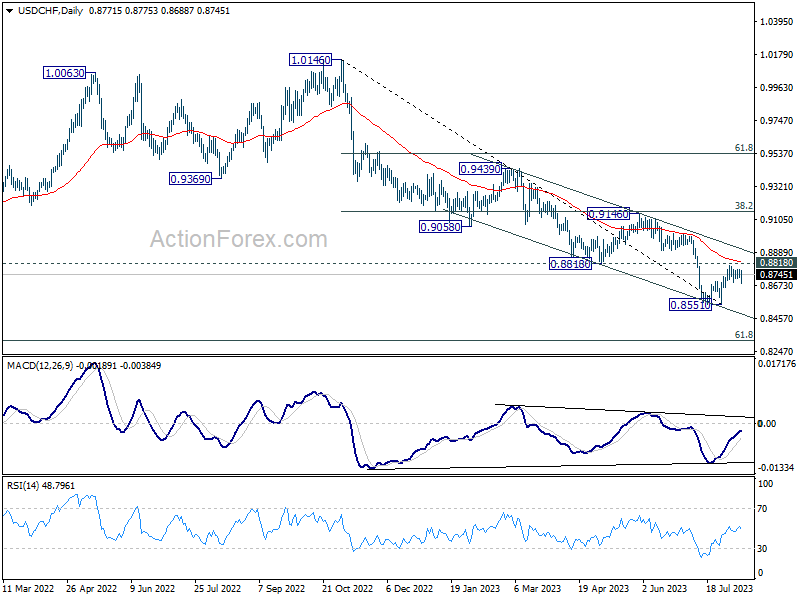
In the bigger picture, down trend from 1.0146 is seen as in progress as long as 0.8188 support turned resistance holds. Next target is 61.8% retracement of 0.7065 (2011 low) to 1.0342 (2016 high) at 0.8317. However, sustained break of 0.8818 should indicate medium term bottoming, and bring stronger rise back to 0.9146 cluster resistance (38.2% retracement of 1.0146 to 0.8551 at 0.9160), even as a correction.
GBP/USD Mid-Day Outlook
Daily Pivots: (S1) 1.2693; (P) 1.2737; (R1) 1.2763; More...
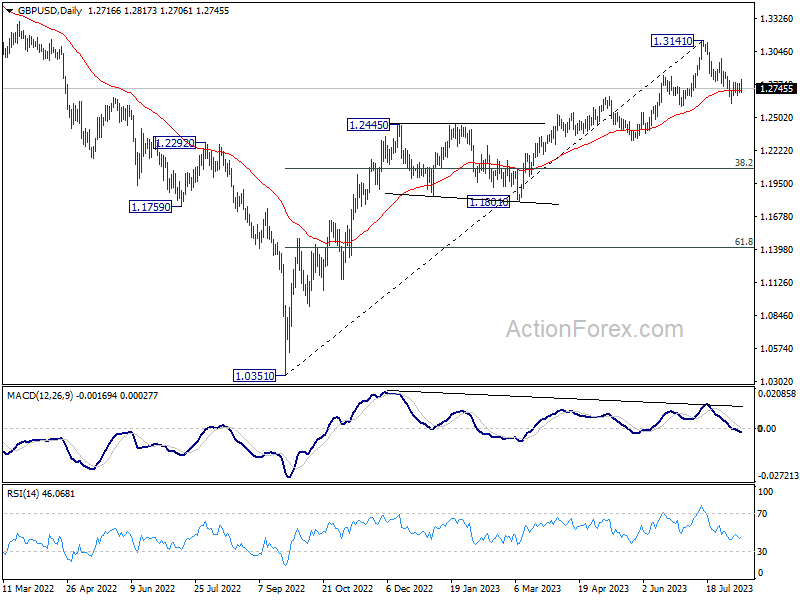
GBP/USD breached 1.2796 resistance briefly but failed to sustain above there. Initial bias stays neutral first. On the downside, below 1.2618, and sustained trading below 1.2678 resistance turned support will argue that it's already in a larger correction. Deeper decline would then be seen to 1.2306 support next. Nevertheless, firm break of 1.2796 will indicate that the pull back has completed, and turn bias back to the upside for stronger rebound.
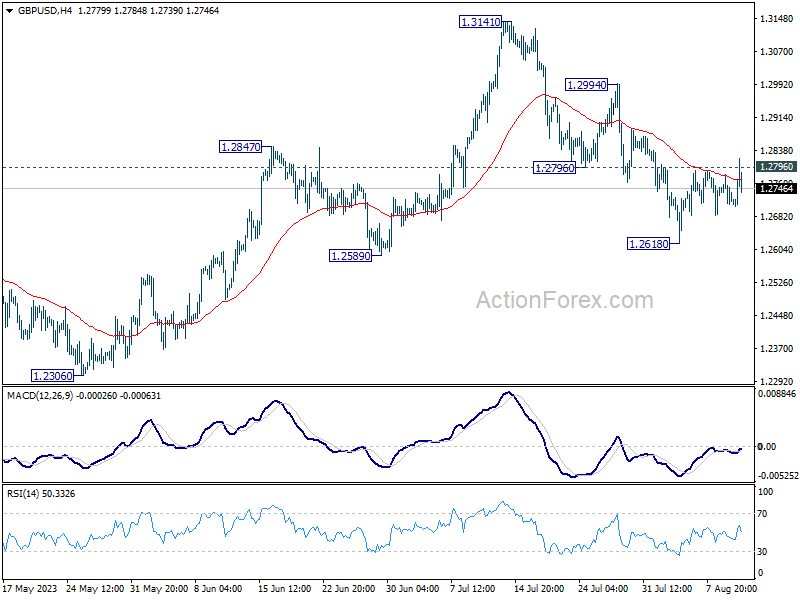
In the bigger picture, a medium term top could be in place at 1.3141 already, on bearish divergence condition in D MACD. Sustained trading below 55 D EMA (now at 1.2726) should confirm this case, and bring deeper fall to 38.2% retracement of 1.0351 to 1.3141 at 1.2075, as a correction to up trend from 1.0351 (2022 low). For now, rise will stay mildly on the downside as long as 1.3141 resistance holds, in case of strong rebound.