Sample Category Title
All Eyes on US CPI Report as Traders Weigh Up Whether Fed is Done With Rate Hikes
It's been a positive start to trading on Thursday, with European stock up around 1% and US futures not far behind.
Whether that will last into the end of the session may ultimately depend on the US inflation report, which is released shortly before the opening bell on Wall Street. It will take something big for the Fed to consider hiking again you would think, having shifted to a more gradual approach in recent months.
To hike again in September could alarm investors and suggest the central bank has a lot more to do which wouldn't really be consistent with headline inflation around 3% and core below 5%. A big spike in these, particularly the latter, could make investors nervous but it would need to be substantial to even consider raising again next month.
Another promising report, especially one that sees a beat on headline and core again, could see enthusiasm spread throughout the markets once more. Especially if the headline number slips below 3% which, from a psychological perspective could be a big moment. Suddenly the 2% target feels within reach, although in reality core running around 5% would indicate that's not sustainable.
Momentum wanes as oil trades around 2023 highs
Oil prices have stabilized again today after another choppy, albeit broadly bullish, start to the week. They're now trading around their highest levels for the year and you have to wonder whether the recent announcements from Saudi Arabia and Russia, combined with better economic prospects, will be enough to lift the price to new 2023 highs, and above $90 in the case of Brent.
One thing that is notable is the rally of the last couple of weeks has been accompanied by dwindling momentum. While not necessarily a bearish indicator in itself, it does suggest we may be seeing some profit-taking on approach to those highs and ahead of the CPI report. That could change after the release if we see a really promising report but for now, that divergence is undoubtedly a red flag.
Gold sell-off stalls ahead of June lows
Gold appears to be stabilizing a little ahead of the US CPI report, with traders paying close attention to the outcome as it could ultimately determine whether the yellow metal breaks the June lows or rebounds higher.
Prices have been pressured by rising yields and a stronger dollar recently as traders have pushed back expectations around rate cuts for next year. While they appear confident that the Fed is done with tightening - for now - they're less sure we'll see the kind of easing that they were so convinced of earlier in the year.
Another promising CPI release could change that and so today really is quite significant. There's still a long way to go but the US has made significant progress, even at the core level, and more is expected over the rest of the year. If it can do so at a more accelerated rate than currently envisaged then gold could prosper.
AUD/USD Rebounds as Inflation Expections Dip
- Australia’s inflation expectations ease
- US inflation is expected to rise to 3.3%
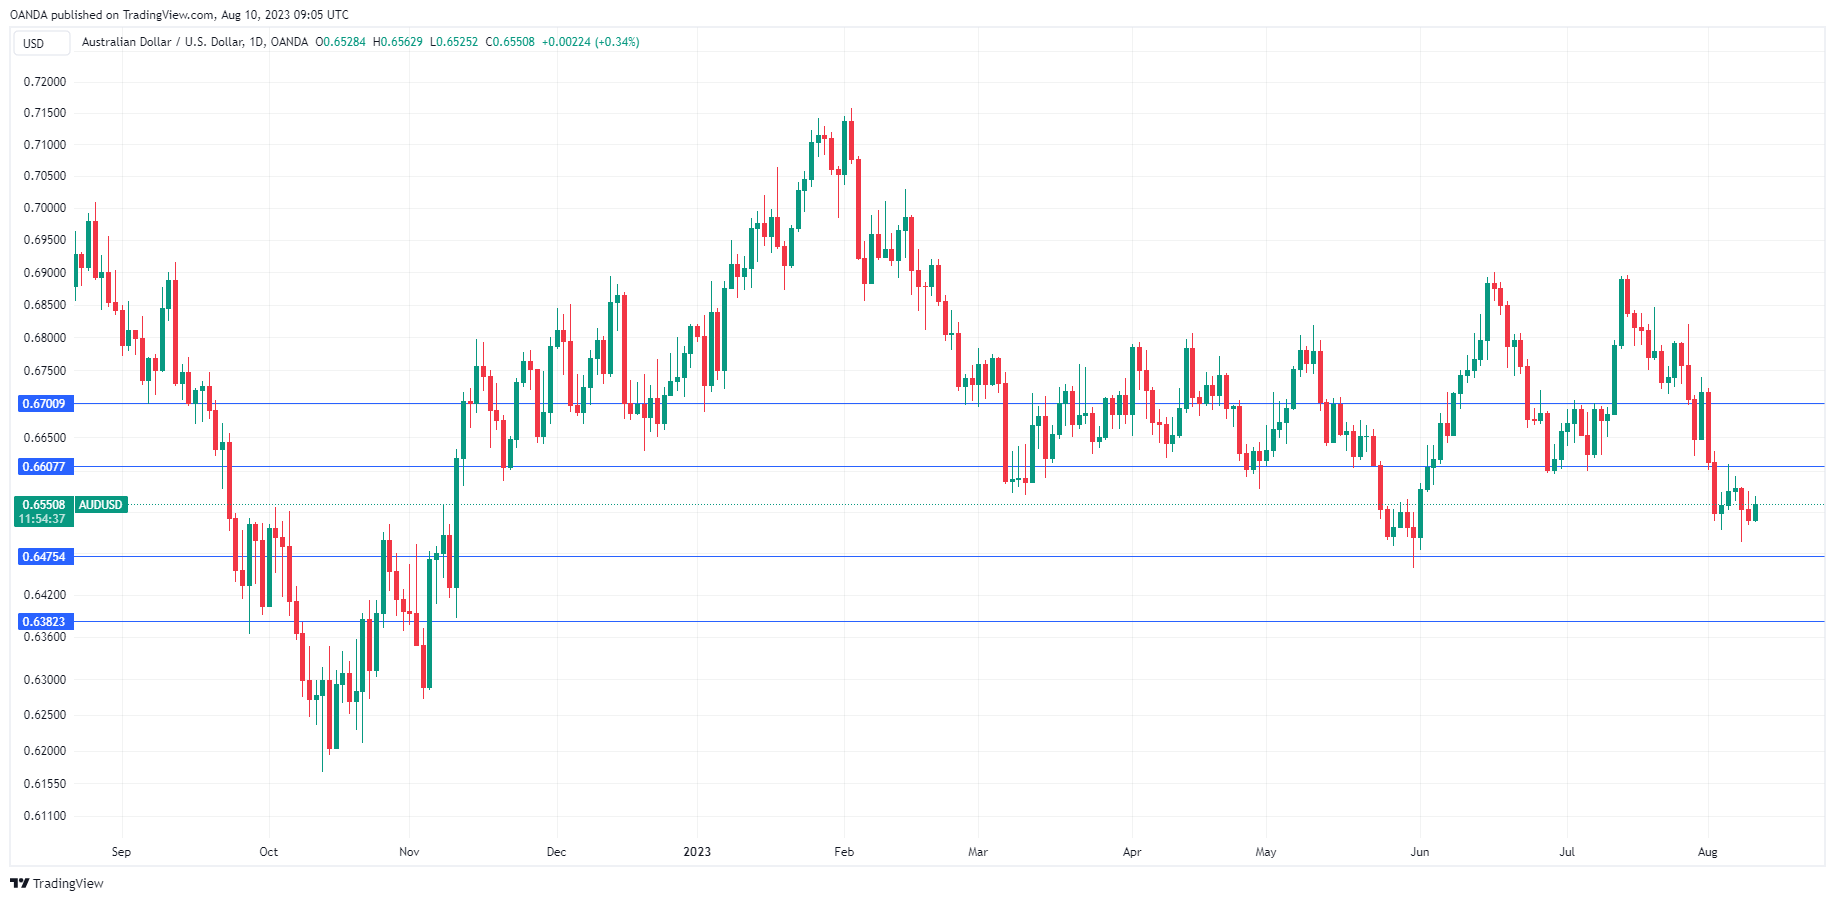
The Australian dollar is in positive territory on Thursday. In the European session, AUD/USD is trading at 0.6552, up 0.37%.
Australian inflation expectations ease
Australia’s consumer inflation expectations dipped in August to 4.9%, down from 5.3% in July. The good news? This marked the lowest level since April and supports the view that inflation has peaked. The bad news? Inflation expectations remain high and are well-embedded, which means that the downturn in inflation could be slow.
The Reserve Bank of Australia has forecast that inflation will drop to 3.25% by the end of 2o24 and won’t hit the 2%-3% target until late 2025. Last week, RBA’s policy statement noted that the central bank views inflation risks as “broadly balanced”, which means that the chances that inflation overshoots or undershoots the forecast are relatively even. However, the RBA also said that “if inflation expectations were to rise, the result would be even higher interest rates [and] a more substantial slowing in the economy”. The RBA added that inflation, which has fallen to 6% is “too high”.
China and the ‘D’ word
China’s economy has fallen into deflation, as CPI declined 0.3% in July. The last time inflation declined was in February 2021. China’s economic recovery has been tepid and exports and imports fell in July. This could spell bad news for Australia, which exports gold, iron ore and petroleum gas to China. Weaker demand for Australian exports will likely weigh on the weak Australian dollar, which is down 2.4% in the month of August. A possible silver lining to Chinese deflation is that it could lower global inflation, helping central banks in the battle to bring inflation back to around 2%.
US inflation expected to accelerate
The US releases the July inflation report later today. The Fed has achieved much of its objective in wrestling inflation to lower levels. Inflation, which hit a record high of 9.1% in July 2022, is currently at 3%. The Fed wants to finish the job and bring inflation back to the 2% target, but that could prove a difficult task. Headline inflation is expected to accelerate to 3.3% in July, up from 3.0% in June. Core inflation, which the Fed pays particular attention to, is expected to remain at 4.8%. The Fed rate hike odds remain very low for September (14%) and unless there is a nasty surprise to the upside from today’s inflation data, the release should cement a pause at the September meeting.
AUD/USD Technical
- There is resistance at 0.6607 and 0.6700
- 0.6475 and 0.6382 are providing support
WTI Oil Futures Finally Snap Long-Term Barrier
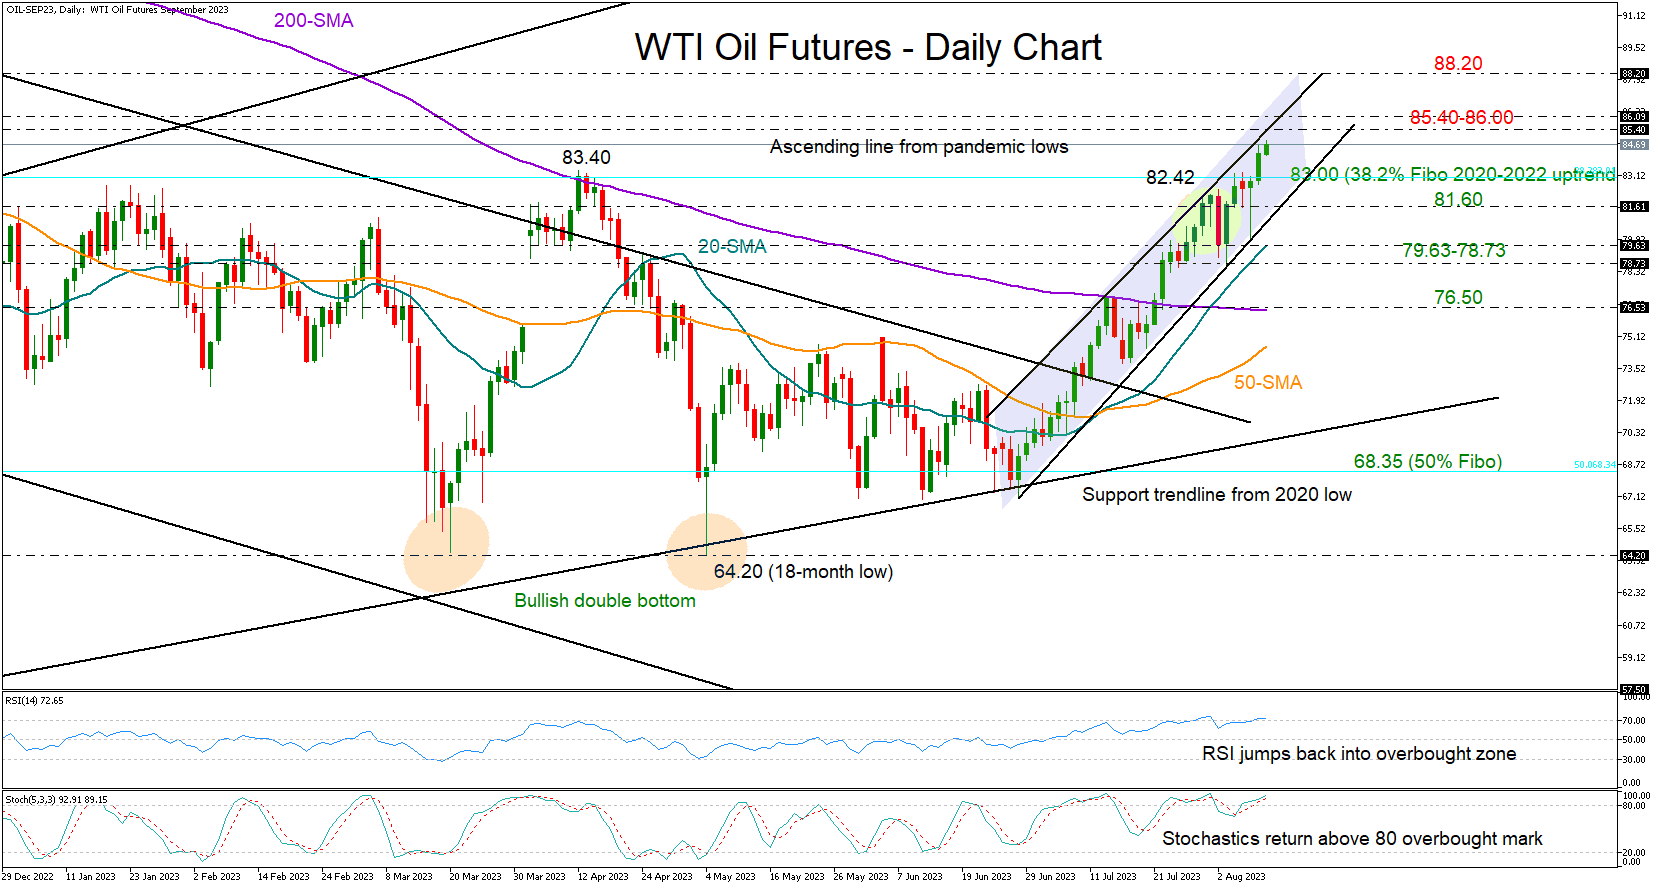
WTI oil futures snapped the 83.40 resistance on Wednesday, exiting marginally the long-term range area to reach a new high of 84.71 today.
The RSI and Stochastic oscillator are in the overbought zone, indicating the short-term bullish trend may stall soon as the price nears the upper limit of the upward-sloping channel at 85.40.
Should the bulls run above 85.40, claiming the 86.00 round level too, the door will open for the 88.20 barrier taken from the second half of 2022. The 92.50 bar, where the bulls paused in November 2022, could be the next target.
Alternatively, a downside reversal could see a retest of the 83.00-83.40 region, where the 38.2% Fibonacci retracement of the 2020-2022 uptrend is placed. If the price goes further down, it could hit the channel’s lower boundary at 81.60, a break of which could confirm another drop, probably towards the support zone of 79.63-78.73. From there, it might continue to fall towards the 200-day SMA at 76.50.
In short, the clear close above 83.40 is a bullish development for WTI oil futures, boosting optimism that the upward pattern could expand in the coming sessions. Yet, with the price trading slightly below a critical resistance area, another downside correction within the channel cannot be ruled out before buyers retake control again.
EURGBP Downward Trend Might Not Have Run Its Course
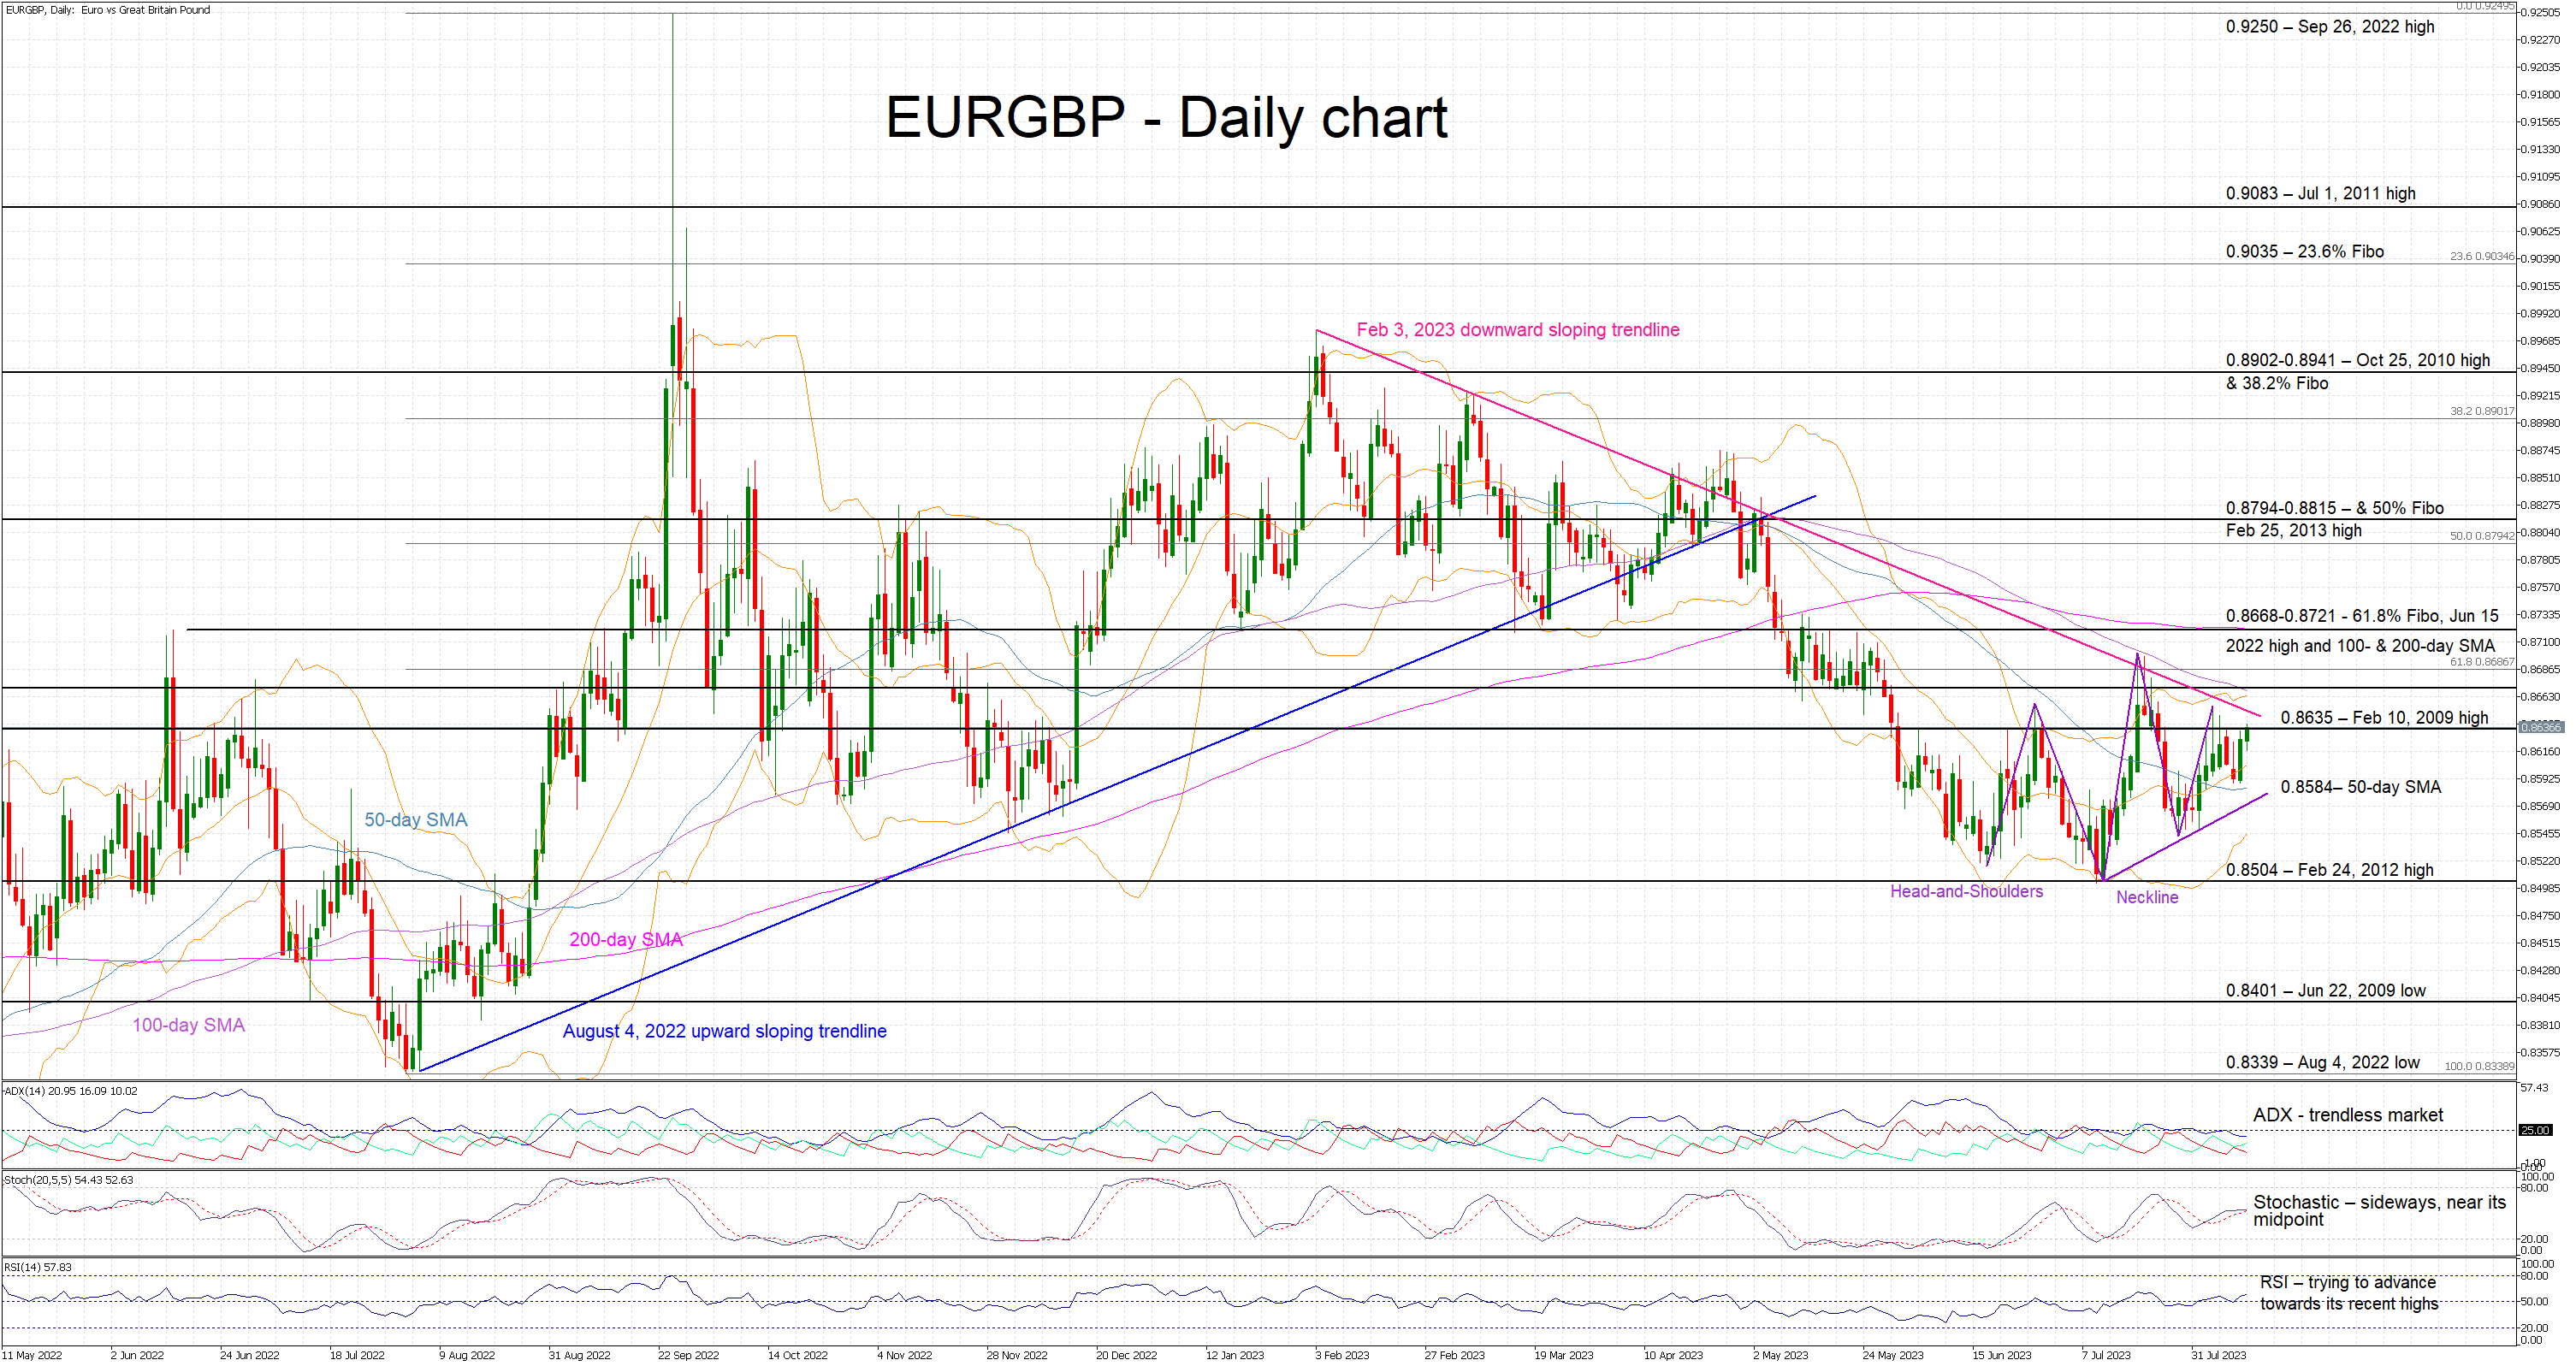
EURGBP is edging higher today, battling with the 0.8635 level again. The aggressive sell-off from the February 2023 highs has probably halted as this pair has been hovering inside the 0.8504-0.8700 range for the past three months. The recent price action is giving rise to a plethora of patterns with the most prominent being a head-and-shoulders structure with the neckline currently residing at the 0.8580 area.
The momentum indicators appear equally range-bound at this juncture. The Average Directional Movement Index (ADX) is hovering below its 25-threshold, signaling a range-trading market, and the stochastic oscillator is trading sideways, a tad above both its moving average and midpoint, and seeking its next move. Interestingly, the RSI remains above its 50-midpoint and is trying to stage a move towards the July 20 highs. However, it seems to lack the necessary strength for such an advance.
Should the bulls ignore the muted signals, they would try to overcome the February 10, 2009 high at 0.8635 and the February 3, 2023 downward trendline, and gradually retest the busy 0.8668-0.8721 area. This is populated by the 61.8% Fibonacci retracement of the August 4, 2022 – September 26, 2022 uptrend, the June 15, 2022 high, and the respective 100- and 200-day simple moving averages (SMAs). This is a key area for short-term sentiment and if successfully broken, it would open the door for another upleg towards the 0.8800 region.
On the flip side, the bears are trying to take advantage of the developing head-and-shoulders structure by pushing EURGBP below the pattern’s neckline and the 50-day SMA. Such a move will probably then allow the bears to target the February 24, 2012 high at 0.8504, giving them the chance to record a new 2023 low. Even lower, the 0.8401 level looks like a plausible area for the bulls to set up their defense.
To sum up, EURGBP remains mostly directionless amidst the summer lull. The bears are trying to take advantage of a developing bearish pattern but their determination for a sizeable pullback will quickly be put to the test.
Australian Dollar Retreats Over Lower Consumer Inflation Expectations
AUD/USD struggles to rebound
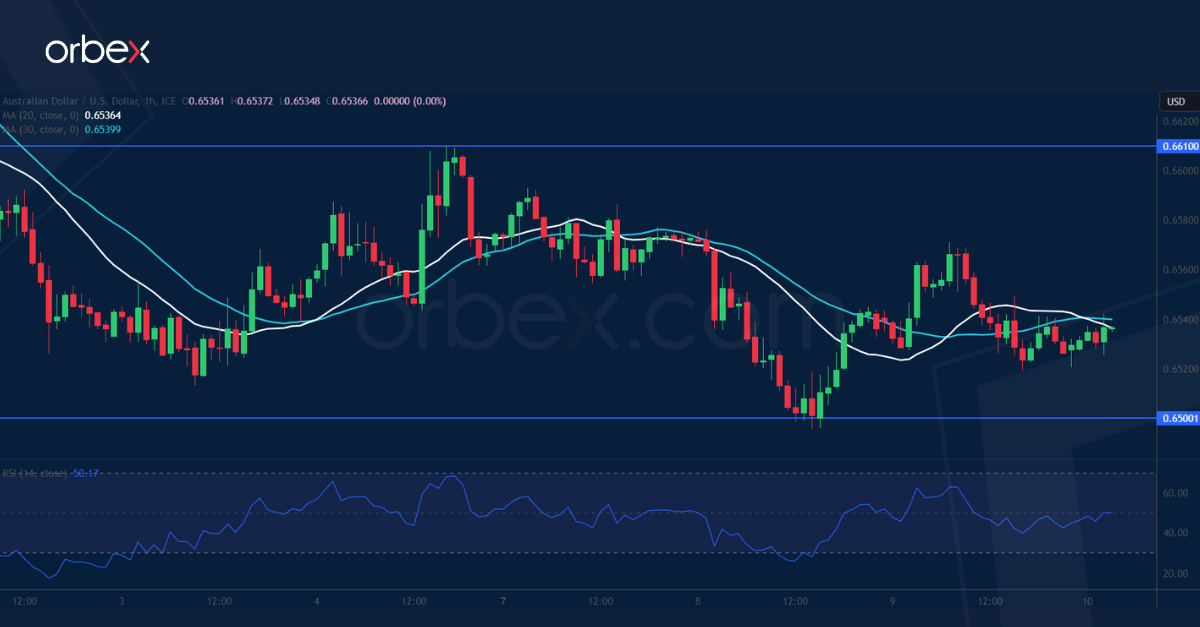
The Australian dollar retreats over lower consumer inflation expectations. On the daily chart, the price is in a M-shaped consolidation, indicating that the aussie is at a crossroads after it gave back all the gains from the June rally. 0.6500 is the current support as the RSI’s double dip into the oversold area was met with some bargain hunting bids. The buy side will need to clear the support-turned-resistance of 0.6610 to ease the downward pressure. Otherwise, the pair could be vulnerable to a liquidation below 0.6450.
NZD/USD continues lower
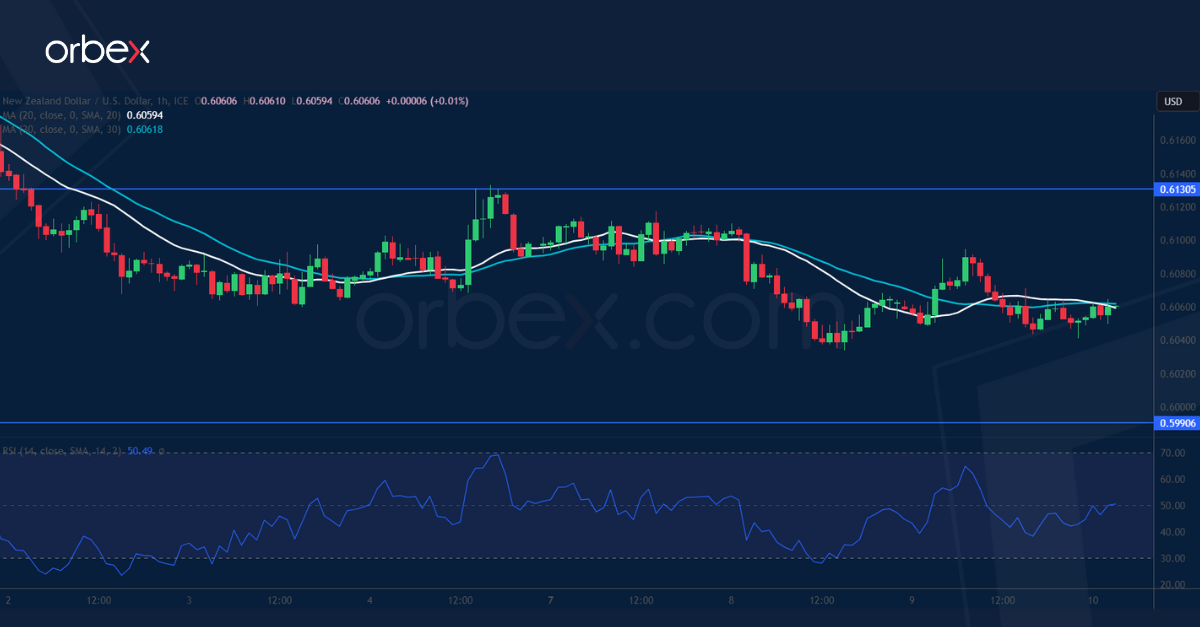
The New Zealand dollar softens as inflation expectations show signs of easing. A drift below the daily swing low of 0.6060 has put those who bought along the summer rally on the defensive. The area between June’s low of 0.5990 and the psychological level of 0.6000 is critical in keeping the kiwi afloat for the coming days as its breach could trigger an extended sell-off towards 0.5800. The RSI’s oversold condition has attracted some buying but 0.6130 is the first hurdle to lift before a sustained rebound could materialise.
FTSE 100 bounces back
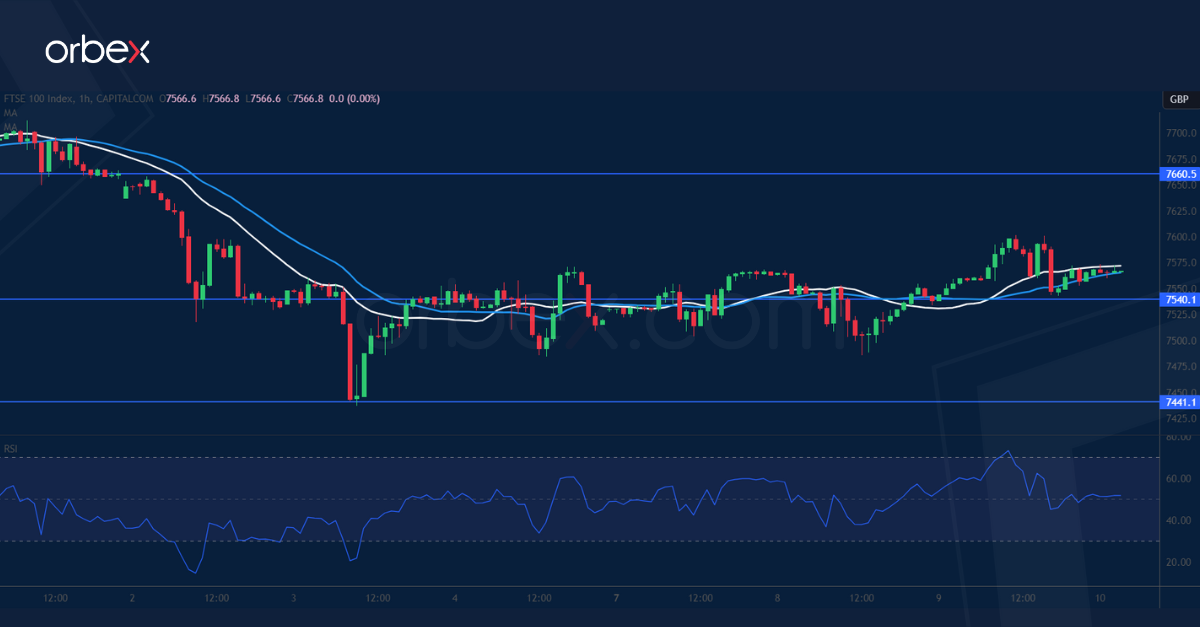
The FTSE finds support from commodity stocks in the hope of economic stimulus in China. The pullback has met buying interests in the demand zone 7400-7500 from the start of the breakout rally in mid-July, and a close above the first resistance of 7600 prompted short-term sellers to trim their bets, opening the door to a potential recovery. 7660 right below the recent peak could be the bears’ last stronghold and a bullish breakout would provide confirmation. 7540 is the first support as the RSI shows an overbought situation.
SPX Pullback In Wave 4 Should Find Support Again
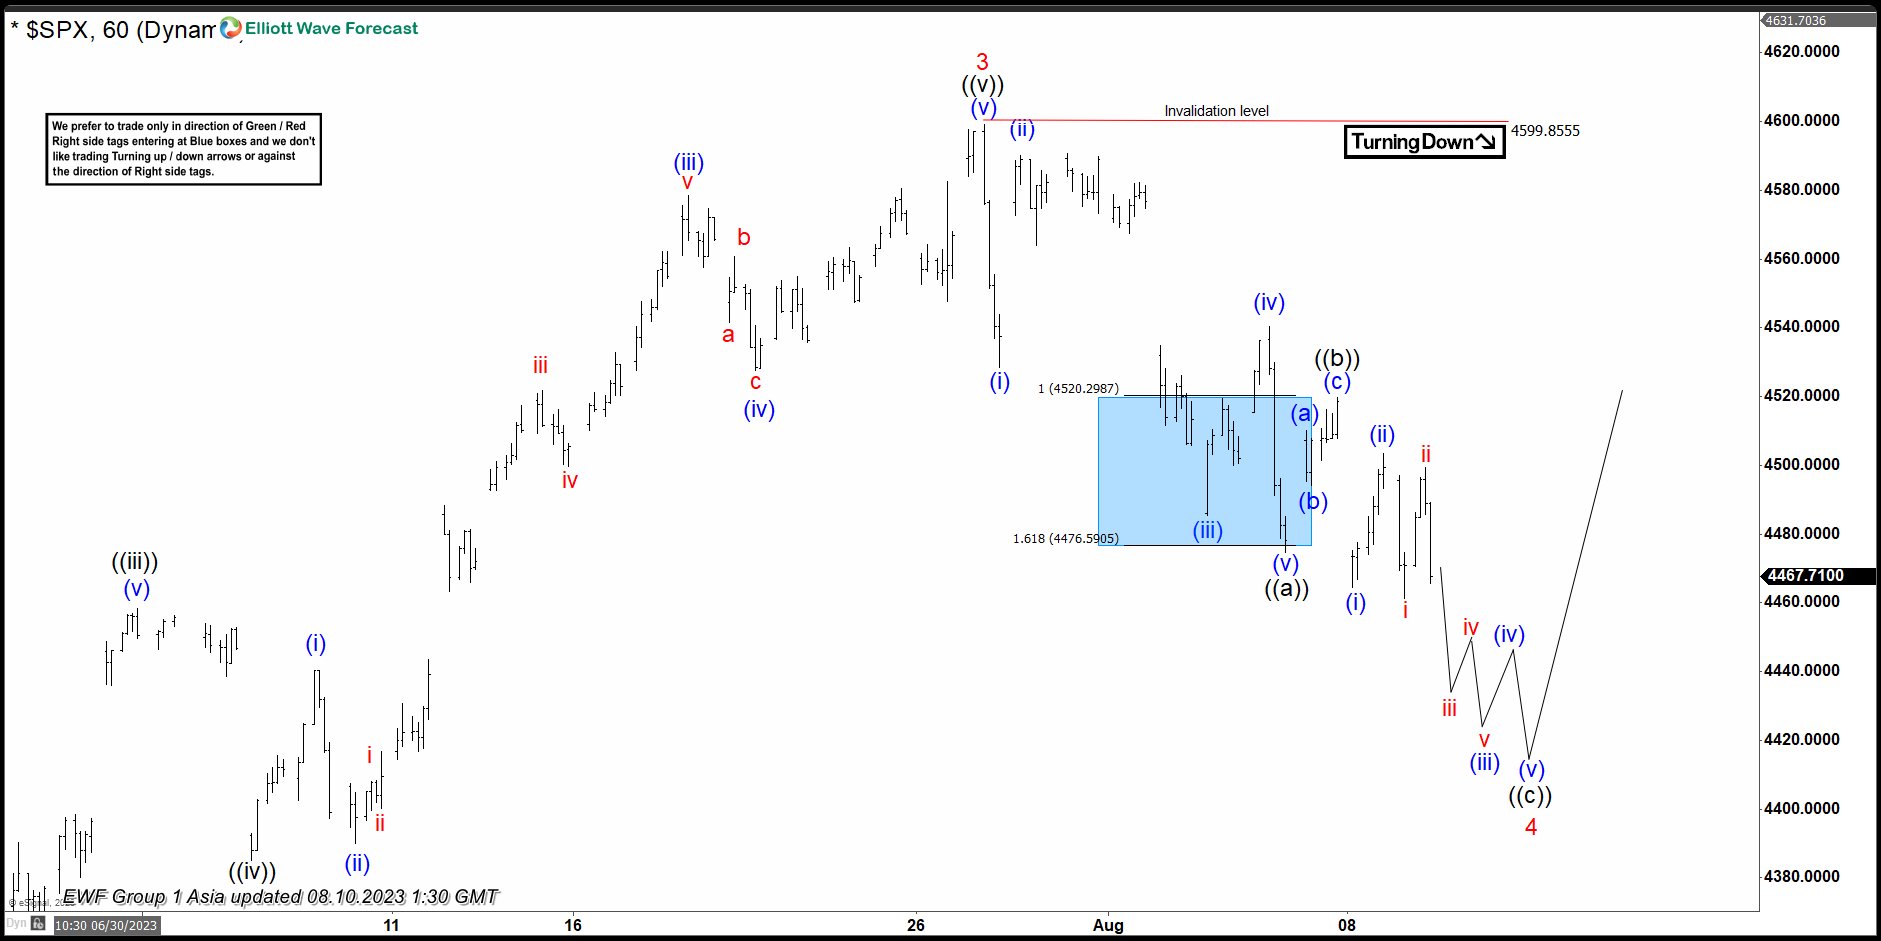
The short-term Elliott wave view in S&P 500 (SPX) suggests that the rally from the 3.13.2023 low unfolded as a 5 waves impulse structure. Up from 3.15.2023 low, wave ((i)) ended at $4186.92. Dip in wave ((ii)) ended at $4048.28 low and the rally to $4458.48 high ended wave ((iii)). Down from there, the pullback to 4385.05 low & started the wave ((v)) higher. Up from there, wave (i) ended at $4440.39, and a pullback in wave (ii) ended at $4389.92. Index extends higher in wave (iii) towards $4578.43 and dip in wave (iv) ended at $4527.56 high.
The final leg higher wave (v) ended at $4599.85 high, which completed wave 3 & also the cycle from 3.15.2023 low. Below from there, the index is doing a pullback in wave 4, which is expected to find support in 3, 7, or 11 swings for further upside. Down from wave 3, the pullback is unfolding as Elliott wave zigzag correction where wave ((a)) ended at $4474.55 low. Then wave ((b)) bounce ended at $4519.84 high and ((c)) is expected to extend lower towards $4394.65- $4317.36 100%-161.8% Fibonacci extension area of ((a))-((b)). Also, wave 4 typically ends somewhere at the 23.6 – 38.2% Fibonacci retracement of wave 3. That area comes at $4419.19 – $4308.22, which also coincides with the 100%-161.8% Fibonacci extension area of ((a))-((b)) as well. From there, the Index can find buyers for further upside.
SPX 1 Hour Elliott Wave Chart From 8.10.2023
SPX Elliott Wave Video
https://www.youtube.com/watch?v=BpyKQ--laoU
USD/JPY Daily Outlook
Daily Pivots: (S1) 143.24; (P) 143.49; (R1) 143.99; More...
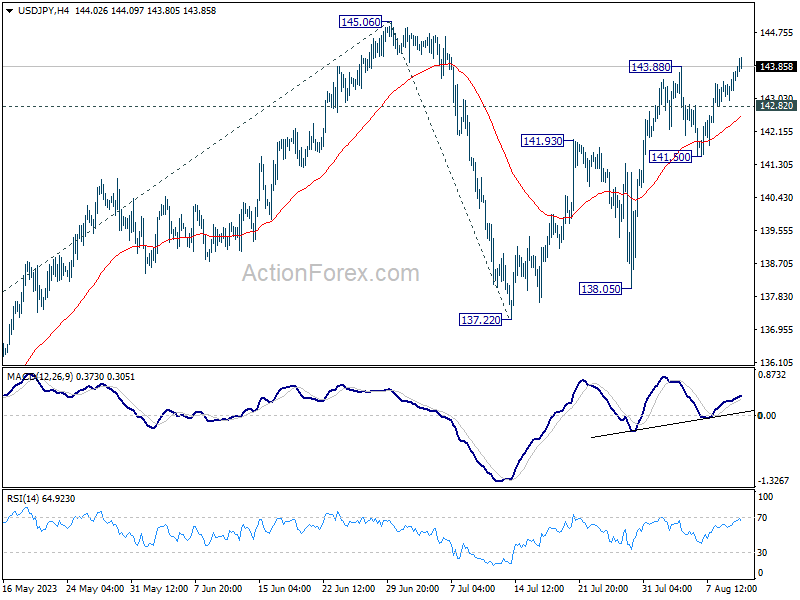
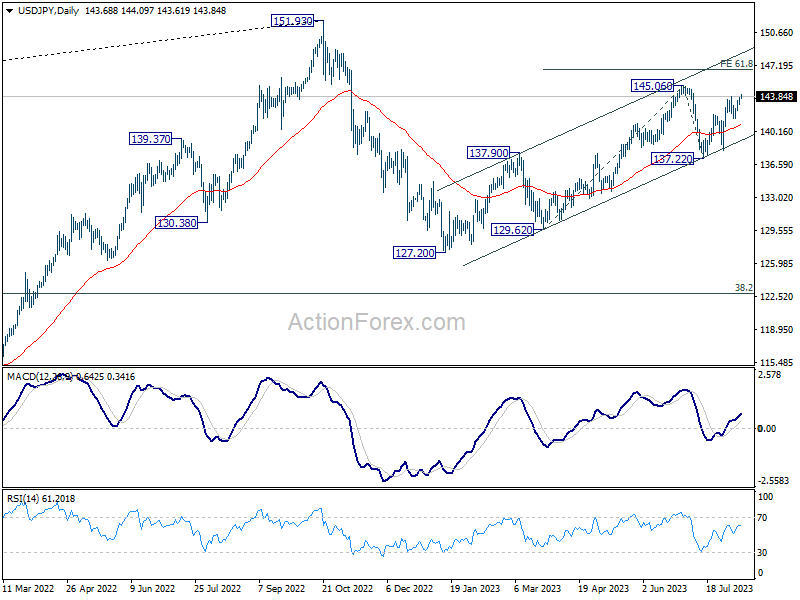
USD/JPY's rally from 137.22 resumes by breaking through 143.88 and intraday bias is back on the upside. Firm break of 145.06 will resume whole rally from 127.20 and target 61.8% projection of 129.62 to 145.06 from 137.22 at 146.76. On the downside, however, below 142.82 will turn intraday bias neutral again.
In the bigger picture, overall price actions from 151.93 (2022 high) are views as a corrective pattern. Rise from 127.20 is seen as the second leg of the pattern and could still be in progress. But even in case of extended rise, strong resistance should be seen from 151.93 to limit upside. Meanwhile, break of 137.22 support should confirm the start of the third leg to 127.20 (2023 low) and below.
USD/CHF Daily Outlook
Daily Pivots: (S1) 0.8742; (P) 0.8762; (R1) 0.8793; More....
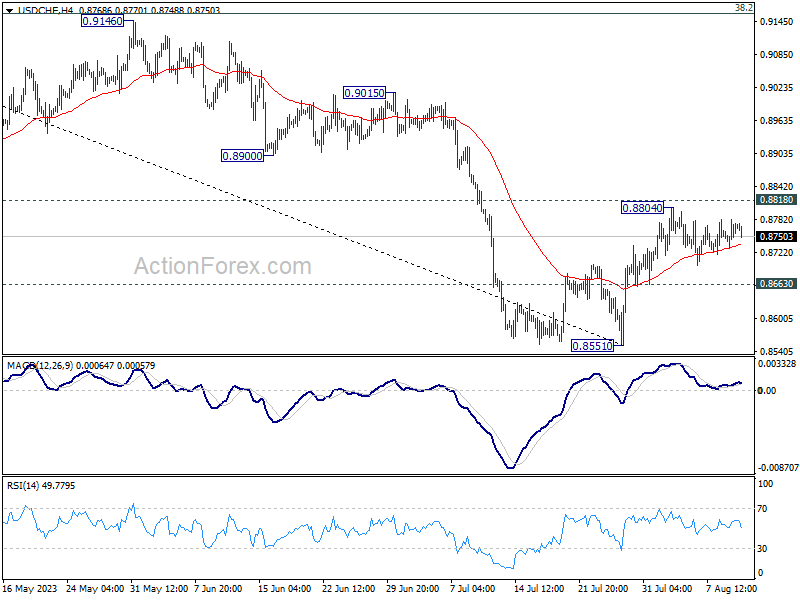
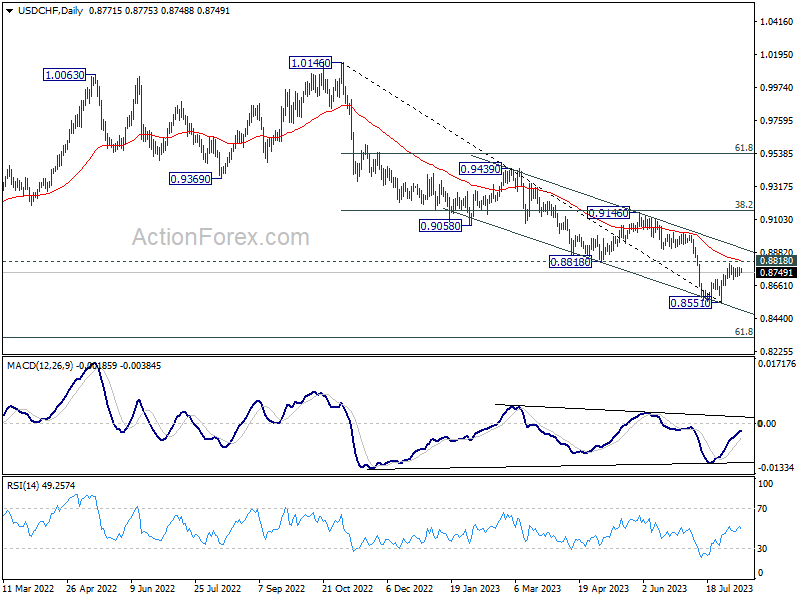
Intraday bias in USD/CHF stays neutral for the moment and outlook is unchanged. On the downside break of 0.8663 minor support should confirm rejection by 0.8818 and turn intraday bias back to the downside for retesting 0.8551 first. Nevertheless, decisive break of 0.8818 will carry larger bullish implication, and target 0.9146 cluster resistance next.
In the bigger picture, down trend from 1.0146 is seen as in progress as long as 0.8188 support turned resistance holds. Next target is 61.8% retracement of 0.7065 (2011 low) to 1.0342 (2016 high) at 0.8317. However, sustained break of 0.8818 should indicate medium term bottoming, and bring stronger rise back to 0.9146 cluster resistance (38.2% retracement of 1.0146 to 0.8551 at 0.9160), even as a correction.
GBP/USD Daily Outlook
Daily Pivots: (S1) 1.2693; (P) 1.2737; (R1) 1.2763; More...
Intraday bias in GBP/USD stays neutral and outlook is unchanged. On the downside, below 1.2618, and sustained trading below 1.2678 resistance turned support will argue that it's already in a larger correction. Deeper decline would then be seen to 1.2306 support next. Nevertheless, firm break of 1.2796 will indicate that the pull back has completed, and turn bias back to the upside for stronger rebound.
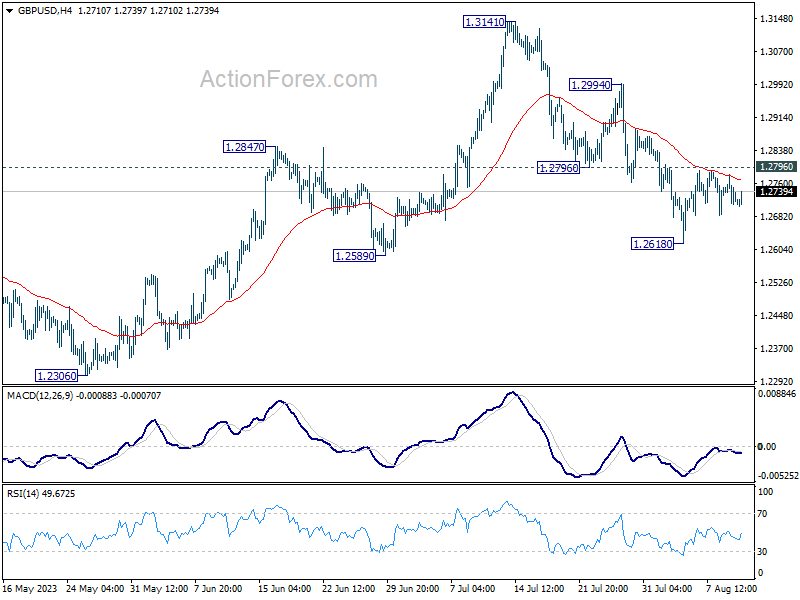
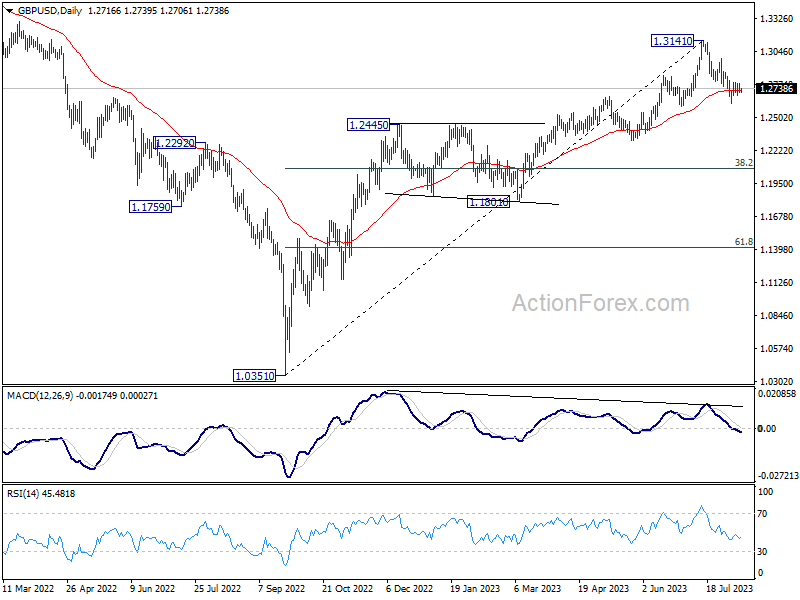
In the bigger picture, a medium term top could be in place at 1.3141 already, on bearish divergence condition in D MACD. Sustained trading below 55 D EMA (now at 1.2726) should confirm this case, and bring deeper fall to 38.2% retracement of 1.0351 to 1.3141 at 1.2075, as a correction to up trend from 1.0351 (2022 low). For now, rise will stay mildly on the downside as long as 1.3141 resistance holds, in case of strong rebound.
EUR/USD Daily Outlook
Daily Pivots: (S1) 1.0952; (P) 1.0974; (R1) 1.0995; More...
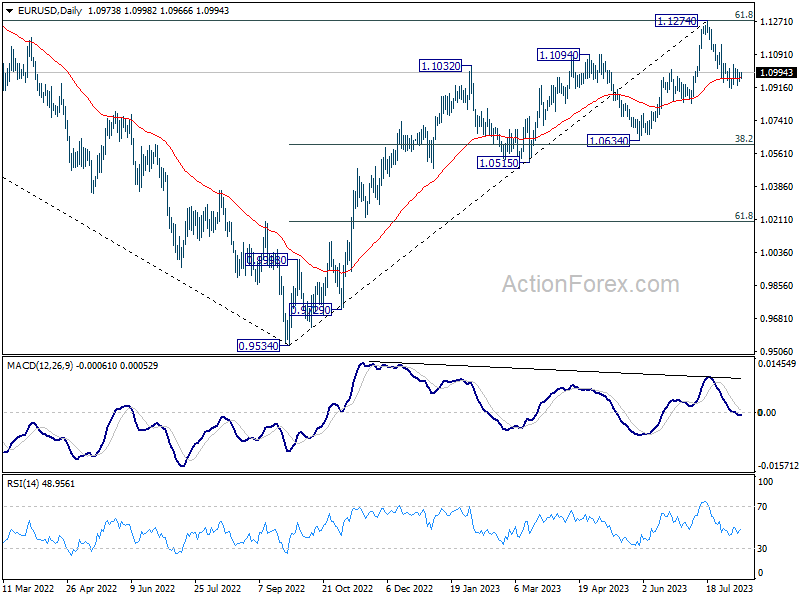
EUR/USD is still extending the consolidation from 1.0911 and intraday bias remains neutral. On the downside, break of 1.0911 will resume the fall from 1.1274 to 1.0832 support. Sustained trading below there will target 1.0609/34 cluster support. However, firm break of 1.1046 minor resistance will argue that pull back from 1.1274 has completed, and bring stronger rebound.
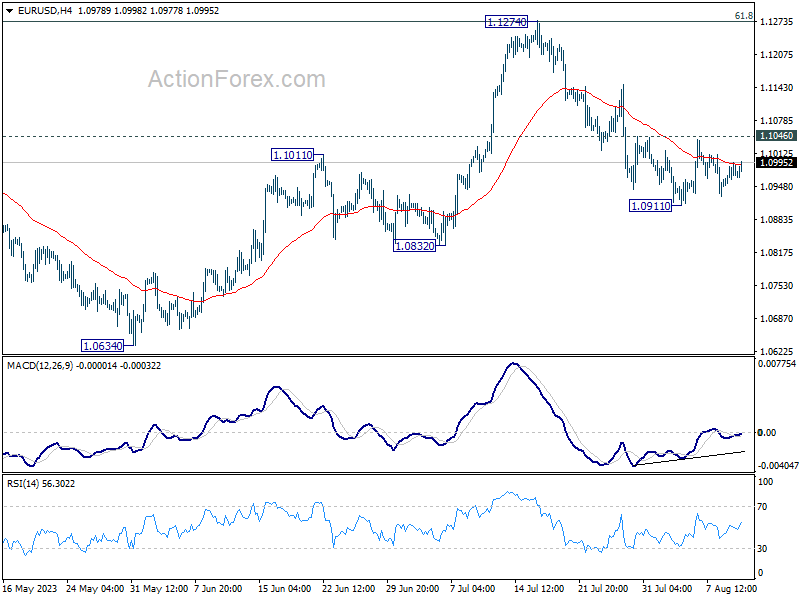
In the bigger picture, a medium term top could be formed at 1.1274, after failing to break through 61.8% retracement of 1.2348 (2021 high) to 0.9534 at 1.1273 decisively, on bearish divergence condition in D MACD. Sustained trading below 55 D EMA (now at 1.0966) will bring deeper correction to 1.0634 cluster support (38.2% retracement of 0.9534 to 1.1274 at 1.0609). Strong support could be seen there, at least on first attempt, to set the range for consolidation.