

Sample Category Title
AUD/USD Daily Report
Daily Pivots: (S1) 0.6508; (P) 0.6540; (R1) 0.6559; More...
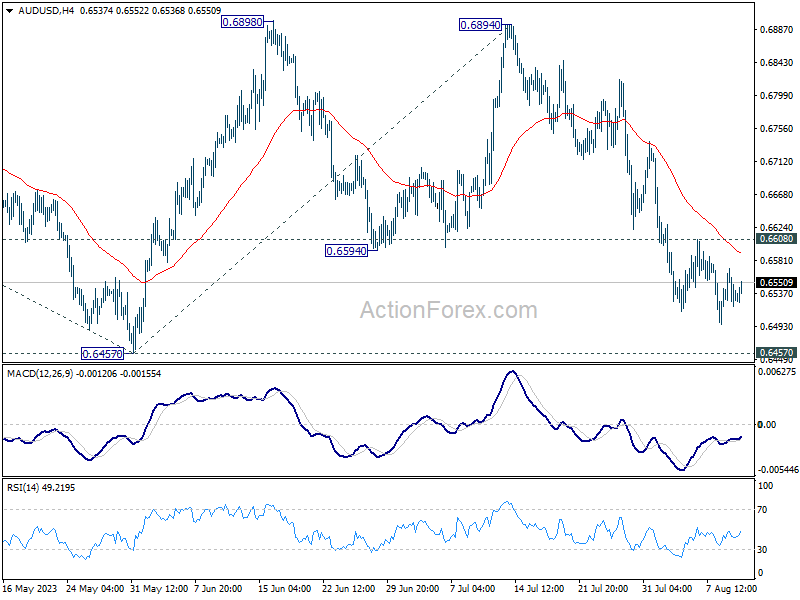
Intraday bias in AUD/USD is turned neutral first, with loss of downside momentum. On the downside, decisive break of 0.6457 support will confirm resumption of whole fall from 0.7156. Next target is 100% projection of 0.7156 to 0.6457 from 0.6894 at 0.6195. Nevertheless, firm break of 0.6608 minor resistance will dampen this view, and turn bias back to the upside for stronger rebound.
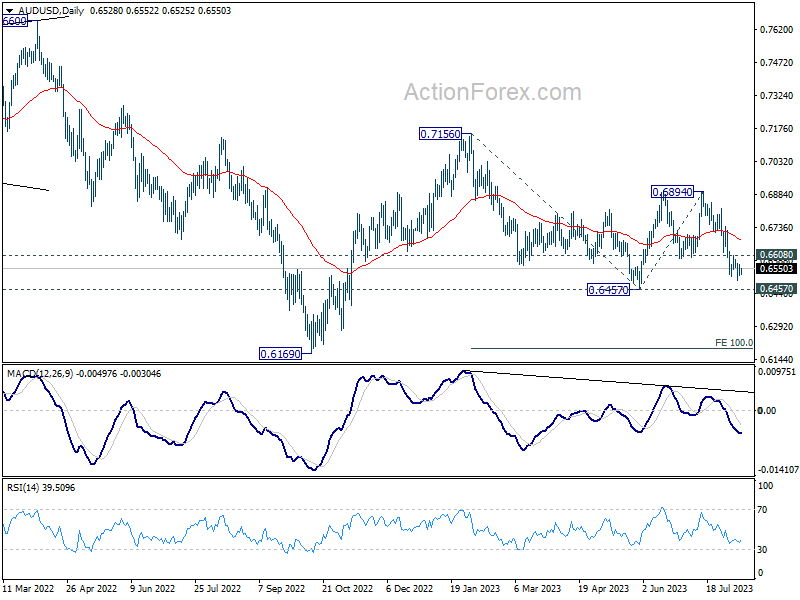
In the bigger picture, outlook is mixed for now as AUD/USD failed to sustain above both 55 D EMA (now at 0.6686) and 55 W EMA (now at 0.6769). On the upside, break of 0.6894 resistance will solidify the case that down trend from 0.8006 (2021 high) has already completed, and target 0.7156 resistance for confirmation. However, break of 0.6457 will likely resume the down trend through 0.6169 (2022 low).
USD/CAD Daily Outlook
Daily Pivots: (S1) 1.3400; (P) 1.3427; (R1) 1.3450; More....
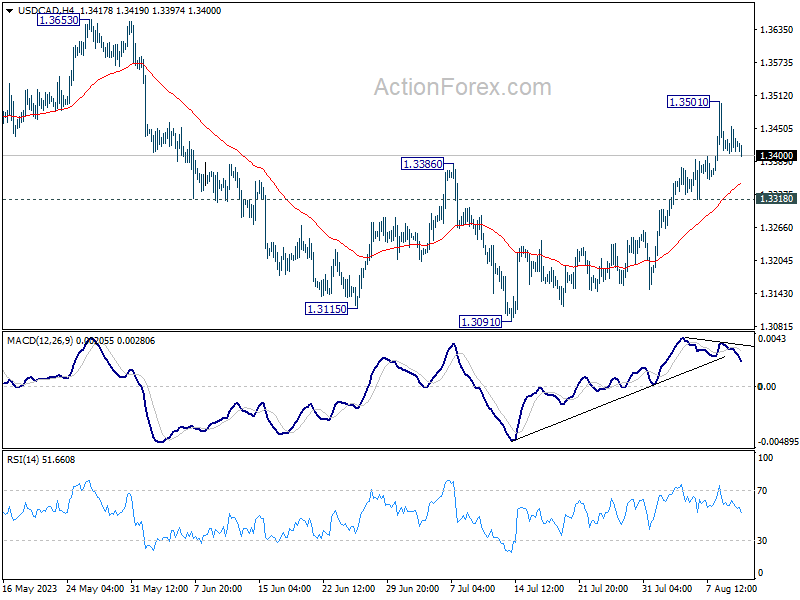
Intraday bias in USD/CAD is turned neutral for some consolidations below 1.3501 temporary top. But further rally is expected as long as 1.3318 support holds. Current development argues that correction from 1.3976 has completed with three waves down to 1.3091. Above 1.3501 will resume the rise from 1.3091 to 1.3653 resistance next. Break there will further confirm this case and target 1.3976 high.
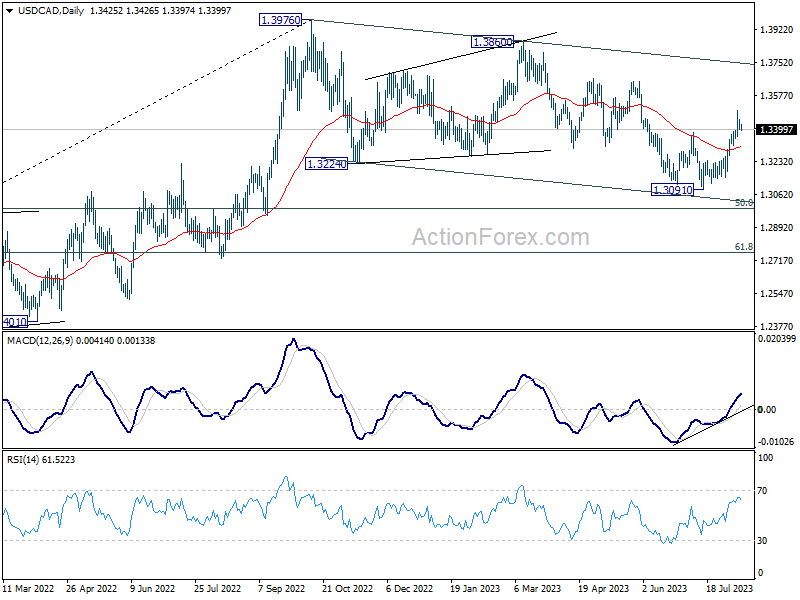
In the bigger picture, price actions from 1.3976 are viewed as a corrective fall only. Upon completion, rise from 1.2005 (2021 low) would resume through 1.3976 towards 1.4667/89 long term resistance zone. In case of another fall, downside should be contained by 61.8% retracement of 1.2005 to 1.3976 at 1.2758.
EUR/CHF Daily Outlook
Daily Pivots: (S1) 0.9597; (P) 0.9615; (R1) 0.9645; More...
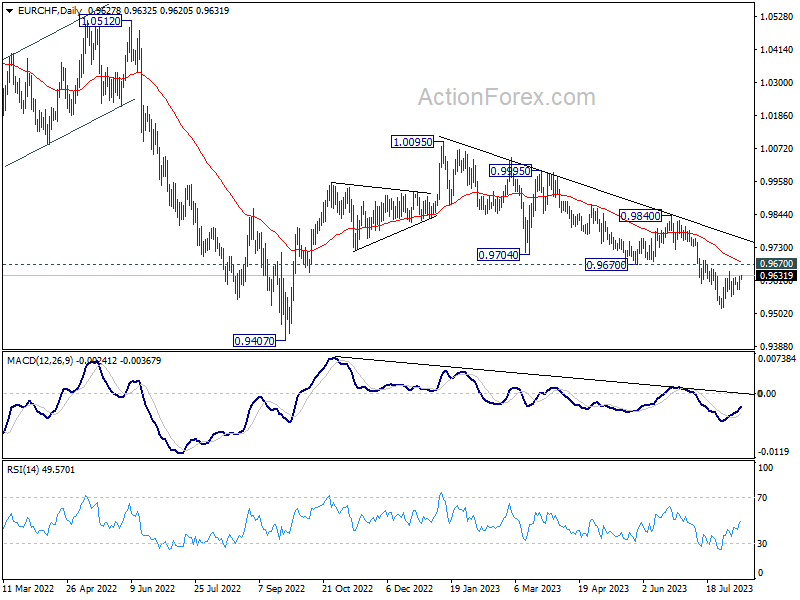
Intraday bias in EUR/CHF stays neutral at this point. With 0.9670 resistance intact, further decline remains in favor. On the downside, break of 0.9520 will resume the whole fall from 1.0095 towards 0.9407 low. Nevertheless, sustained break of 0.9670 will be the first sign of bullish reversal and target 0.9840 resistance for confirmation.
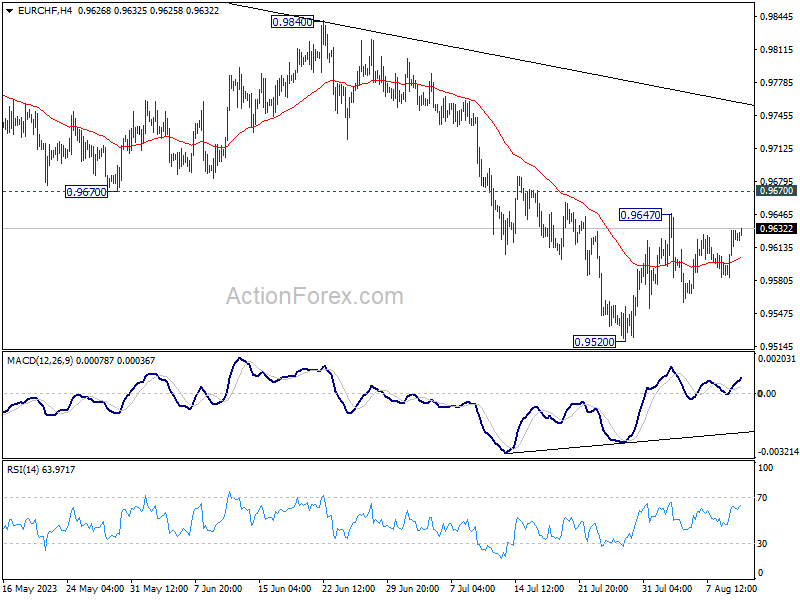
In the bigger picture, medium term outlook is staying bearish as the pair is capped well below falling 55 W EMA (now at 0.9860). Down trend from 1.2004 (2018 high) is in favor to continue. Sustained break of 0.9407 will target 61.8% projection of 1.1149 to 0.9407 from 1.0095 at 0.9018. For now, this will remain the favored case as long as 0.9840 resistance holds, in case of strong rebound.
EUR/GBP Daily Outlook
Daily Pivots: (S1) 0.8598; (P) 0.8616; (R1) 0.8647; More...
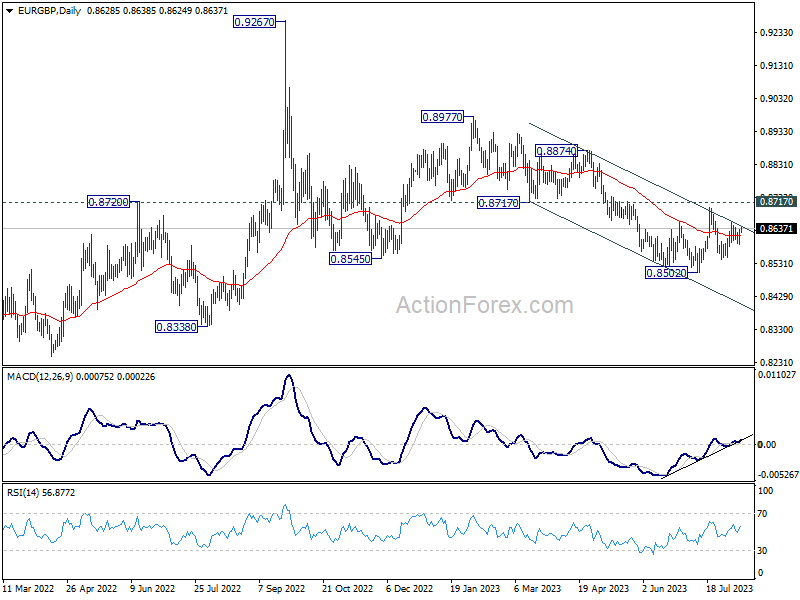
Intraday bias in EUR/GBP stays neutral at this point and more sideway trading could be seen. On the downside, below 0.8543 will target a test on 0.8502 low. Decisive break there will resume larger decline from 0.8977. On the upside firm break of 0.8717 resistance will suggest larger reversal and target 0.8874 resistance next.
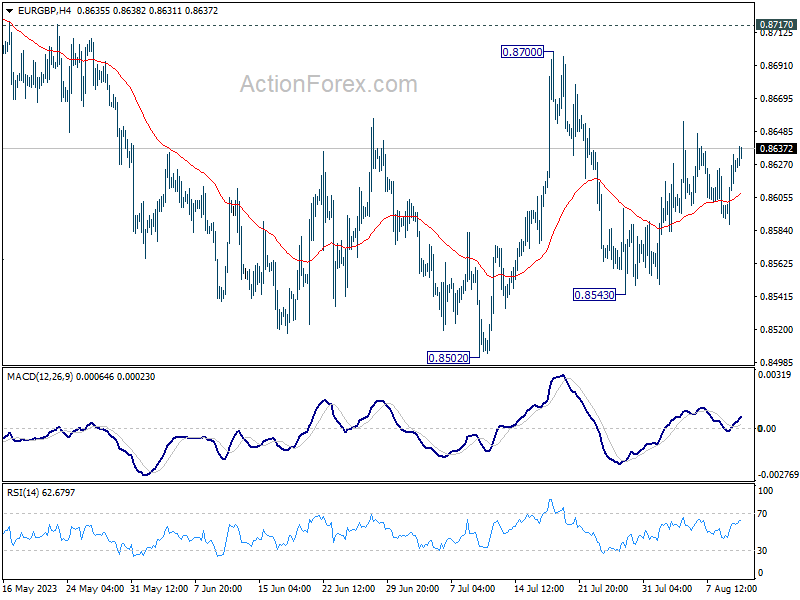
In the bigger picture, the down trend from 0.9267 (2022 high) is seen as part of the long term range pattern from 0.9499 (2020 high). Firm break of 0.8717 support turned resistance will argue that it has completed with three waves down to 0.8502. Further break of 0.8977 will bring retest of 0.9267 high. Nevertheless, rejection by 0.8717, followed by break of 0.8502 will resume the decline towards 0.8201 (2022 low).
EUR/AUD Daily Outlook
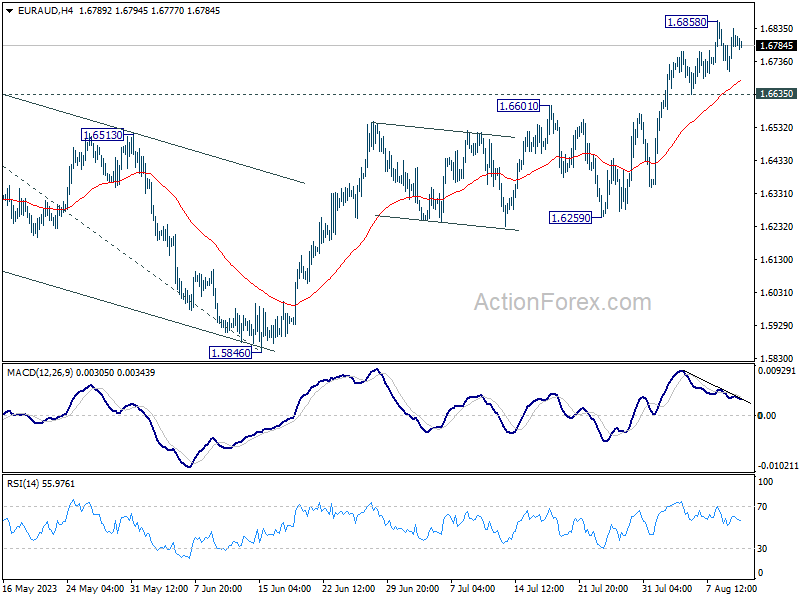
Daily Pivots: (S1) 1.6730; (P) 1.6784; (R1) 1.6863; More...
Intraday bias in EUR/AUD stays neutral at this point. Further rally is expected as long as 1.6635 support holds. Above 0.6858 will resume larger up trend to 1.7377 projection level next.
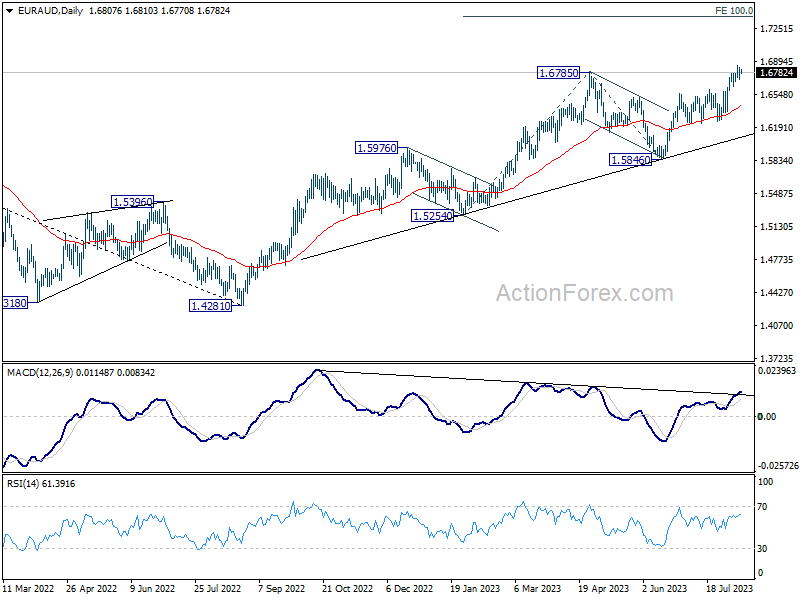
In the bigger picture, the rise from 1.4281 (2022 low) is in progress. Next target is 100% projection of 1.5254 to 1.6785 from 1.5846 at 1.7377. For now, outlook will stay bullish as long as 1.5846 support holds, even in case of another pull back.
GBP/JPY Daily Outlook
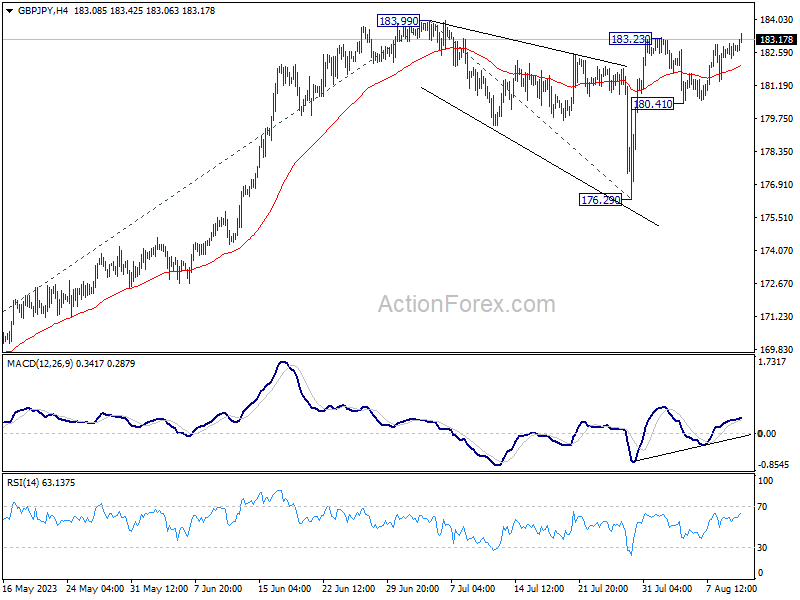
Daily Pivots: (S1) 182.45; (P) 182.73; (R1) 183.09; More...
GBP/JPY's rally is trying to resume and intraday bias is back on the upside. Decisive break of 183.99 will confirm larger up trend resumption. Next target is 61.8% projection of 158.24 to 183.99 from 176.29 at 192.20. For now, near term outlook will stay bullish as long as 180.41 support holds, in case of retreat.
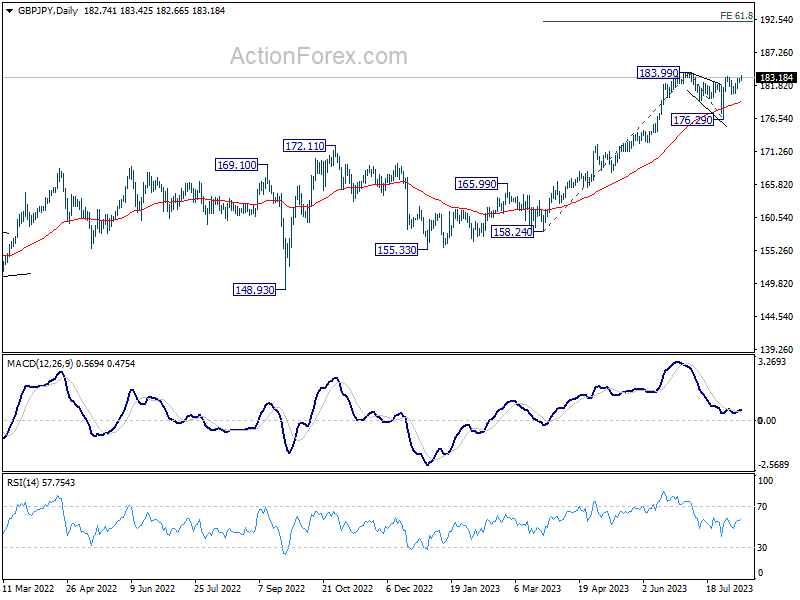
In the bigger picture, as long as 172.11 resistance turned support holds, up trend from 123.94 (2020 low) is expected to continue through 183.99 at a later stage, towards 195.86 (2015 high). Nevertheless, firm break of 172.11 will argue that larger correction is already underway.
All Eyes on US Inflation
US equities fell, while yields pushed higher in the run up to today’s most important US inflation data. Inflation in the U.S. is expected to have rebounded from 3 to 3.3% in July and core inflation may have steadied at around 4.8%. Any bad surprise on the inflation front could revive the Federal Reserve hawks, but we are far from pricing another hike in September just yet; activity on Fed funds futures assesses more than 85% chance for pause in September FOMC meeting. Rising oil, crop and rice prices are the major upside risks, while potential downside pressure on shelter could counter higher raw material prices. According to a latest publication from SF Fed shelter prices could see significant disinflation or deflation in the months ahead. They wrote that their ‘baseline forecast suggests that year-over-year shelter inflation will continue to slow through late 2024 and may even turn negative by mid-2024’, and that we could see ‘the most severe contraction in shelter inflation since the Global Financial Crisis of 2007-09’.
The idea of further Fed hikes is not helping sentiment in bond markets, especially since Fitch downgraded the U.S. credit rating from AAA to AA+. That’s bad news for two reasons. First a lower credit rating means that the US should compensate for the higher risk investors take while buying the US government bonds so it’s an additional upside pressure on yields. And combined to Fed hikes, the US interest payments will become an increasingly growing burden. In numbers, the US spends $1.8 bn interest payments every day. According to Peter Peterson foundation this number will double in the next decade and interest payments will become the fastest growing part of the federal budget. And if that’s not enough, Moody’s downgraded credit ratings for 10 small and midsize US banks, citing higher funding costs, potential regulatory capital weaknesses and risks tied to commercial real estate loans. And speaking of banks, Italian banks also sold off earlier this week on news of a new windfall tax. The latter triggered some risk averse inflows into bonds until Italy issued a clarification of its new tax on banks’ windfall profits, saying that the impact may be limited for some banks and the levy won’t exceed 0.1% of a firm’s assets. Banks that have already increased the interest rates they offer to depositors ‘will not have a significant impact as a consequence of the rule approved yesterday’. Phew….
The U.S. 2-year yield rebounded past 4.80%, while the 10-year yield is back to around%, after a spike to 4.20% on Fitch downgrade.
Troubled China
Chinese indices are up and down. Up, thanks to measures that the Chinese government announced to support the economy, down because of plunging export/import, deflation worries following another round of soft trade, CPI and PPI numbers since the start of the week, and the jitters that the US could limit investments to China. One interesting point is that the Chinese stock market shows decorrelation from the stock markets of developed countries. KraneShares CSI China Internet ETF saw $342.23 million inflows last week, the biggest weekly inflow in 14 months. Yet impressive growth numbers are probably not in China’s near future as the population is shrinking, the real estate crisis fuels the local debt crisis with Country Garden’s potential default on its debt now making the headlines, investor and consumer confidence in Chinese government will take time to be restored, and further restrictions of US investments in China, especially in cutting-edge sectors like AI and quantum computing could further dampen appetite.
Big Rise in Natural Gas Price
Market movers today
The main event today will be the release of the US July CPI, where we look for +0.2% m/m in terms of both headline and core inflation, in line with consensus. Further disinflationary signals especially on core services prices would support our view that the Fed is already done hiking rates. Weekly jobless claims data is also due for release, claims have declined over summer after a modest increase last spring.
Inflation data will also be released for Norway, where we forecast headline inflation to drop to 5.8% from 6.4% and core inflation to ease to 6.4% from 7.0%. This would be roughly in line with Norges Bank's estimate (6.3%) and point towards a 25bp hike in next week's meeting.
In Denmark, we expect CPI inflation increased to 3.1% in July from 2.5% in June after the re-introduction of the electricity fee.
From Sweden, details on June private consumption and industrial production will be released.
On the central bank front, the Fed's Bostic and Harker are scheduled to speak in the Philadelphia Fed's webinar.
The 60 second overview
Natural gas: European natural gas prices rose as much as 40% yesterday - the biggest daily increase since last year. Both the day-ahead spot price and the one-month benchmark future jumped. The move higher came a bit out the blue. Some news headlines suggest it could be due to a tighter LNG market partly on the back of a labour strike in Australia.
US. President Joe Biden yesterday signed an order which limits US investments in China, e.g. in semiconductor, quantum computing and AI. The final details are still to be worked out before coming into effect next year, but at a glance, the order, which has been under way for almost two years, does not look as stringent as some might had expected or hoped for.
Japan: Producer prices in Japan rose 3.6% y/y in July. Last month they increased by 4.3% y/y. Pressure on input costs in Japan continue to ease as also seen, e.g. in Europe and US.
Equities: Global equities were lower yesterday, dragged down by US and cyclicals. The picture was very different in Europe with cyclically driven gains plus banks coming back as Italian politicians are flip-flopping on the windfall tax on banks. US session with relatively high intraday vol and indices ending near worst levels. This was not a very macro or news driven but should in our opinion be seen in the light of solid summer performance and lack of new drivers.
In US yesterday Dow -0.5%, S&P 500 -0.7%, Nasdaq -1.2% and Russell 2000 -0.9%. Asian markets are mixed this morning and the odd situation of negative daily correlation between South Korean and Japanese equity markets are continuing. One could also see this as a lack of big common driver/news. Futures in both Europe and US are higher this morning.
FI: A mostly sideways trading in the absence of significant news before noon was followed by a small uptick in EGB yields with 10y Bunds ending 3bp higher on the day. While difficult to pinpoint an exact trigger, Italy changing the bank tax decided on this weekend and a surge in natural gas may have contributed to the higher EGBs in a thin summer trading session.
FX: FX crosses in general stood relatively still on Wednesday. EUR/USD moved in a tight range around 1.0975, seemingly awaiting the US CPI numbers for direction. EUR/SEK made an attempt to break below 11.70 in risk-on but failed and ended the European and US sessions were it started, close to 11.73. NOK had better luck when EUR/NOK dropped some six figures just to find support at 11.20. USD/JPY climbed a bit, from the low to the high end of 143.
Credit: Yesterday, sentiment in credit markets was constructive but cautious ahead of the US CPI report for July, leaving iTraxx Main broadly unchanged (-0.6bp) at 72.7bp, while iTraxx Xover tightened by 2.7bp to close the session at 406.4bp. Moreover, the primary market activity was relatively muted with only a few financials active the Eurobond arena. Handelsbanken printed a EUR750m 11NC6 Tier 2 bond at MS+190bp travelling from IPT of MS+220 area, this intraday transaction with solid book-coverage underpins a healthy investor appetite.
Nordic macro
Denmark. Danish CPI inflation declined significantly in Q2, as low spot energy prices weighed heavy on inflation. With the re-introduction of the electricity fee, we expect an increase in the July figures, though, to 3.1% from 2.5% in June. Food prices remain a joker after we saw a big increase in June.
Sweden. Did Swedish economy fall off a cliff in the second quarter? It was indeed the impression given by the very weak GDP indicator which contracted a whopping 1.5% compared to the previous quarter, way below the Riksbank's -0.5% and which also surprised NIER which lowered its forecast for Q2 and 2023 yesterday, yet without taking the poor preliminary GDP indication fully into account. The official National account data for Q2 is released on 29 August and those will be the numbers the Riksbank brings to its September meeting. In the meantime, we get June consumer and production data this morning which will shed more light on the matter.
Norway. We expect Norwegian core inflation to drop from 7.0 % to 6.4 % in July, mainly from lower food prices due to strong base effects and high June inflation. This would be roughly in line with Norges Bank's estimate from the June MPR at 6.3 % and should point towards a 25bp hike next week. Headline inflation is expected to drop from 6.4 % to 5.8 % in July.
EUR/JPY Daily Outlook
Daily Pivots: (S1) 157.14; (P) 157.52; (R1) 158.12; More....
EUR/JPY's break of 158.03 resistance indicates resumption of larger up trend. Intraday bias is back on the upside. Further rally should be seen to 61.8% projection of 139.05 to 157.99 from 151.39 at 163.09 next. For now, outlook will stay bullish as long as 156.33 support holds, in case of retreat.
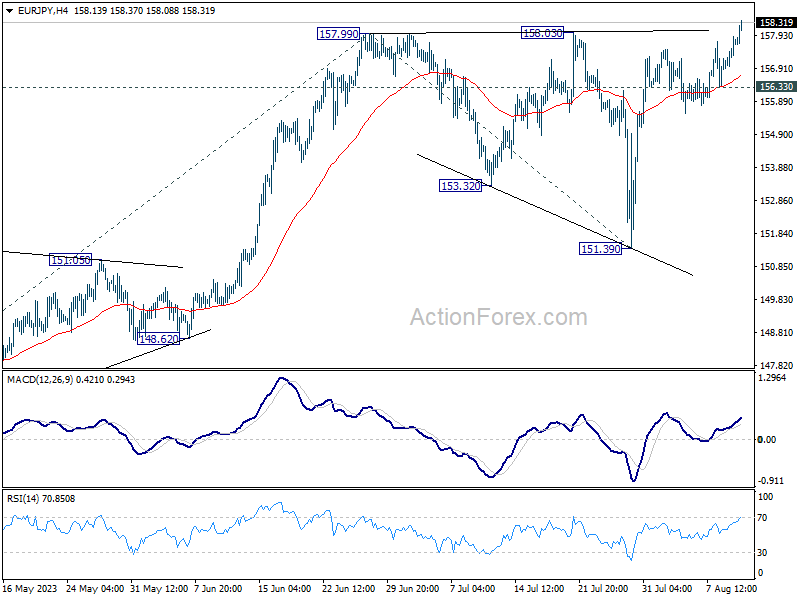
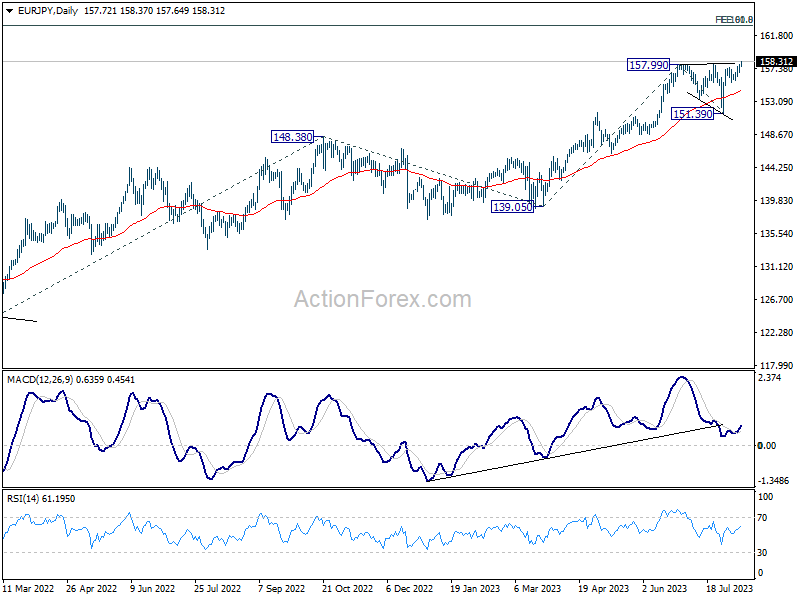
In the bigger picture, rise from 114.42 (2020 low) is in progress. Next target is 100% projection of 124.37 to 148.38 from 139.05 at 163.06. Sustained break there will pave the way to retest long term resistance at 169.96. This will now remain the favored case as long as 151.39 support holds, even in case of deep pull back.
Yen Down as Nikkei Defies Regional Selloff, Dollar Eyes CPI for Direction
Most major Asian stock markets are trading in the red, echoing the downturn witnessed in the US markets overnight. An exception to the trend is Japan's Nikkei, which surged on the back of robust earnings reports from heavyweights like Honda and oil & gas explorer Inpex. This uplifted sentiment has simultaneously weighed on Yen, causing it to break near-term supports against key counterparts such as the Dollar, Euro, and Swiss Franc.
For the week, Yen finds itself as the most underwhelming performer, trailed by New Zealand Dollar, Swiss Franc, and Australian Dollar. On the flip side, the Dollar is establishing its dominance, with the Sterling and Euro in tow.
The forthcoming US CPI data will play a pivotal role in determining Dollar's trajectory. While an inflation data that undershoots expectations could cement beliefs of Fed to be on hold in September, a higher-than-anticipated reading might amplify chances of another rate hike.
Market participants should note another data set on inflation and employment is due before the Fed's subsequent meeting, making today's market movements even more intricate and pivotal in discerning traders' inclinations.
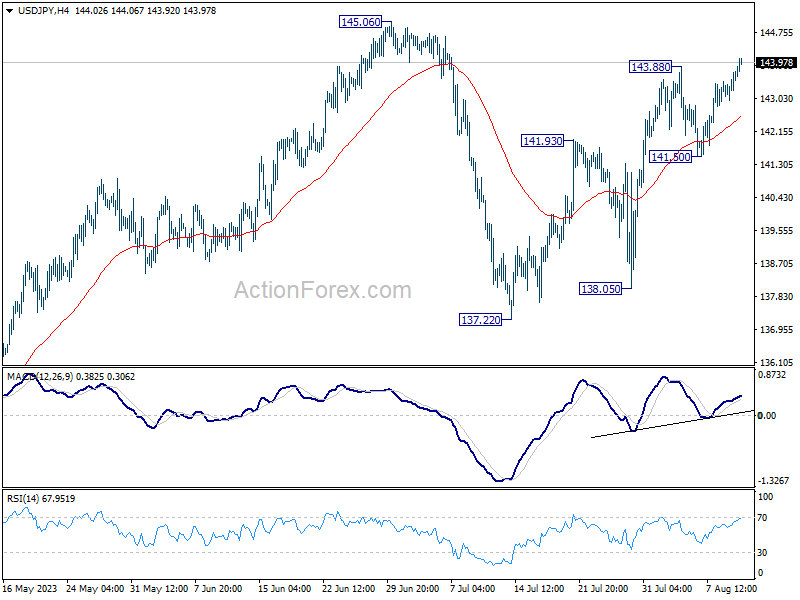
Technically, USD/JPY's rally from 137.22 finally resumes despite lots of interim setbacks. Next focus is on 145.06 resistance. Firm break there will confirm resumption of whole rise from 127.20 towards 151.93 high. Nevertheless, rejection by 145.06 would probably bring another fall to extend the pattern from 145.06 and limit the upside momentum in other Yen crosses.
In Asia, at the time of writing, Nikkei is up 0.85%. Hong Kong HSI is down -0.68%. China Shanghai SSE is down -0.01%. Singapore Strait Times is down -0.01%. Japan 10-year JGB yield is up 0.0195 at 0.584. Overnight, DOW dropped -0.54%. S&P 500 dropped -0.70%. NASDAQ dropped -1.17%. 10-year yield dropped -0.014 to 4.012.
Japan's PPI slows down for seventh consecutive month
Japan's PPI for July has once again reported a slowdown, decelerating from 4.3% yoy in the previous month to 3.6% yoy. However, this figure slightly surpassed market expectations, which anticipated a drop to 3.5% yoy. It's worth noting that this marks the seventh consecutive month of decline for PPI, tracing back from its December peak of 10.6% yoy.
Looking at some details, yen-denominated import prices saw a significant dip. The -14.1% yoy decline in July, a steeper fall than June's -11.4% yoy, extends the negative trend to its fourth consecutive month.
Simultaneously, yen-denominated export prices also demonstrated downward trends, slipping from a positive growth of 0.8% yoy in the preceding month to a negative -0.2% yoy in July.
US CPI awaited, NASDAQ heading lower to 55 D EMA
Markets await key US consumer inflation data scheduled for release today, with projections centered on a 0.2% mom uptick for both headline and core CPI. On a yoy basis, headline CPI is anticipated to climb from 3.0% to 3.3%, while core CPI is projected to remain steady at 4.8%.
This anticipated rise in headline inflation, marking the first surge in over a year, can be attributed to unfavorable base effects and a moderate uptick in gas prices. Thus, this shouldn't particularly alarm Fed officials.
If the inflation figures align with expectations, the 0.2% monthly increase in both core CPI would be largely consistent with Fed's 2% inflation target. Such a scenario would strengthen the case for Fed to pause again in its September meeting, adopting a wait-and-see approach.
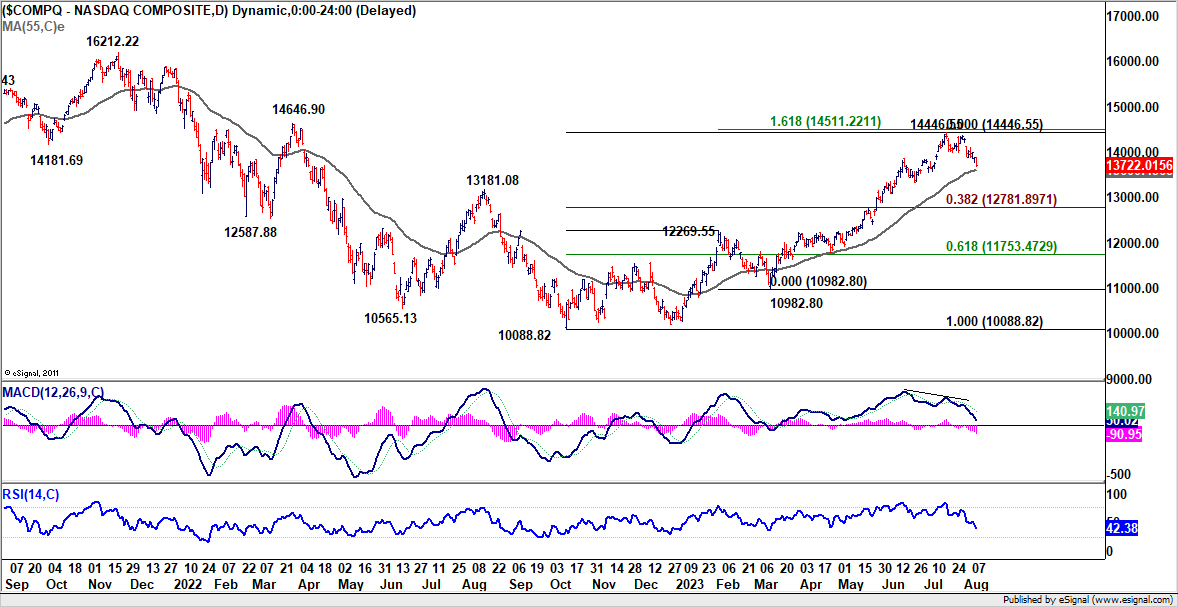
Following broad decline in US stocks, NASDAQ closed down -1.17% overnight. Current development suggests that a short term top at least formed at 14446.55. Deeper decline is expected to 55 D EMA (now at 13600.45).
The grappling question is whether rise from 10088.82, as the second wave of the medium term corrective pattern from 16212.22, has run off its course. It just missed target of 161.8% projection of 10088.82 to 12269.55 from 10982.80 at 14511.22.
Robust support from 55 D EMA would maintain near term bearishness for another rise through 14446.55 at a later stage. However, sustained break of this EMA would raise the chance of a bearish reversal. That is, the third leg of the medium term pattern has already started. NASDAQ would then test the second line of defense at 38.2% retracement of 10088.82 to 14446.55 at 12781.89 to determine its fate.
Elsewhere
ECB will publish monthly economic bulletin in European session. US will also release jobless claims in addition to CPI.
EUR/JPY Daily Outlook
Daily Pivots: (S1) 157.14; (P) 157.52; (R1) 158.12; More....
EUR/JPY's break of 158.03 resistance indicates resumption of larger up trend. Intraday bias is back on the upside. Further rally should be seen to 61.8% projection of 139.05 to 157.99 from 151.39 at 163.09 next. For now, outlook will stay bullish as long as 156.33 support holds, in case of retreat.
In the bigger picture, rise from 114.42 (2020 low) is in progress. Next target is 100% projection of 124.37 to 148.38 from 139.05 at 163.06. Sustained break there will pave the way to retest long term resistance at 169.96. This will now remain the favored case as long as 151.39 support holds, even in case of deep pull back.
Economic Indicators Update
| GMT | Ccy | Events | Actual | Forecast | Previous | Revised |
|---|---|---|---|---|---|---|
| 23:01 | GBP | RICS Housing Price Balance Jul | -53% | -51% | -46% | |
| 23:50 | JPY | PPI Y/Y Jul | 3.60% | 3.50% | 4.10% | 4.30% |
| 01:00 | AUD | Consumer Inflation Expectations Aug | 4.90% | 5.20% | ||
| 08:00 | EUR | ECB Economic Bulletin | ||||
| 12:30 | USD | Initial Jobless Claims (Aug 4) | 230K | 227K | ||
| 12:30 | USD | CPI M/M Jul | 0.20% | 0.20% | ||
| 12:30 | USD | CPI Y/Y Jul | 3.30% | 3.00% | ||
| 12:30 | USD | CPI Core M/M Jul | 0.20% | 0.20% | ||
| 12:30 | USD | CPI Core Y/Y Jul | 4.80% | 4.80% | ||
| 14:30 | USD | Natural Gas Storage | 24B | 14B |