

Sample Category Title
US: Core Inflation Takes Another Step in the Right Direction in July
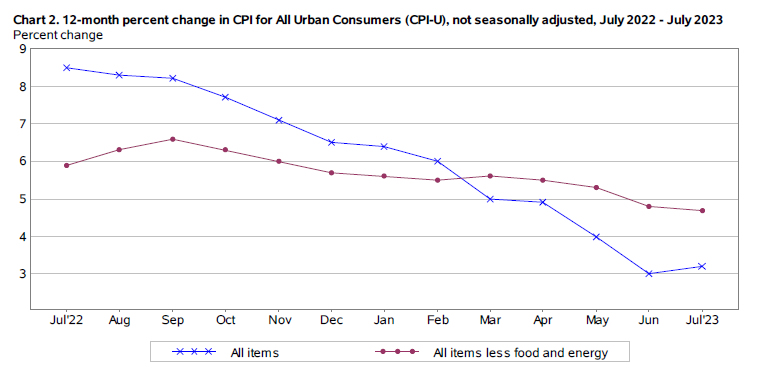
The Consumer Price Index (CPI) rose 0.2% month-on-month (m/m) in July, bang-on the consensus forecast. On a 12-month basis, CPI inched 0.2%-pts higher to 3.2%, though this was due to unfavorable base-effects stemming from a sharp decline in July 2022 energy prices.
- In contrast, energy costs had a much smaller effect on July's gain – rising a very modest 0.1% m/m – as higher gasoline prices (0.2% m/m) were partially offset by lower electricity (-0.7% m/m) costs. Meanwhile, food prices rose 0.2% m/m and slowed to 4.9% year-on-year (y/y).
Excluding the direct effects of food and energy, core inflation rose 0.2% m/m (0.16% m/m unrounded) – matching June's gain – and also meeting the consensus forecast. The 12-month change on core edged lower by 0.1%-pts on the month, falling to 4.7%.
- Price growth across services rose 0.4% m/m – a slight acceleration from June's 0.3% m/m gain – and remain at an elevated 6.1% on a year-on-year basis.
- Shelter costs remained a key source of inflationary pressure, with owners' equivalent rent (0.5% m/m) and rent of primary residence (0.4% m/m) notching sizeable gains.
Price growth across non-housing services rose a modest 0.1% m/m – an acceleration from June's decline of 0.1% m/m – with gains seen across recreation services (+0.8% m/m) as well as education (+0.3% m/m) and transportation (+0.3% m/m). Airfares continued to tumble, with prices down a sizeable 8.1% m/m – exactly matching June's decline.
Core goods prices (-0.3% m/m) fell for a second consecutive month, with declines concentrated in transportation (-0.5% m/m) – largely attributed to a 1.3% m/m pullback in used vehicle prices – education & communication goods (-1.2% m/m) and recreational goods (-0.8% m/m).
Key Implications
The July CPI reading was another step in the right direction towards returning price stability. Core inflation matched June's 28-month low of a 'soft' 0.2% m/m gain, which pushed the three-month annualized change down to just 3.1% – its first 'three-handle' since September 2021. Importantly, goods prices have again become a source of deflation, while price growth across non-housing services has slowed from last year's peak of 6.7% to 4%.
With inflation trending favorably and the labor market showing early signs of cooling, the FOMC likely has the reassurance it needs to move to the sidelines and wait for the full effect of past tightening to work its way through the economy. However, with core inflation expected to run north of 3% through Q1-2024, rate cuts remain a long way out.
EUR/USD Mid-Day Outlook
Daily Pivots: (S1) 1.0952; (P) 1.0974; (R1) 1.0995; More...
EUR/USD breaches 1.1046 minor resistance but couldn't sustain above there so far. Initial bias remains neutral first. On the downside, break of 1.0911 will resume the fall from 1.1274 to 1.0832 support. Sustained trading below there will target 1.0609/34 cluster support. However, firm break of 1.1046 minor resistance will argue that pull back from 1.1274 has completed, and bring stronger rebound.
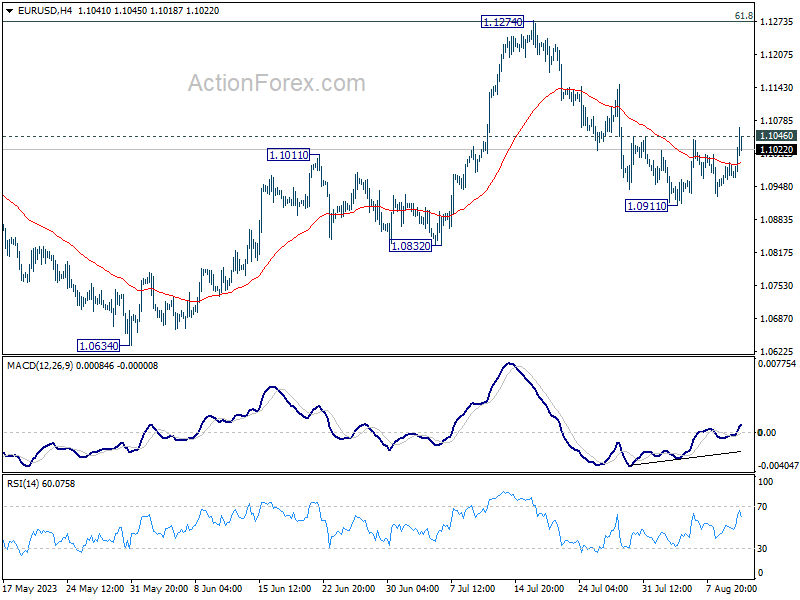
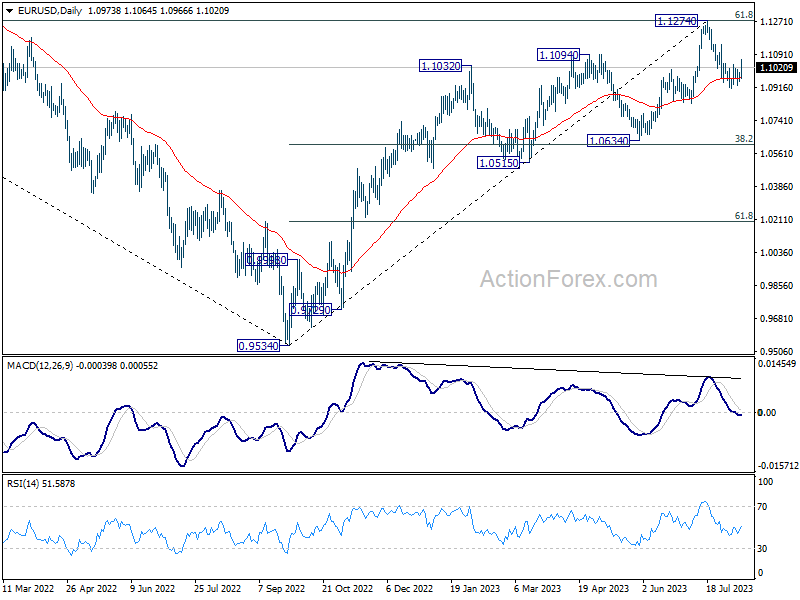
In the bigger picture, a medium term top could be formed at 1.1274, after failing to break through 61.8% retracement of 1.2348 (2021 high) to 0.9534 at 1.1273 decisively, on bearish divergence condition in D MACD. Sustained trading below 55 D EMA (now at 1.0966) will bring deeper correction to 1.0634 cluster support (38.2% retracement of 0.9534 to 1.1274 at 1.0609). Strong support could be seen there, at least on first attempt, to set the range for consolidation.
Dollar’s Post-CPI Slump Faces Strong Resilience
Despite an initial dip in Dollar after release of US consumer inflation data, the greenback has shown resilience against further selling pressures. The CPI figures, aligning with market predictions, bolster the possibility of Fed maintaining its current interest rates this September. However, several key considerations remain. Firstly, another round of inflation and employment data will be released before any potential rate adjustments. Secondly, with inflation still notably elevated, the prospect of another rate increase before the cycle concludes cannot be totally dismissed. Additionally, this week's significant rise in oil and gas prices could be an underlying risk to the deflation process.
As of now, Yen and the Dollar are vying for the title of the day's weakest performer, with Canadian Dollar trailing behind as a distant third. On the other end of the spectrum, Aussie and Kiwi are demonstrating robust performance as the best. Euro and Swiss Franc, meanwhile, are managing to edge out Sterling, which awaits potential impetus from tomorrow's UK GDP data to shift its trajectory.
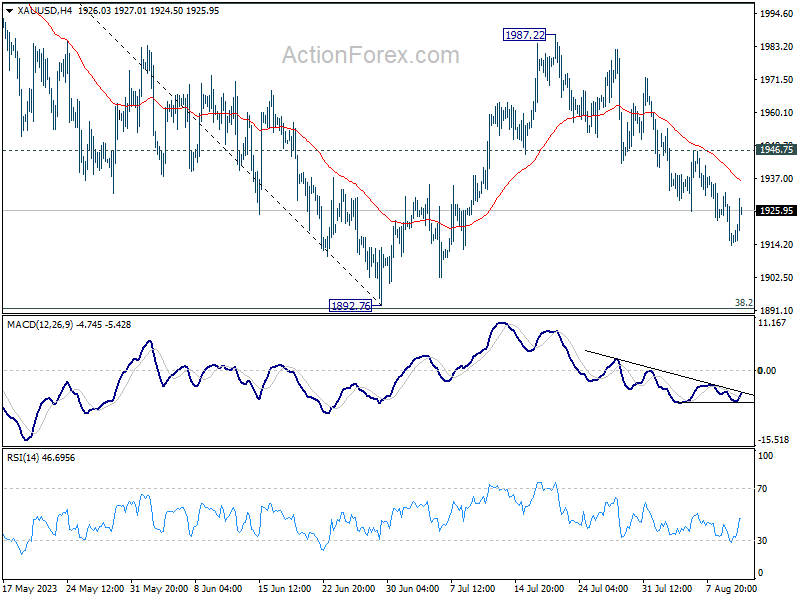
Technically, Gold is also recovering today on Dollar's weakness. However, firm break of 1946.75 resistance is needed to indicate completion of the choppy fall from 1987.22. Otherwise, risk will stay mildly on the downside for retesting 1892.76 low. Nevertheless, firm break of 1946.75 could trigger upside acceleration, which is also accompanied by steep selloff in Dollar.
In Europe, at the time of writing, FTSE is up 0.09%. DAX is up 0.55%. CAC is up 1.10%. Germany 10-year yield is up 0.0028 at 2.500. Earlier in Asia, Nikkei rose 0.84%. Hong Kong HSI rose 0.01%. China Shanghai SSE rose 0.31%. Singapore Strait Times rose 0.28%. Japan 10-year JGB yield rose 0.0241 to 0.589.
US CPI and core CPI rose 0.2% mom in Jul, matched expectations
US CPI and core CPI rose 0.2% mom in July, matched expectations. Food prices rose 0.2% mom,Energy prices rose 0.1% mom. The index for shelter was by far the largest contributor to the monthly all items increase, accounting for over 90 percent of the increase, with the index for motor vehicle insurance also contributing.
For the 12 months, headline CPI rose slightly from 3.0% yoy to 3.2% yoy, below expectation of 3.3% yoy. Core CPI slowed slightly from 4.8% yoy to 4.7% yoy, below expectation of being unchanged. Food prices were up 4.9% yoy while energy prices were down -12.5% yoy.
US jobless claims rose to 248k, above expectations
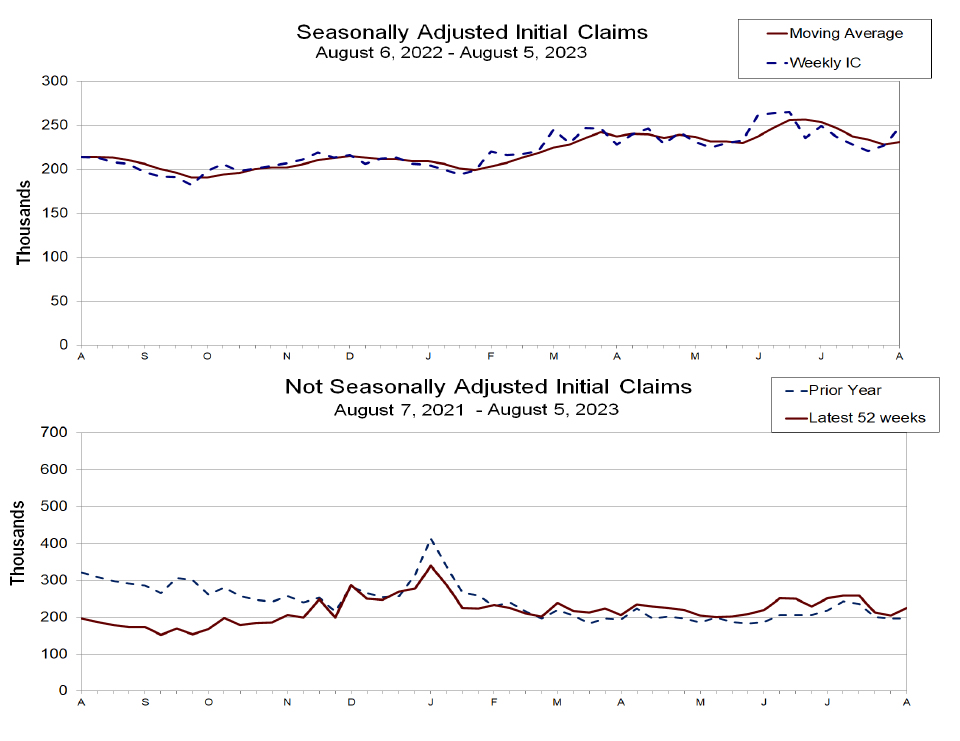
US initial jobless claims rose 21k to 248k in the week ending August 5, above expectation of 230k. Four-week moving average of initial claims rose 3k to 228k.
Continuing claims dropped -8k to 1684k in the week ending July 29. Four-week moving average of continuing claims dropped -9k to 1701k.
Japan's PPI slows down for seventh consecutive month
Japan's PPI for July has once again reported a slowdown, decelerating from 4.3% yoy in the previous month to 3.6% yoy. However, this figure slightly surpassed market expectations, which anticipated a drop to 3.5% yoy. It's worth noting that this marks the seventh consecutive month of decline for PPI, tracing back from its December peak of 10.6% yoy.
Looking at some details, yen-denominated import prices saw a significant dip. The -14.1% yoy decline in July, a steeper fall than June's -11.4% yoy, extends the negative trend to its fourth consecutive month.
Simultaneously, yen-denominated export prices also demonstrated downward trends, slipping from a positive growth of 0.8% yoy in the preceding month to a negative -0.2% yoy in July.
EUR/USD Mid-Day Outlook
Daily Pivots: (S1) 1.0952; (P) 1.0974; (R1) 1.0995; More...
EUR/USD breaches 1.1046 minor resistance but couldn't sustain above there so far. Initial bias remains neutral first. On the downside, break of 1.0911 will resume the fall from 1.1274 to 1.0832 support. Sustained trading below there will target 1.0609/34 cluster support. However, firm break of 1.1046 minor resistance will argue that pull back from 1.1274 has completed, and bring stronger rebound.
In the bigger picture, a medium term top could be formed at 1.1274, after failing to break through 61.8% retracement of 1.2348 (2021 high) to 0.9534 at 1.1273 decisively, on bearish divergence condition in D MACD. Sustained trading below 55 D EMA (now at 1.0966) will bring deeper correction to 1.0634 cluster support (38.2% retracement of 0.9534 to 1.1274 at 1.0609). Strong support could be seen there, at least on first attempt, to set the range for consolidation.
Economic Indicators Update
| GMT | Ccy | Events | Actual | Forecast | Previous | Revised |
|---|---|---|---|---|---|---|
| 23:01 | GBP | RICS Housing Price Balance Jul | -53% | -51% | -46% | |
| 23:50 | JPY | PPI Y/Y Jul | 3.60% | 3.50% | 4.10% | 4.30% |
| 01:00 | AUD | Consumer Inflation Expectations Aug | 4.90% | 5.20% | ||
| 08:00 | EUR | ECB Economic Bulletin | ||||
| 12:30 | USD | Initial Jobless Claims (Aug 4) | 248K | 230K | 227K | |
| 12:30 | USD | CPI M/M Jul | 0.20% | 0.20% | 0.20% | |
| 12:30 | USD | CPI Y/Y Jul | 3.20% | 3.30% | 3.00% | |
| 12:30 | USD | CPI Core M/M Jul | 0.20% | 0.20% | 0.20% | |
| 12:30 | USD | CPI Core Y/Y Jul | 4.70% | 4.80% | 4.80% | |
| 14:30 | USD | Natural Gas Storage | 24B | 14B |
US jobless claims rose to 248k, above expectations
US initial jobless claims rose 21k to 248k in the week ending August 5, above expectation of 230k. Four-week moving average of initial claims rose 3k to 228k.
Continuing claims dropped -8k to 1684k in the week ending July 29. Four-week moving average of continuing claims dropped -9k to 1701k.
US CPI and core CPI rose 0.2% mom in Jul, matched expectations
US CPI and core CPI rose 0.2% mom in July, matched expectations. Food prices rose 0.2% mom,Energy prices rose 0.1% mom. The index for shelter was by far the largest contributor to the monthly all items increase, accounting for over 90 percent of the increase, with the index for motor vehicle insurance also contributing.
For the 12 months, headline CPI rose slightly from 3.0% yoy to 3.2% yoy, below expectation of 3.3% yoy. Core CPI slowed slightly from 4.8% yoy to 4.7% yoy, below expectation of being unchanged. Food prices were up 4.9% yoy while energy prices were down -12.5% yoy.
CPI Could Drive The Dollar Further Down
The upcoming consumer price index (CPI) report for July is projected to indicate a 0.2% monthly increase and a 12-month rate of 3.3%, marking a decline from last year's 8.5%. Inflationary pressures have shown a reduction since 2022. Despite signs of easing, experts emphasize caution due to inflation's historical persistence. Housing costs are decreasing, and wage gains are slowing down, but concerns remain about rising health insurance expenses and surging gas prices. While some believe recent trends might deter further interest rate hikes by the Federal Reserve, others, like former Fed Governor Richard Clarida, suggest the Fed should remain vigilant in its fight against inflation.
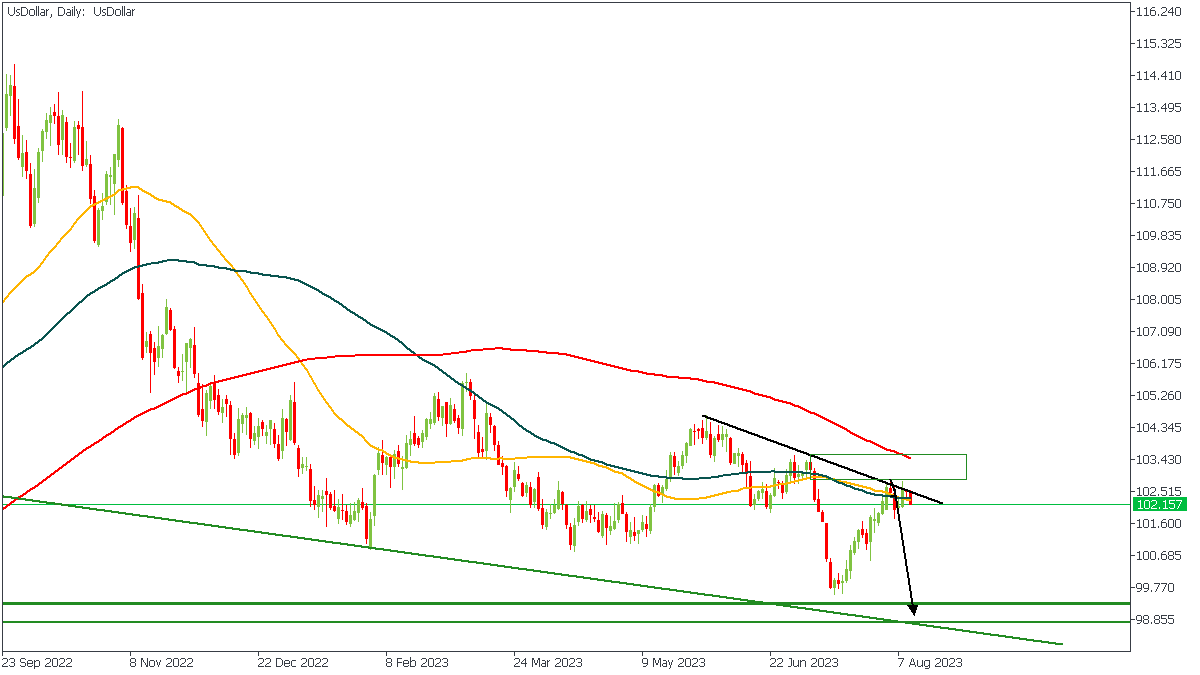
US Dollar - D1 Timeframe
The US Dollar as seen in the attached chart image seems to have commenced the initial reaction away from the supply zone, and is likely aiming for the demand zone as highlighted in the image. Among the multiple confirmations in favour of this movement is; the trendline resistance, bearish moving average array, resistance from the 50 and 100 period moving averages, as well as the 88% of the Fibonacci retracement level.
Analyst’s Expectations:
- Direction: Bearish
- Target: 100.159
- Invalidation: 103.580
EURUSD - D1 Timeframe
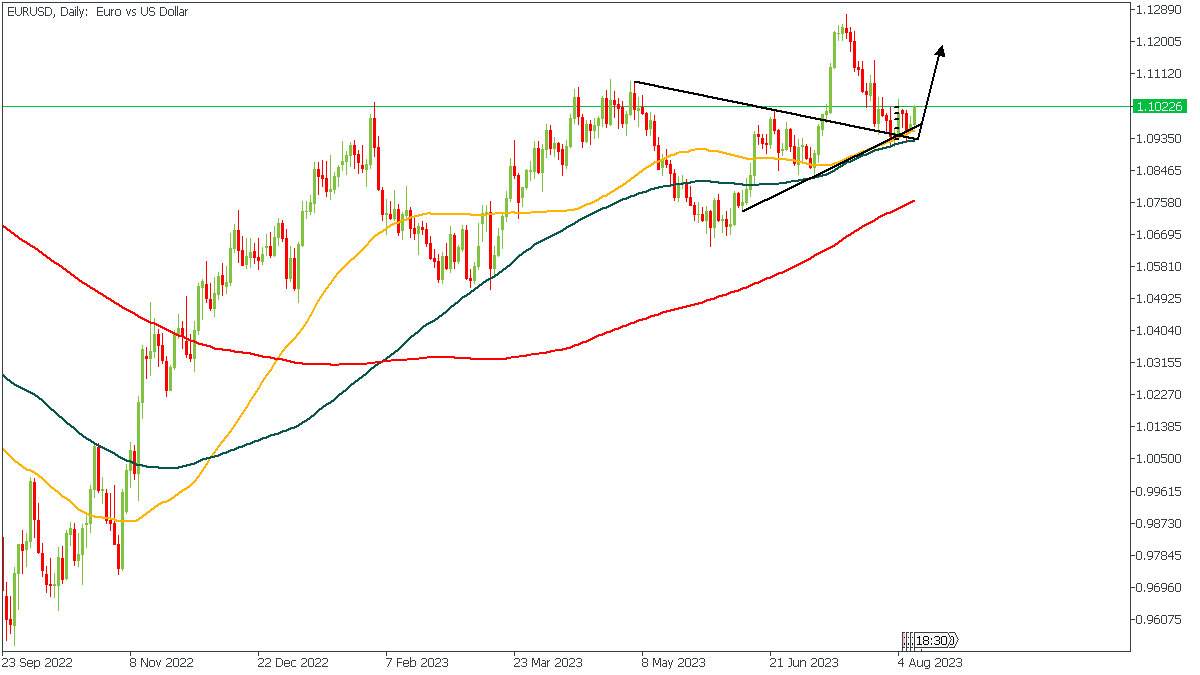
After breaking above the previous high and the trendline, we now see price making a move away from the trendline support on EURUSD and possibly aiming for the recent high. This move has confluences from the moving average support, trendline support, 76% of the Fibonacci retracement, as well as the bullish array of the moving averages on EURUSD.
Analyst’s Expectations:
- Direction: Bullish
- Target: 1.11943
- Invalidation: 1.09526
GBPUSD - D1 Timeframe
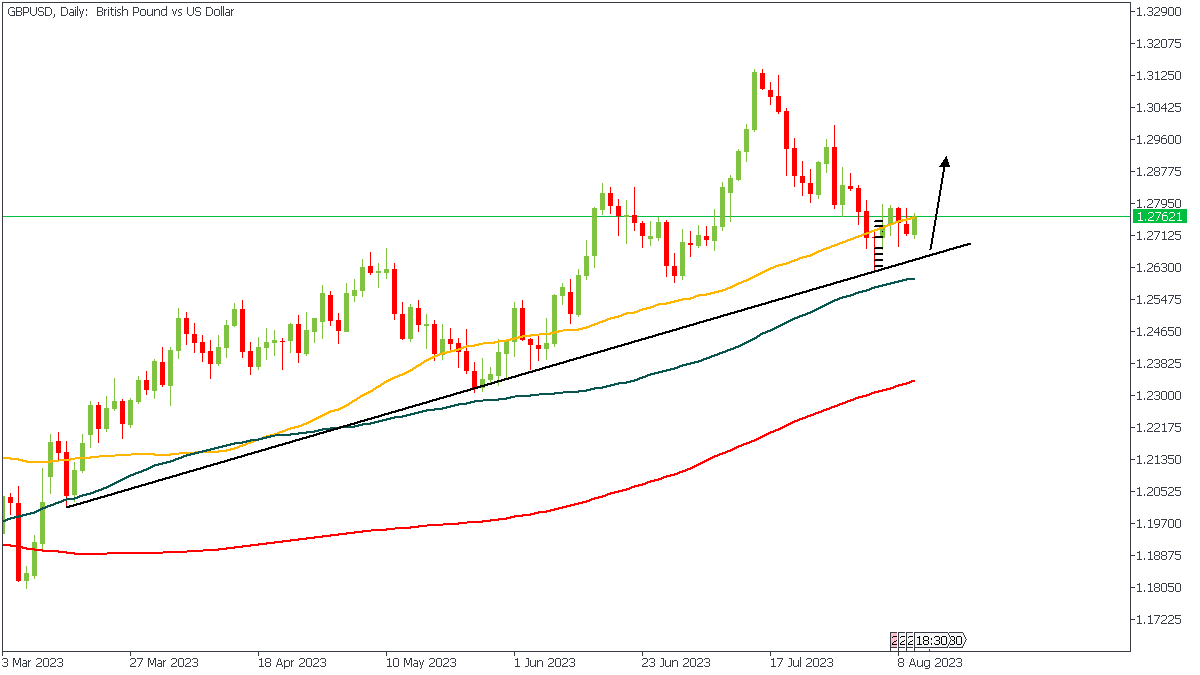
Here on the GBPUSD chart attached,we can see the trendline support spanning several months altogether, with price being initially rejected from it. The 50-period moving average also provides credible support for price and thus increases the likelihood of continued bullish price action on GBPUSD
Analyst’s Expectations:
- Direction: Bullish
- Target: 1.29388
- Invalidation: 1.26803
CONCLUSION
The trading of CFDs comes at a risk. Thus, to succeed, you have to manage risks properly. To avoid costly mistakes while you look to trade these opportunities, be sure to do your due diligence and manage your risk appropriately.
Euro Pushes Higher ahead of US Inflation Report
- US inflation is expected to rise to 3.3%
- ECB singing a dovish tune ahead of the September meeting
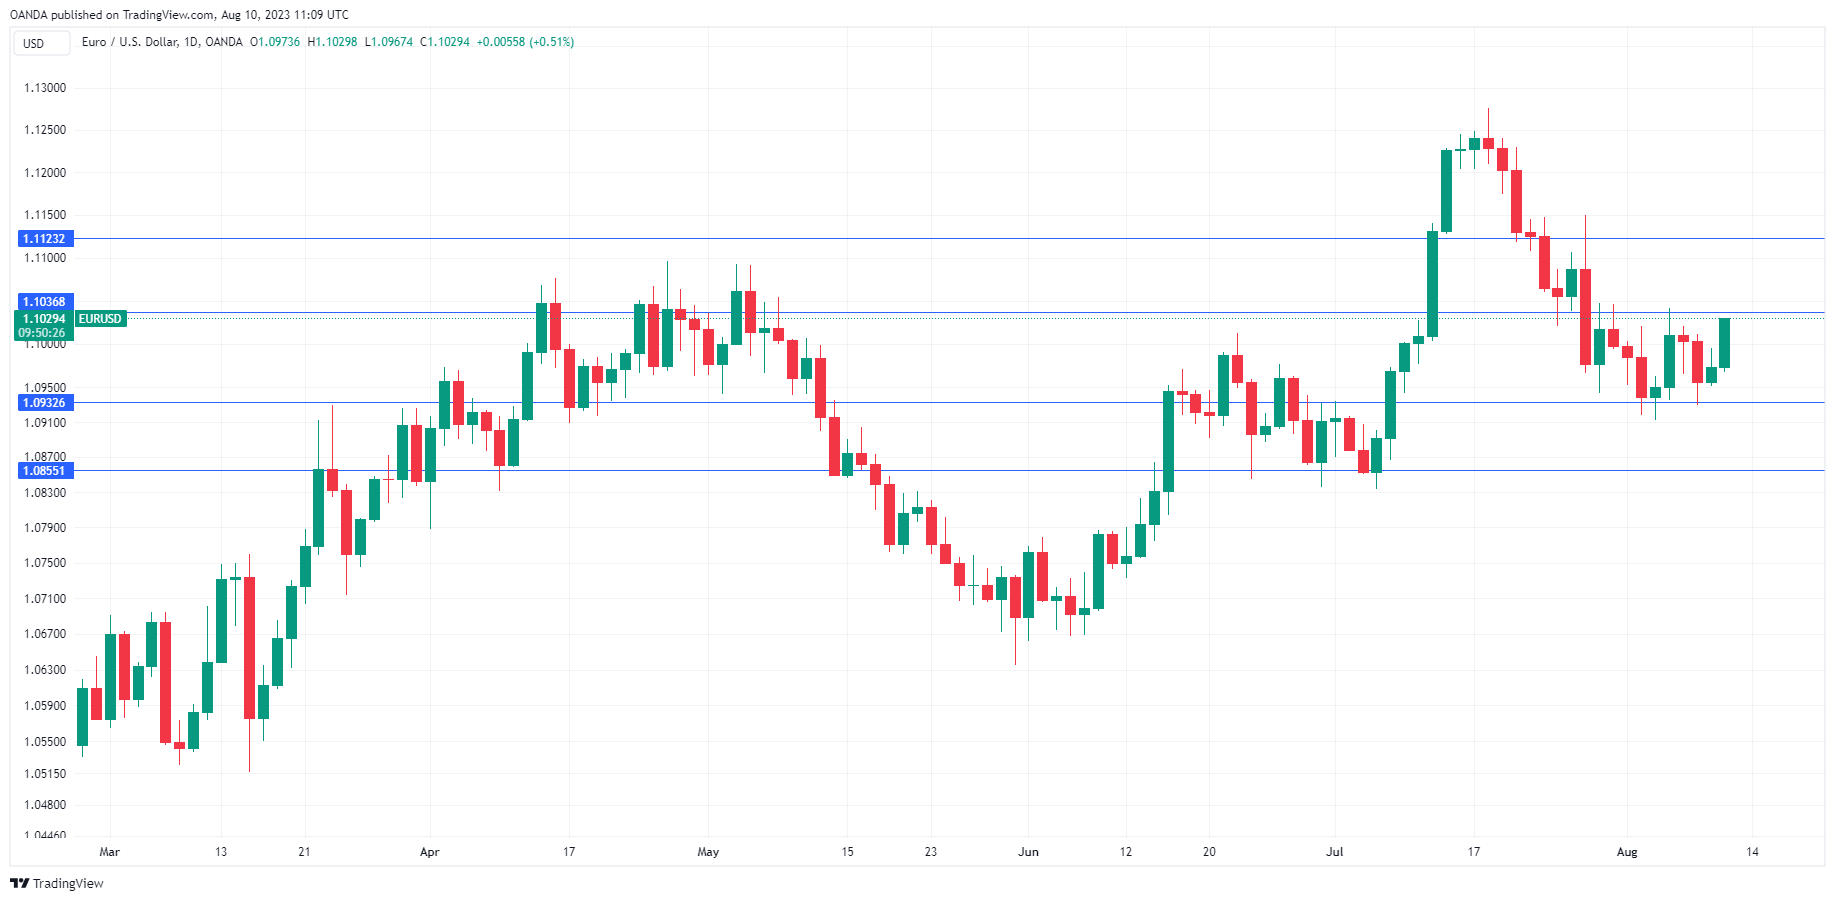
The euro has climbed higher on Thursday. In the European session, EUR/USD is trading at 1.1020, up 0.43%. On the data calendar, there are no economic releases out of the eurozone today. The US releases the July inflation report.
US inflation expected to climb to 3.3%
The Fed has achieved much of its objective in wrestling inflation to lower levels. Inflation has eased to 3% but pushing it down to the 2% target could be difficult. We’ll get a look at July inflation later today, with headline CPI expected to accelerate to 3.3% in July, up from 3.0% in June. Core inflation, which the Fed pays particular attention to, is expected to remain at 4.8%. The Fed is expected to take a pause at the September meeting and barring a shock to the upside, the inflation release should cement a pause at next month’s meeting.
Will the ECB backtrack on tightening?
The European Central Bank hasn’t been as aggressive as the Federal Reserve and other major central banks, but the current cash rate of 4.25% is nothing to sneeze at. The ECB has raised rates nine straight times since July 2022, including two oversize hikes of 0.75%. In June, ECB President Lagarde sounded hawkish, saying that the central bank still had “ground to cover” and that a July rate hike was likely. The ECB followed through with an increase at the July meeting but said that a pause in September was a possibility.
The reason the ECB is sounding more dovish is the soft eurozone economy. Although the 2% inflation target is still far off, there are growing concerns that further hikes will tip the economy into a recession. In the past, it has been southern European countries such as Greece which have dragged down the eurozone economy. Now, fingers are pointing at Germany, the largest and most powerful economy in the bloc.

In years past, the German locomotive helped the eurozone get back on its feet, but now Germany is being referred to as the “sick man of Europe”. Germany’s economy contracted in the second quarter, the only G7 member to show negative growth in Q2.
The German manufacturing and construction sectors are in decline and growth in the services sector has been weak. The slump in China’s economy has only made matters worse. Germany’s economic troubles have dampened eurozone growth and have raised fears that a soft landing for the eurozone could be in jeopardy.
EUR/USD Technical
- EUR/USD is putting pressure on resistance at 1.1036. Above, there is resistance at 1.1123
- There is support at 1.0932 and 1.0855
EURJPY Analysis: Highest Since Fall 2008
Yen Weakening Drivers:
→ rising prices for energy resources. After all, Japan is a major importer.
→ The inflation index CGPI (corporate goods price index) indicates a slowdown in inflation. Therefore, this raises the likelihood that the Bank of Japan will maintain an ultra-loose monetary policy.
The growth of the euro against the yen is facilitated by the fact that the ECB is pursuing a tough policy. Market participants expect that another rate increase could be made in autumn.
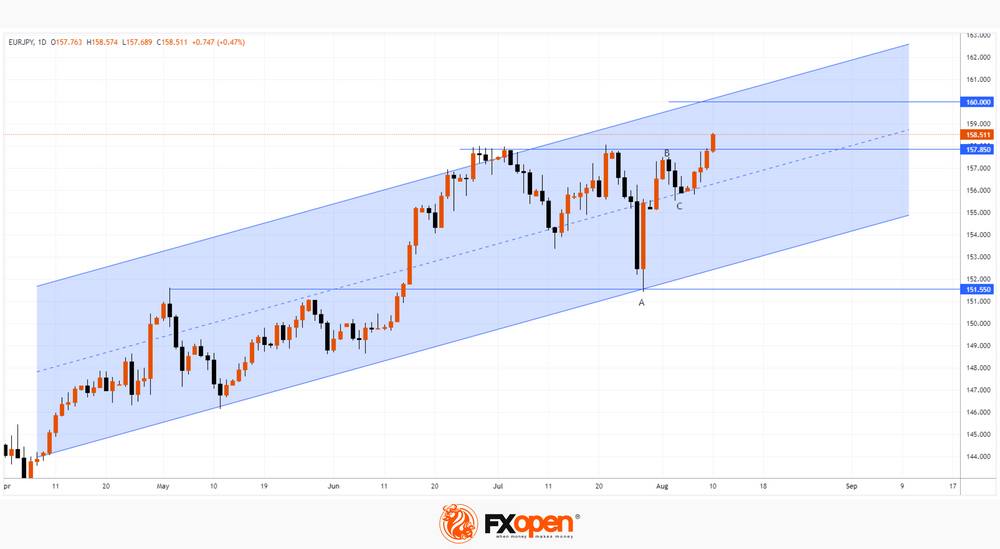
The EUR/JPY chart shows that the rate is in an uptrend. The market recovered quickly from the sharp decline on July 27, a testament to the strength of demand. Another piece of evidence is the amount of B→C retracement after A→B rises. It was only about 30% of the momentum.
Support levels:
→ 157.85. After the breakout by the bulls, the previous resistance may provide support, as was the case with the 151.55 level, which worked as a resistance in May, but provided support at the end of June;
→ median channel line.
Resistance Levels:
→ upper border of the channel;
→ the psychological level of 160 yen per euro.
Today (at 15:30 GMT+3) inflation news in the US is expected, which can shake financial markets a lot.
This article represents the opinion of the Companies operating under the FXOpen brand only. It is not to be construed as an offer, solicitation, or recommendation with respect to products and services provided by the Companies operating under the FXOpen brand, nor is it to be considered financial advice.
XNGUSD: Natural Gas Price Hits 5-month High
The hostilities in Ukraine have drastically changed the world's natural gas transportation routes, and yesterday's information about possible interruptions in the supply of liquefied gas from Australia due to the planned strikes of workers led to the fact that the XNG/USD quote jumped above the psychological level of USD 3.0.
Citigroup analysts believe that gas prices in Europe could double by January if strikes in Australia, which is an important supplier of liquefied gas to Europe and Asia, drag on through the autumn.
And the FT writes that yesterday's growth was accelerated due to the fact that traders closed short positions, thereby increasing demand.
The XNG price chart shows that the extremes of summer are forming an ascending channel, and its upper limit has not yet been reached. The ability of the bulls to gain a foothold above the psychological level of USD 3.0 will indicate the strength of demand.
Important lines on the XNG/USD chart:
→ resistance from the upper border of the channel;
→ support from the median line of the channel;
→ support at USD 2.51;
→ support at USD 2.85 – yesterday this level near the June maximum acted as resistance, but was broken.
Market volatility is likely to continue today as news on US natural gas reserves is scheduled to be released at 17:30 GMT+3.
This article represents the opinion of the Companies operating under the FXOpen brand only. It is not to be construed as an offer, solicitation, or recommendation with respect to products and services provided by the Companies operating under the FXOpen brand, nor is it to be considered financial advice.
Bitcoin and Ether Show Bears’ Strength
Market picture
The crypto market slightly corrected its previous growth, losing 0.3% of its capitalisation to $1.176 trillion. Bitcoin lost 0.5%, Ether – 0.2%, while top altcoins moved from -1.2% (XRP) to +0.9% (Dogecoin).
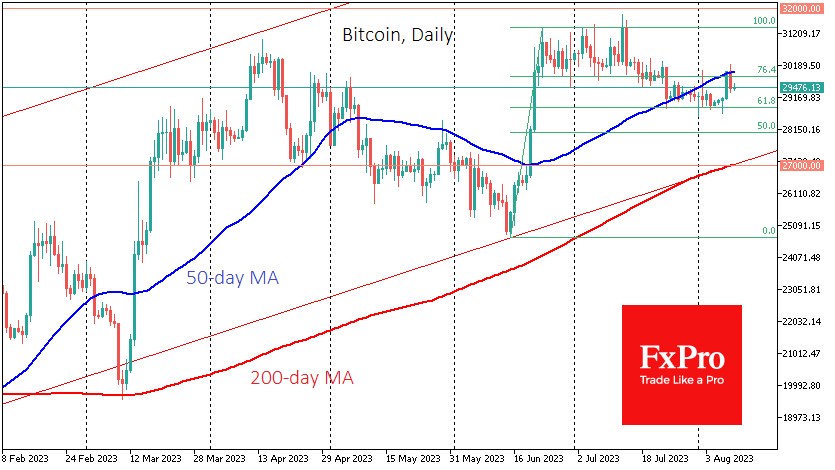
On Wednesday, Bitcoin attempted to climb above $30K and was again pushed back by sellers. The decline in financial markets didn’t help Bitcoin this time, as risk-off sentiment was driven by global economic growth and losses in tech stocks.
The technical picture at the start of the day on Thursday is on the side of the bears, who have managed to keep BTCUSD below its 50-day moving average, signalling a change in the medium-term trend from bullish to bearish. A break below $28.8K can switch the entire crypto market into a faster sell-off mode.
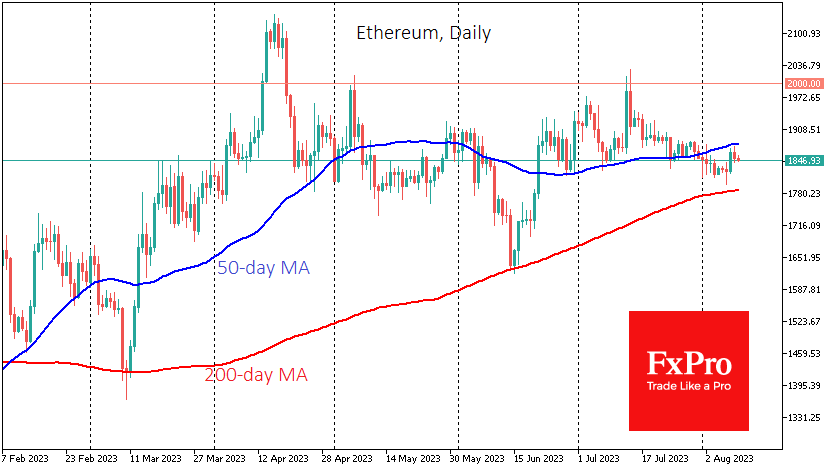
Ethereum has also been trading below its 50-day moving average since late last month, with the sell-off intensifying as it approaches $1900. A break below $1800 would likely accelerate the liquidation of long positions and highlight that the road to recovery for the crypto market will be long and bumpy.
News Background
Another recalculation saw bitcoin mining difficulty rise by 0.12%. The index reached 52.39T. The average hash rate since the previous change was 374.85 EH/s.
Mike Novogratz, Galaxy Digital CEO, citing sources at BlackRock and Invesco, said the first spot bitcoin ETF could be approved in the US sometime before February 2024.
The US Federal Reserve has increased its oversight of regulated banks involved in crypto and stablecoin transactions. Financial institutions must now obtain written authorisation from the agency before issuing, storing, or transacting crypto assets.
The stablecoin market could grow from $125 billion today to $2.8 trillion in the next five years, Bernstein predicts.
Meanwhile, the developers of the Telegram-bot wallet based on The Open Network announced the launch of the beta version of the TON Space non-custodial wallet.